 🏗️ New Construction
3548 Valley Trl · Kathleen, FL
Flood risk 1/10 · Minimal
- FEMA flood zone
- X (unshaded)
- Chance of flooding over 30 yrs
- 0.0%
- Est. flood insurance / yr
- $507 – $1,088
Fire risk 4/10 · Minor
- Est. fire insurance / yr
- $947 – $1,759
Heat risk 8/10 · Major
- Hot days now (above 108°F)
- 7 days/yr
- Hot days in 30 yrs
- 24 days/yr
Wind risk 9/10 · Severe
- Chance of severe wind over 30 yrs
- 99.0%
Air-quality risk 2/10 · Minimal
- Unhealthy air days now
- 1 days/yr
- Unhealthy air days in 30 yrs
- 1 days/yr
Risk factors via First Street. Map © Google.
Why this score? — see what drove the D grade
The composite is a weighted blend of 9 inputs, each scored 0–100. Each bar is that input's sub-score; the figure is the points it added to the 100-point composite (weight × sub-score).
- Cash flow +13.5/30.0
- ARV discount +7.5/15.0
- DSCR +4.1/10.0
- 1% rule +3.8/10.0
- Schools +3.5/10.0
- Rent growth +3.2/5.0
- Livability +3.1/5.0
- Condition / age +2.5/5.0
- Appreciation +0.0/10.0
$189,000
🖨 Deal sheet 📄 Offer letter ✓ Due diligence
Listing remarks MLS
Cleared, flat 1/4+ acre lot in X flood zone meaning no flood insurance is needed. Electric ready and available to set up. This lot is next to a mobile home which is also for sale MLS#L4934834 so if you are looking for a 1/2+ acre lot, take them both to have an oversized lot for play, gardening, fruit trees or adding a mobile and use it as a rental or for a family member.
Key facts
- 0.26 acre lot
- Built 2025
- Listed 92 days
Property features AI
Finance
- Other: Lot about 0.26 acres (approx. 90 x 125); Property ID US-12105-N-232728011017000060-R-N; Unfurnished; Directions: from Valley Farm Dr, left on Valley Trl — house on the left
- Financial info: No lease restrictions
- HOA & community: No association; No association approval required
Exterior
- Utilities: Well water; Septic required; Other utilities
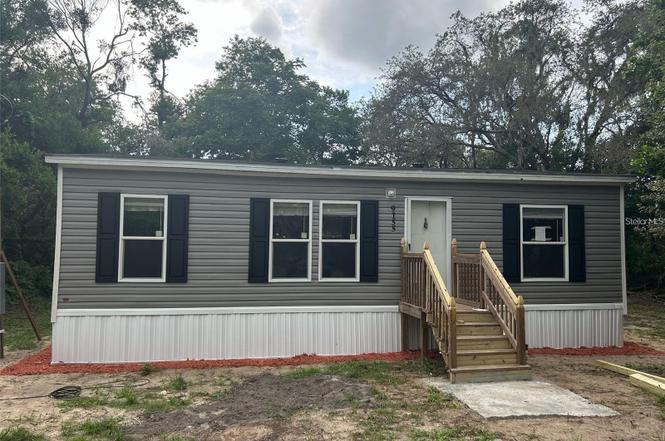
- Home design: Residential manufactured home (double wide); One level; North-facing; Under construction (projected completion March 31, 2026)
- Construction: Vinyl siding; Shingle roof; Crawlspace foundation; New construction; Built by Live Oak (model: Flash); Builder license IH1143538; Year/area: 936 sq ft living area
- Exterior features: Other exterior features; Asphalt road access
Interior
- Kitchen: Built-In Oven; Dishwasher; Refrigerator
- Bedrooms: 3 bedrooms
- Flooring: Laminate
- Bathrooms: 2 full bathrooms
- Heating & cooling: Central heating; Central air conditioning
- Interior features: Other interior features
- Laundry & utility: Other laundry features
Neighborhood map
What this means for you Summary
Snapshot
- This is a 3-bed/2.0-bath land listed at $189k.
Deal economics
- At list price, monthly cash flow is $7 ($79/yr) — positive.
- The deal already cash-flows at list — no discount required.
- To meet the 1% rule (rent ≥ 1% of price), the offer needs to be $166k (12.1% below list).
- Recommended offer: $166k (12.1% below list) — sets the bar for 1% rule.
Location & tenants
- Location reads 62/100 on livability (#752 in FL) — a middle-class / working-renter tenant base. Strengths: cost of living A+, housing A+; Watch: employment D+, schools F, amenities F.
- Polk (suburban): math 39% / reading 43% proficiency, ranked #62 of 73 in FL (top 85%) — families likely to look elsewhere, expect single-tenant / working-renter base with shorter leases.
- Market conditions: Rents rising (+2.8%/yr); 504 active listings in the ZIP; 4 comparable units currently listed for rent nearby; rentals leasing fast (median 3d on market — plan ~1-2 weeks tenant-placement turnaround); 10,384 units permitted in Polk County in 2024 (1,716 in 5+ unit buildings).
Forward outlook
- Local home prices are declining (-3.0%/yr); year-one equity from $1k of loan paydown is wiped out by about $6k of value loss. Plan a longer hold.
- Polk County population projected at +33% by 2050 — long-run rental-demand tailwind backs the buy-and-hold thesis.
Negotiation context
- It's been on market 92 days — a 9% lower offer ($172k) is reasonable based on typical stale-listing flexibility.
- 6 sale attempts since 6y ago with the ask held roughly flat each time — persistent listings suggest the price (not the market) is what's stuck; bring a comps-based counter.
- Current owner paid $25k; list at $189k implies a 656% gain — meaningful room to come down on a strong offer.
Risks & watch-outs
- Climate carrying-cost: severe wind risk, 99% chance of damaging wind over 30y; extreme-heat days projected 7→24/yr by 2055 (HVAC capex compounding) — expect insurance premiums to compound above CPI over the hold.
Questions for the listing agent
- It's been on market 92 days. Have you received any prior offers? Is the seller open to a 12% concession, seller financing, or rate buy-down credit?
- Why hasn't it sold? Are there any deal-killer items the seller is aware of (foundation, flood, title, zoning, code violations)?
- Is there a deadline driving the sale (1031 exchange, divorce, estate, relocation)? That informs how much negotiation room exists.
- Schools are F-rated, which usually means shorter tenancies and higher turnover. Who's the typical renter profile here, and what's been the actual vacancy rate?
- The area grade is low — what's the realistic commute time and amenity access for the typical tenant pool here? Any planned neighborhood developments (good or bad) we should know about?
- What's the average days-on-market for RENTAL listings here right now (not sales)? A rising rental-DOM trend means longer vacancies and softer asking-rent achievability than the comps imply.
- What's the recent tenant-quality profile in this submarket — average credit score on applications, eviction rate, late-payment / NSF rate, and stable-employment percentage? A property-management company in the area should have these aggregated.
- How much new for-sale + rental construction is in the pipeline within 1–3 miles? Heavy new supply typically softens prices + rents 12–24 months out; constrained supply supports both.
Investment metrics
- 1% rule
- 0.88% ✗
- Cap rate
- 6.33%
- Cash-on-cash
- 0.15%
- DSCR
- 1.01
- GRM
- 9.5
CMA / ARV
No comps found within radius.
Projected returns pro-forma
-3.0% appreciation · 2.78% rent growth · sell at horizon
- IRR
- -16.3%
- Equity multiple
- 0.42×
- Total profit
- $-30,549
- Equity at exit
- $28,181
- IRR
- -8.4%
- Equity multiple
- 0.48×
- Total profit
- $-27,460
- Equity at exit
- $16,341
Cash invested: $52,920 (down + closing). Projections, not guarantees.
Landlord ↔ Tenant lean methodology
- Overall (STATE)
- 87 Strongly Landlord-Friendly
- State Florida
- 87 Strongly Landlord-Friendly · R+3
- County
- — inherits STATE
- City
- — inherits STATE
ZIP-level market 33810
- Rents YoY
- 2.8%
- Active inventory
- 504
- Price-to-rent
- 9.5×
Monthly cashflow live
- Estimated rent
- $1,662 medium interval (Pro) →
- Mortgage (P&I)
- −$991
- Tax est. 1.5%
- −$236 /mo · $2,835/yr
- Insurance
- −$79
- HOA
- −$0
- Vacancy / Maint / Mgmt
- −$349
- Net cashflow
- $7
Break-even live
UW: 25.0% down · 7.5% · 30yr · 1.5% tax · 5.0% vac · 8.0% maint · 8.0% mgmt
Financing live
Cash to close
- Down payment
- $47,250
- Closing costs
- $5,670
- Reserves months
- —
- Total cash needed
- —
Loan-product check · same deal, 3 products live
Conventional
25% down · 7.5% · 30yr
- Down + closing
- —
- Monthly P&I
- —
- Monthly cashflow
- —
- DSCR
- —
- Eligible?
- —
Personal DTI + credit; lowest rate.
DSCR
20% down · 8.5% · 30yr
- Down + closing
- —
- Monthly P&I
- —
- Monthly cashflow
- —
- DSCR
- —
- Eligible?
- —
No personal income docs; deal must DSCR.
Hard money
10% down · 12.0% · 12mo
- Down + closing
- —
- Monthly P&I
- —
- Monthly cashflow
- —
- DSCR
- —
- Eligible?
- —
Short-term bridge; refi at stabilization.
Rent comps 4 comps
| Address | Beds | Baths | Sqft | Rent | $/sqft | DOM | Units | Dist |
|---|---|---|---|---|---|---|---|---|
| 5138 Rollinglen Loop W Lakeland, FL | 3.0 | 2.0 | 924 | $1,400 | $1.52 | 3d | 1 | 0.34mi |
| 5442 Lewellyn Rd Lakeland, FL | 2.0 | 1.0 | 750 | $1,295 | $1.73 | 14d | 1 | 0.59mi |
| 3276 Mount Tabor Rd Lot 28 Lakeland, FL | 2.0 | 2.0 | 896 | $1,295 | $1.45 | 3d | 1 | 0.80mi |
| 3276 Mount Tabor Rd Lakeland, FL | 3.0 | 2.0 | 896 | $1,195 | $1.33 | 3d | 1 | 0.80mi |
Listing history 20 events
-
2026-06-18days on market $189,000 Active 92 DOM
-
2026-06-17status $189,000 Active 91 DOM
-
2026-05-12status Pending
-
2026-02-10$189,000 Active
-
2026-01-08historical
-
2025-11-04price $199,000
-
2025-07-24status Active
-
2025-05-09status Pending
-
2025-04-10status Active
-
2025-01-22status Pending
-
2025-01-09$210,000 Active
-
2023-03-08soldstatus $25,000 Closed 373-char remark
Show marketing remark (373 chars)
Cleared, flat 1/4+ acre lot in X flood zone meaning no flood insurance is needed. Electric ready and available to set up. This lot is next to a mobile home which is also for sale MLS#L4934834 so if you are looking for a 1/2+ acre lot, take them both to have an oversized lot for play, gardening, fruit trees or adding a mobile and use it as a rental or for a family member.
-
2023-02-15status Pending 373-char remark
Show marketing remark (373 chars)
Cleared, flat 1/4+ acre lot in X flood zone meaning no flood insurance is needed. Electric ready and available to set up. This lot is next to a mobile home which is also for sale MLS#L4934834 so if you are looking for a 1/2+ acre lot, take them both to have an oversized lot for play, gardening, fruit trees or adding a mobile and use it as a rental or for a family member.
-
2023-01-27$41,900 Active 373-char remark
Show marketing remark (373 chars)
Cleared, flat 1/4+ acre lot in X flood zone meaning no flood insurance is needed. Electric ready and available to set up. This lot is next to a mobile home which is also for sale MLS#L4934834 so if you are looking for a 1/2+ acre lot, take them both to have an oversized lot for play, gardening, fruit trees or adding a mobile and use it as a rental or for a family member.
-
2020-04-20soldstatus $10,500
-
2020-04-17soldstatus $10,500 Sold
-
2020-04-11status Pending
-
2020-03-09$17,500 Active
-
2019-12-18soldstatus $37,300
-
2002-01-23soldstatus $89,700
ⓘ Source: listings_history table (triggers on properties + properties_extension) + one-shot
backfill from property_details.listing_events for pre-trigger history.
Climate risk First Street
- Flood 1/10 Low FEMA zone X (unshaded) · 0% chance over 30 yrs
- Wildfire 4/10 Moderate
- Heat 8/10 Severe 7 d/yr ≥108°F today · 24 d/yr by 30 yrs out
- Wind 9/10 Extreme 99% chance of damaging wind over 30 yrs
- Air quality 2/10 Low 1 unhealthy d/yr today · 1 by 30 yrs out
Nearby sold comps map
Loading sold comps map…
Walkable amenities ~0.75 mi
Loading nearby amenities…
Taxation est. · year 1
- Rental income
- $19,940
- − Mortgage interest
- −$10,587
- − Property taxes
- −$2,835
- − Insurance
- −$945
- − Repairs & maintenance
- −$1,595
- − Management
- −$1,595
- − Depreciation
- −$5,498
- Taxable loss
- −$3,116
- Est. tax savings @ 24.0%
- +$748
- After-tax cash flow
- $827/yr
For passive investors: Depreciation is non-cash, so a rental often shows a tax loss while cash-flowing — sheltering income. Rental losses are passive: they offset passive income freely, and up to $25,000/yr can offset ordinary (W-2) income if you actively participate and your MAGI is under $100k (phasing out to $0 by $150k); unused losses carry forward. On sale, claimed depreciation is recaptured at up to 25%, and gains may owe capital-gains tax (a 1031 exchange can defer both). Figures are a year-1 estimate at your 24.0% rate — not tax advice; consult a CPA.
Schools (NCES district)
- District
- Polk
- NCES district ID
- 1201590
- Math proficiency
- 39% ▼ -11.00%
- Reading proficiency
- 43% ▼ -4.00%
- Median HH income
- $43,979
- Composite
- 34.74/100
- National rank
- #5132
- State rank
- #62 of 73 in FL
Livability — Kathleen
- Score
- 62/100
- State rank
- #752
- US rank
- #16450
Category grades
Schools grade is shown separately in the Schools card above.
Census & demographics
- Census place
- Kathleen, FL
- County
- Polk County · 740,051 people
- City population
- 52,734
- Metro
- Lakeland-Winter Haven, FL
- Population (ZIP)
- 55,137
- Household income
- $69,986
- Rent vs Own
- Severe rent burden
- 1208.0
Population outlook (Polk County) Hauer SSP2
- Today (2025)
- 752,975 people
- By 2030
- 804,621 · +6.9%
- By 2040
- 906,117 · +20.3%
- By 2050
- 1,000,476 · +32.9%
- By 2075
- 1,197,520 · +59.0%
- By 2100
- 1,271,518 · +68.9%
Race, ethnicity, and origin ACS 2023
- Neighborhood character
- Diverse neighborhood (Simpson 0.58)
- Race & ethnicity
- White 59% Hispanic / Latino 23% Black 12% Two or more races 10% Asian 2%
- Hispanic origin (detail)
- Mexican 5% Puerto Rican 9% Cuban 5%
- Common ancestry
- Italian 2% Lithuanian 2% Slovak 1%
- Foreign-born
- 9% · Canada, Jamaica
- Languages at home
- 79% English-only · Spanish 17% French/Haitian/Cajun 1% Tagalog/Filipino 1%
Political lean MEDSL · Polk
- 2024 margin
- Strong R (+20.7) · D 39.2% · R 59.9%
- 2008→2024 swing
- -14.6pp toward R · 2008: -6.1pp · 2024: -20.7pp
- All cycles
- 2024: R+20.7 2020: R+14.4 2016: R+14.1 2012: R+6.8 2008: R+6.1
Not yet ingested
- Civics
- —
Market trends
- HPI YoY
- ▼ -194.94%
- Current HPI
- 320.7366
- Rent YoY
- ▲ 2.78%
- Metro
- Lakeland-Winter Haven, FL
- State GDP YoY
- ▲ 3.28%
- F500 in state
- 36
Industry mix (Fortune 500 HQ in FL)
| Industry | F500 HQs | Revenue |
|---|---|---|
| Industrial Technology | 2 | $29B |
|
||
| Insurance | 2 | $17B |
|
||
| Retail | 1 | $60B |
|
||
| Technology Distribution | 1 | $58B |
|
||
| Homebuilding | 1 | $35B |
|
||
| Technology Manufacturing | 1 | $35B |
|
||
Price history
+110.7% since first listed18 events — show timeline
- 2026-05-12 Pending — Stellar MLS as Distributed by MLS Grid
- 2026-02-10 Listed $189,000 Stellar MLS as Distributed by MLS Grid
- 2026-01-08 Listing Removed — Stellar MLS as Distributed by MLS Grid
- 2025-11-04 Price Changed $199,000 Stellar MLS as Distributed by MLS Grid
- 2025-07-24 Relisted — Stellar MLS as Distributed by MLS Grid
- 2025-05-09 Pending — Stellar MLS as Distributed by MLS Grid
- 2025-04-10 Relisted — Stellar MLS as Distributed by MLS Grid
- 2025-01-22 Pending — Stellar MLS as Distributed by MLS Grid
- 2025-01-09 Listed $210,000 Stellar MLS as Distributed by MLS Grid
- 2023-03-08 Sold (MLS) $25,000 Stellar MLS as Distributed by MLS Grid
- 2023-02-15 Pending — Stellar MLS as Distributed by MLS Grid
- 2023-01-27 Listed $41,900 Stellar MLS as Distributed by MLS Grid
- 2020-04-20 Sold (Public Records) $10,500 Public Records
- 2020-04-17 Sold (MLS) $10,500 Stellar MLS as Distributed by MLS Grid
- 2020-04-11 Pending — Stellar MLS as Distributed by MLS Grid
- 2020-03-09 Listed $17,500 Stellar MLS as Distributed by MLS Grid
- 2019-12-18 Sold (Public Records) $37,300 Public Records
- 2002-01-23 Sold (Public Records) $89,700 Public Records
Property tax history
+10.4%/yrLatest (2025): $374 · -0.1% YoY. Source: county tax records.
Cash-flow waterfall
monthlySold comps — $/sqft
last 12 mo · ≤1 miLoading sold comps…