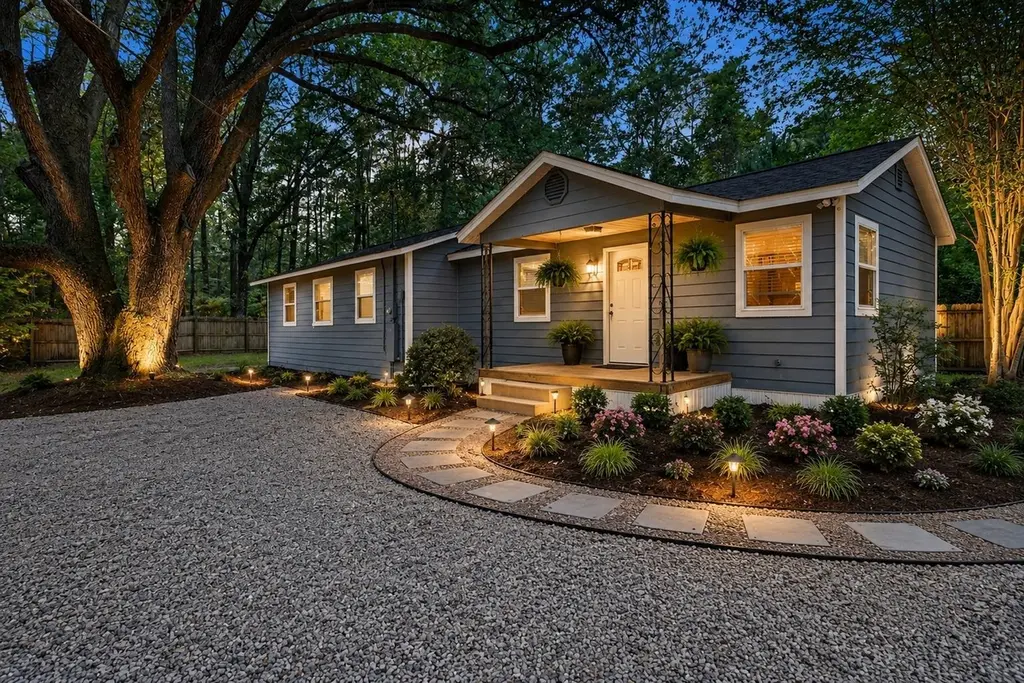
10632 Capitola Rd · Capitola, FL
Flood risk 1/10 · Minimal
- FEMA flood zone
- A
- Chance of flooding over 30 yrs
- 0.0%
- Est. flood insurance / yr
- $1,009 – $1,996
Fire risk 4/10 · Minor
- Est. fire insurance / yr
- $947 – $1,759
Heat risk 8/10 · Major
- Hot days now (above 107°F)
- 7 days/yr
- Hot days in 30 yrs
- 20 days/yr
Wind risk 9/10 · Severe
- Chance of severe wind over 30 yrs
- 99.0%
Air-quality risk 4/10 · Minor
- Unhealthy air days now
- 4 days/yr
- Unhealthy air days in 30 yrs
- 4 days/yr
Risk factors via First Street. Map © Google.
Why this score? — see what drove the B grade
The composite is a weighted blend of 9 inputs, each scored 0–100. Each bar is that input's sub-score; the figure is the points it added to the 100-point composite (weight × sub-score).
- Cash flow +27.6/30.0
- ARV discount +15.0/15.0
- DSCR +9.7/10.0
- 1% rule +6.3/10.0
- Schools +4.3/10.0
- Rent growth +2.5/5.0
- Livability +2.5/5.0
- Condition / age +2.5/5.0
- Appreciation +0.0/10.0
$225,000
🖨 Deal sheet 📄 Offer letter ✓ Due diligence
Listing remarks MLS
Great school area. Great for a first home buyer or an investor! Vacant, show anytime. Call listing agent
Key facts
- Private lot
- Mid-century home
- Room to relax
Tags
Property features AI
Finance
- Financial info: Offered for sale
Exterior
- Parking: Driveway
- Utilities: Septic tank
- Home design: Single-story; Wood siding
- Construction: Wood siding construction
- Exterior features: Covered patio/porch; Deck; Porch; Privacy fencing; Publicly maintained road
Interior
- Kitchen: Dishwasher; Icemaker; Microwave; Oven; Range; Refrigerator; Pantry
- Bedrooms: Bedroom 2 (12 x 12)
- Flooring: Plank; Tile; Vinyl
- Bathrooms: 2 full bathrooms
- Heating & cooling: Central heating (electric); Central air; Ceiling fan(s)
- Interior features: Stall shower; Window treatments; Pantry; Walk-in closet(s)
- Laundry & utility: Utility room
Neighborhood map
What this means for you Summary
Snapshot
- This is a 3-bed/1.0-bath single-family listed at $225k.
Deal economics
- At list price, monthly cash flow is $549 ($7k/yr) — positive.
- The deal already cash-flows at list — no discount required.
- Meets the 1% rule at list price ($3k rent vs $225k).
- Recommended offer: $218k (3.0% below list) — sets the bar for market timing.
Location & tenants
- Location reads: area grade B — affects rentability + tenant quality, not the cash-flow math above.
- Leon (urban): math 48% / reading 53% proficiency, ranked #33 of 73 in FL (top 45%) — acceptable for families but not a draw, mixed tenant base, ~2y average lease.
- Market conditions: 91 active listings in the ZIP; high-income renter base; 1,765 units permitted in Leon County in 2024 (975 in 5+ unit buildings).
Forward outlook
- Local home prices are declining (-3.0%/yr); year-one equity from $2k of loan paydown is wiped out by about $7k of value loss. Plan a longer hold.
- Leon County population projected at +23% by 2050 — long-run rental-demand tailwind backs the buy-and-hold thesis.
Negotiation context
- It's been on market 31 days — a 3% lower offer ($218k) is reasonable based on typical stale-listing flexibility.
- 5 sale attempts since 15y ago with the ask held roughly flat each time — persistent listings suggest the price (not the market) is what's stuck; bring a comps-based counter.
- Current owner paid $45k; list at $225k implies a 400% gain — meaningful room to come down on a strong offer.
Risks & watch-outs
- Watch-outs: flood insurance adds $125/mo; built in 1949 — expect roof / HVAC / electrical / plumbing capex.
- Climate carrying-cost: in FEMA flood zone A (mandatory federal flood insurance); severe wind risk, 99% chance of damaging wind over 30y; extreme-heat days projected 7→20/yr by 2055 (HVAC capex compounding) — expect insurance premiums to compound above CPI over the hold.
Questions for the listing agent
- It's been on market 31 days. Have you received any prior offers? Is the seller open to a 3% concession, seller financing, or rate buy-down credit?
- Built in 1949 — when were the roof, HVAC, electrical panel, plumbing, and water heater last replaced?
- What's the actual annual flood-insurance premium (NFIP or private), and is the property in a SFHA with mandatory coverage?
- Is there a deadline driving the sale (1031 exchange, divorce, estate, relocation)? That informs how much negotiation room exists.
- What's the average days-on-market for RENTAL listings here right now (not sales)? A rising rental-DOM trend means longer vacancies and softer asking-rent achievability than the comps imply.
- What's the recent tenant-quality profile in this submarket — average credit score on applications, eviction rate, late-payment / NSF rate, and stable-employment percentage? A property-management company in the area should have these aggregated.
- How much new for-sale + rental construction is in the pipeline within 1–3 miles? Heavy new supply typically softens prices + rents 12–24 months out; constrained supply supports both.
Investment metrics
- 1% rule
- 1.13% ✓
- Cap rate
- 9.89%
- Cash-on-cash
- 12.84%
- DSCR
- 1.57
- GRM
- 7.4
CMA / ARV
- ARV (on-the-fly)
- $282,951
- Comps found
- 11
Show comp detail 11 sales within ~0.75 mi
| Address | Dist | Beds/Ba | Sqft | Sold | Price | $/sf | Match |
|---|---|---|---|---|---|---|---|
| 953 Cap Tram Rd | 0.63mi | 3/2.0 | 1,362 (+2%) | 10mo | $300,000 | $220 | 56 |
| 947 Cap Tram Rd | 0.64mi | 3/2.0 | 1,362 (+2%) | 10mo | $295,000 | $217 | 55 |
| 955 Cap Tram Rd | 0.63mi | 3/2.0 | 1,362 (+2%) | 10mo | $295,000 | $217 | 55 |
| 937 Cap Tram Rd | 0.67mi | 3/2.0 | 1,420 (+6%) | 2mo | $325,000 | $229 | 54 |
| 941 Cap Tram Rd | 0.67mi | 3/3.0 | 1,492 (+11%) | 7mo | $325,000 | $218 | 36 |
| 938 Cap Tram Rd | 0.62mi | 3/2.0 | 1,200 (-10%) | 17mo | $253,000 | $211 | 36 |
| 934 Cap Tram Rd | 0.62mi | 3/2.0 | 1,200 (-10%) | 18mo | $249,000 | $208 | 34 |
| 946 Cap Tram | 0.61mi | 3/2.0 | 1,200 (-10%) | 21mo | $249,500 | $208 | 32 |
| 942 Cap Tram Rd | 0.62mi | 3/2.0 | 1,200 (-10%) | 21mo | $249,000 | $208 | 32 |
| 930 Cap Tram Rd | 0.63mi | 3/2.0 | 1,200 (-10%) | 21mo | $250,000 | $208 | 32 |
| 950 Cap Tram Rd | 0.61mi | 3/2.0 | 1,200 (-10%) | 23mo | $250,000 | $208 | 31 |
Match score weights: distance 35% · size 25% · config 20% · recency 20%. Top-matched comps best support the ARV.
Projected returns pro-forma
-3.0% appreciation · 3.0% rent growth · sell at horizon
- IRR
- -0.6%
- Equity multiple
- 0.98×
- Total profit
- $-1,530
- Equity at exit
- $33,548
- IRR
- 9.0%
- Equity multiple
- 1.69×
- Total profit
- $43,595
- Equity at exit
- $19,454
Cash invested: $63,000 (down + closing). Projections, not guarantees.
Landlord ↔ Tenant lean methodology
- Overall (STATE)
- 87 Strongly Landlord-Friendly
- State Florida
- 87 Strongly Landlord-Friendly · R+3
- County
- — inherits STATE
- City
- — inherits STATE
ZIP-level market 32317
- Home prices YoY
- -26.5%
- Active inventory
- 91
- Price-to-rent
- 7.4×
Monthly cashflow live
- Estimated rent
- $2,546 medium interval (Pro) →
- Mortgage (P&I)
- −$1,180
- Tax from tax record
- −$64 /mo · $764/yr
- Insurance
- −$94
- Flood insurance flood zone
- −$125 /mo · $1,502/yr
- HOA
- −$0
- Vacancy / Maint / Mgmt
- −$535
- Net cashflow
- $549
Break-even live
UW: 25.0% down · 7.5% · 30yr · 1.5% tax · 5.0% vac · 8.0% maint · 8.0% mgmt
Financing live
Cash to close
- Down payment
- $56,250
- Closing costs
- $6,750
- Reserves months
- —
- Total cash needed
- —
Loan-product check · same deal, 3 products live
Conventional
25% down · 7.5% · 30yr
- Down + closing
- —
- Monthly P&I
- —
- Monthly cashflow
- —
- DSCR
- —
- Eligible?
- —
Personal DTI + credit; lowest rate.
DSCR
20% down · 8.5% · 30yr
- Down + closing
- —
- Monthly P&I
- —
- Monthly cashflow
- —
- DSCR
- —
- Eligible?
- —
No personal income docs; deal must DSCR.
Hard money
10% down · 12.0% · 12mo
- Down + closing
- —
- Monthly P&I
- —
- Monthly cashflow
- —
- DSCR
- —
- Eligible?
- —
Short-term bridge; refi at stabilization.
Listing history 20 events
-
2026-06-10days on market $225,000 Active 31 DOM
-
2026-06-09days on market $225,000 Active 30 DOM
-
2026-06-08days on market $225,000 Active 29 DOM
-
2026-06-07days on market $225,000 Active 28 DOM
-
2026-06-05days on market $225,000 Active 25 DOM
-
2026-06-03days on market $225,000 Active 24 DOM
-
2026-06-02remarks 621-char remark
-
2026-06-02pricedays on market $225,000 Active 23 DOM
-
2026-06-01days on market $235,000 Active 22 DOM
-
2026-05-31days on market $235,000 Active 21 DOM
-
2026-05-30days on market $235,000 Active 20 DOM
-
2026-05-06$235,000 Active
-
2017-05-28soldstatus $45,000 104-char remark
Show marketing remark (104 chars)
Great school area. Great for a first home buyer or an investor! Vacant, show anytime. Call listing agent
-
2016-09-28$47,500 104-char remark
Show marketing remark (104 chars)
Great school area. Great for a first home buyer or an investor! Vacant, show anytime. Call listing agent
-
2016-03-15historical
-
2014-11-20$42,900
-
2011-07-07historical
-
2011-04-06$49,900
-
2011-03-30historical
-
2011-02-02$59,900
ⓘ Source: listings_history table (triggers on properties + properties_extension) + one-shot
backfill from property_details.listing_events for pre-trigger history.
Tax reassessment forecast FL · Resets to sale price
- Current annual tax
- $764 · $64/mo
- Projected year-2 tax
- $1,868 · $156/mo
- Expected delta
- +$1,103/yr (+$92/mo · 144.4%)
ⓘ Screening estimate from a state-policy table — verify with the county assessor before closing.
Climate risk First Street
- Flood 1/10 Low FEMA zone A · 0% chance over 30 yrs
- Wildfire 4/10 Moderate
- Heat 8/10 Severe 7 d/yr ≥107°F today · 20 d/yr by 30 yrs out
- Wind 9/10 Extreme 99% chance of damaging wind over 30 yrs
- Air quality 4/10 Moderate 4 unhealthy d/yr today · 4 by 30 yrs out
Nearby sold comps map
Loading sold comps map…
Walkable amenities ~0.75 mi
Loading nearby amenities…
Taxation est. · year 1
- Rental income
- $30,551
- − Mortgage interest
- −$12,603
- − Property taxes
- −$764
- − Insurance
- −$2,628
- − Repairs & maintenance
- −$2,444
- − Management
- −$2,444
- − Depreciation
- −$6,545
- Taxable income
- $3,122
- Est. tax owed @ 24.0%
- −$749
- After-tax cash flow
- $5,835/yr
For passive investors: Depreciation is non-cash, so a rental often shows a tax loss while cash-flowing — sheltering income. Rental losses are passive: they offset passive income freely, and up to $25,000/yr can offset ordinary (W-2) income if you actively participate and your MAGI is under $100k (phasing out to $0 by $150k); unused losses carry forward. On sale, claimed depreciation is recaptured at up to 25%, and gains may owe capital-gains tax (a 1031 exchange can defer both). Figures are a year-1 estimate at your 24.0% rate — not tax advice; consult a CPA.
Schools (NCES district)
- District
- Leon
- NCES district ID
- 1201110
- Math proficiency
- 48% ▼ -13.00%
- Reading proficiency
- 53% ▼ -5.00%
- Median HH income
- $46,339
- Composite
- 42.84/100
- National rank
- #3131
- State rank
- #33 of 73 in FL
Livability — Capitola
No livability data for this city. (Only ~50 U.S. cities are tracked.)
Census & demographics
- County
- Leon County · 294,472 people
- Metro
- Tallahassee, FL
- Population (ZIP)
- 14,654
- Household income
- $128,690
- Rent vs Own
- Severe rent burden
- 143.0
Population outlook (Leon County) Hauer SSP2
- Today (2025)
- 315,507 people
- By 2030
- 330,677 · +4.8%
- By 2040
- 358,465 · +13.6%
- By 2050
- 386,804 · +22.6%
- By 2075
- 465,480 · +47.5%
- By 2100
- 519,959 · +64.8%
Race, ethnicity, and origin ACS 2023
- Neighborhood character
- Predominantly White (67%)
- Race & ethnicity
- White 67% Black 15% Hispanic / Latino 8% Two or more races 7% Asian 7%
- Hispanic origin (detail)
- Mexican 1% Puerto Rican 3% Cuban 1%
- Common ancestry
- Slovak 4% Lithuanian 2% Italian 2%
- Foreign-born
- 8% · Canada, China, South Korea
- Languages at home
- 89% English-only · Spanish 5% Other Asian/Pacific 3% Other Indo-European 2%
Political lean MEDSL · Leon
- 2024 margin
- Strong D (+21.8) · D 60.3% · R 38.5% · Other 1.2%
- 2008→2024 swing
- -2.5pp toward R · 2008: 24.3pp · 2024: 21.8pp
- All cycles
- 2024: D+21.8 2020: D+28.3 2016: D+25.1 2012: D+23.6 2008: D+24.3
Not yet ingested
- Civics
- —
Market trends
- HPI YoY
- ▼ -88.81%
- Current HPI
- 246.3858
- Rent YoY
- —
- Metro
- Tallahassee, FL
- State GDP YoY
- ▲ 3.28%
- F500 in state
- 36
Industry mix (Fortune 500 HQ in FL)
| Industry | F500 HQs | Revenue |
|---|---|---|
| Industrial Technology | 2 | $29B |
|
||
| Insurance | 2 | $17B |
|
||
| Retail | 1 | $60B |
|
||
| Technology Distribution | 1 | $58B |
|
||
| Homebuilding | 1 | $35B |
|
||
| Technology Manufacturing | 1 | $35B |
|
||
Price history
+292.3% since first listed9 events — show timeline
- 2026-05-06 Listed $235,000 CATRS
- 2017-05-28 Sold (MLS) $45,000 CATRS
- 2016-09-28 Listed $47,500 CATRS
- 2016-03-15 Listing Removed — CATRS
- 2014-11-20 Listed $42,900 CATRS
- 2011-07-07 Listing Removed — CATRS
- 2011-04-06 Listed $49,900 CATRS
- 2011-03-30 Listing Removed — CATRS
- 2011-02-02 Listed $59,900 CATRS
Property tax history
-3.1%/yrLatest (2025): $764 · +1.1% YoY. Source: county tax records.
Cash-flow waterfall
monthlySold comps — $/sqft
last 12 mo · ≤1 miLoading sold comps…