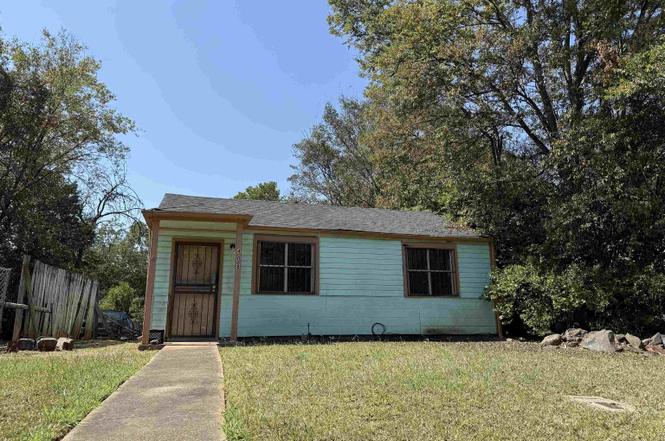
408 Henson St · Midfield, AL
Flood risk 1/10 · Minimal
- FEMA flood zone
- X (unshaded)
- Chance of flooding over 30 yrs
- 0.0%
- Est. flood insurance / yr
- $507 – $1,088
Fire risk 1/10 · Minimal
- Est. fire insurance / yr
- $916 – $1,700
Heat risk 6/10 · Moderate
- Hot days now (above 108°F)
- 7 days/yr
- Hot days in 30 yrs
- 19 days/yr
Wind risk 6/10 · Moderate
- Chance of severe wind over 30 yrs
- 27.0%
Air-quality risk 4/10 · Minor
- Unhealthy air days now
- 5 days/yr
- Unhealthy air days in 30 yrs
- 5 days/yr
Risk factors via First Street. Map © Google.
Why this score? — see what drove the B- grade
The composite is a weighted blend of 9 inputs, each scored 0–100. Each bar is that input's sub-score; the figure is the points it added to the 100-point composite (weight × sub-score).
- Cash flow +30.0/30.0
- 1% rule +10.0/10.0
- DSCR +10.0/10.0
- ARV discount +7.5/15.0
- Livability +3.2/5.0
- Appreciation +2.6/10.0
- Condition / age +2.5/5.0
- Rent growth +2.1/5.0
- Schools +0.7/10.0
$49,900
🖨 Deal sheet 📄 Offer letter ✓ Due diligence
Listing remarks
One level 2BR/1BA investment property with tons of potential! 2023 electric water heater, ceiling fans, and partially fenced . 22-acre lot with mature trees. Driveway parking included. Home needs updates and does not currently have HVAC—perfect for investors or handy buyers ready to make it their own. Great potential rental property or starter home opportunity!
Key facts
- Partially fenced
- Ceiling fans
- Driveway parking
Tags
Neighborhood map
What this means for you Summary
Snapshot
- This is a 2-bed/1.0-bath single-family listed at $50k.
Deal economics
- At list price, monthly cash flow is $341 ($4k/yr) — positive.
- The deal already cash-flows at list — no discount required.
- Meets the 1% rule at list price ($875 rent vs $50k).
- Recommended offer: $44k (12.0% below list) — sets the bar for market timing.
- Cap rate 14.5% vs local median 10.0% in Midfield — top-decile yield for the area; either an underpriced asset or a hidden risk that comps aren't pricing in. Stress-test before assuming the spread holds.
Location & tenants
- Location reads 64/100 on livability (#164 in AL) — a middle-class / working-renter tenant base. Strengths: commute A+, cost of living A+, housing A+; Watch: amenities F, employment F, health & safety F.
- Midfield City (suburban): math 2% / reading 14% proficiency, ranked #126 of 129 in AL (top 98%) — low school quality limits family demand, transient renter base, plan for 1-2y turnover; 83% free/reduced lunch — lower-income household profile, screen leases tightly.
- Zoned schools: Midfield Elementary School (math 2% / reading 17%, grade F, #568 of 627 statewide, top 94%, 390 students, 84% FRL); Midfield High School (math 2% / reading 2%, grade F, #291 of 305 statewide, top 100%, 340 students, 87% FRL) — zoned schools at 86% FRL track the district average.
- Market conditions: Rents soft (-1.5%/yr); 87 active listings in the ZIP; 10 comparable units currently listed for rent nearby; rentals lingering (median 44d on market — plan ~5-8 weeks vacancy on turnover, expect pricing pressure); 60% of comp listings sitting > 30 days — soft ceiling on asking rent; 2,114 units permitted in Jefferson County in 2024 (556 in 5+ unit buildings).
Forward outlook
- Local home prices are declining (-3.0%/yr); year-one equity from $345 of loan paydown is wiped out by about $1k of value loss. Plan a longer hold.
- Jefferson County population projected to shrink 4% by 2050 — rents likely to lag national; underwrite the cash flow, not the appreciation.
- At projected returns (-3.0% appreciation + 0.0% rent growth), your $14k cash investment doubles in ~5 years — after that, you're playing with house money.
Negotiation context
- It's been on market 181 days — a 12% lower offer ($44k) is reasonable based on typical stale-listing flexibility.
- 2 sale attempts with the ask held roughly flat each time — persistent listings suggest the price (not the market) is what's stuck; bring a comps-based counter.
Risks & watch-outs
- Watch-outs: built in 1950 — expect roof / HVAC / electrical / plumbing capex.
- Climate carrying-cost: major wind risk, 27% chance of damaging wind over 30y; extreme-heat days projected 7→19/yr by 2055 (HVAC capex compounding) — expect insurance premiums to compound above CPI over the hold.
Questions for the listing agent
- It's been on market 181 days. Have you received any prior offers? Is the seller open to a 12% concession, seller financing, or rate buy-down credit?
- Built in 1950 — when were the roof, HVAC, electrical panel, plumbing, and water heater last replaced?
- Why hasn't it sold? Are there any deal-killer items the seller is aware of (foundation, flood, title, zoning, code violations)?
- Is there a deadline driving the sale (1031 exchange, divorce, estate, relocation)? That informs how much negotiation room exists.
- Schools are F-rated, which usually means shorter tenancies and higher turnover. Who's the typical renter profile here, and what's been the actual vacancy rate?
- What's the average days-on-market for RENTAL listings here right now (not sales)? A rising rental-DOM trend means longer vacancies and softer asking-rent achievability than the comps imply.
- What's the recent tenant-quality profile in this submarket — average credit score on applications, eviction rate, late-payment / NSF rate, and stable-employment percentage? A property-management company in the area should have these aggregated.
- How much new for-sale + rental construction is in the pipeline within 1–3 miles? Heavy new supply typically softens prices + rents 12–24 months out; constrained supply supports both.
Investment metrics
- 1% rule
- 1.75% ✓
- Cap rate
- 14.50%
- Cash-on-cash
- 29.29%
- DSCR
- 2.30
- GRM
- 4.8
CMA / ARV
- ARV (on-the-fly)
- $24,864
- Comps found
- 1
Show comp detail 1 sale within ~0.75 mi
| Address | Dist | Beds/Ba | Sqft | Sold | Price | $/sf | Match |
|---|---|---|---|---|---|---|---|
| 1404 Rayfield Dr | 0.03mi | 2/1.0 | 672 (0%) | 11mo | $25,000 | $37 | 90 |
Match score weights: distance 35% · size 25% · config 20% · recency 20%. Top-matched comps best support the ARV.
Projected returns pro-forma
-3.0% appreciation · 0.0% rent growth · sell at horizon
- IRR
- 20.3%
- Equity multiple
- 1.79×
- Total profit
- $11,089
- Equity at exit
- $7,440
- IRR
- 26.4%
- Equity multiple
- 2.99×
- Total profit
- $27,783
- Equity at exit
- $4,314
Cash invested: $13,972 (down + closing). Projections, not guarantees.
Landlord ↔ Tenant lean methodology
- Overall (STATE)
- 90 Strongly Landlord-Friendly
- State Alabama
- 90 Strongly Landlord-Friendly · R+15
- County
- — inherits STATE
- City
- — inherits STATE
ZIP-level market 35228
- Home prices YoY
- -3.5%
- Rents YoY
- -1.5%
- Active inventory
- 87
- Price-to-rent
- 4.8×
Monthly cashflow live
- Estimated rent
- $875 high interval (Pro) →
- Mortgage (P&I)
- −$262
- Tax from tax record
- −$68 /mo · $815/yr
- Insurance
- −$21
- HOA
- −$0
- Vacancy / Maint / Mgmt
- −$184
- Net cashflow
- $341
Break-even live
UW: 25.0% down · 7.5% · 30yr · 1.5% tax · 5.0% vac · 8.0% maint · 8.0% mgmt
Financing live
Cash to close
- Down payment
- $12,475
- Closing costs
- $1,497
- Reserves months
- —
- Total cash needed
- —
Loan-product check · same deal, 3 products live
Conventional
25% down · 7.5% · 30yr
- Down + closing
- —
- Monthly P&I
- —
- Monthly cashflow
- —
- DSCR
- —
- Eligible?
- —
Personal DTI + credit; lowest rate.
DSCR
20% down · 8.5% · 30yr
- Down + closing
- —
- Monthly P&I
- —
- Monthly cashflow
- —
- DSCR
- —
- Eligible?
- —
No personal income docs; deal must DSCR.
Hard money
10% down · 12.0% · 12mo
- Down + closing
- —
- Monthly P&I
- —
- Monthly cashflow
- —
- DSCR
- —
- Eligible?
- —
Short-term bridge; refi at stabilization.
Rent comps 10 comps
| Address | Beds | Baths | Sqft | Rent | $/sqft | DOM | Units | Dist |
|---|---|---|---|---|---|---|---|---|
| 1317 Woodward Rd Birmingham, AL | 2.0 | 1.0 | 672 | $800 | $1.19 | 2d | 1 | 0.21mi |
| 1272 Meadow Ln Birmingham, AL | 2.0 | 1.0 | 744 | $800 | $1.08 | 43d | 1 | 0.86mi |
| 125 Jerry Coleman St Fairfield, AL | 2.0 | 1.0 | 715 | $725 | $1.01 | 43d | 1 | 1.08mi |
| 5712 Monte Sano Rd Birmingham, AL | 2.0 | 1.0 | 700 | $900 | $1.29 | 43d | 1 | 1.12mi |
| 5710 Monte Sano Dr Birmingham, AL | 2.0 | 1.0 | 700 | $950 | $1.36 | 43d | 1 | 1.12mi |
| 1045 57th St Birmingham, AL | 1.0 | 1.0 | 700 | $775 | $1.11 | 43d | 1 | 1.14mi |
| 5714 Court M Unit 5720 Birmingham, AL | 1.0 | 1.0 | 600 | $700 | $1.17 | 43d | 1 | 1.19mi |
| 2300 31st St SW Unit ENSLEY2316 A Birmingham, AL | 2.0 | 1.0 | 750 | $1,000 | $1.33 | 2d | 1 | 1.31mi |
| 1012 33rd St SW Birmingham, AL | 1.0–2.0 | 1.0–2.0 | 800 | $750 | $0.94 | 2d | 1 | 1.33mi |
| 412 Fairfax Dr Unit 432-13 Fairfield, AL | 1.0 | 1.0 | 555 | $775 | $1.40 | 10d | 1 | 1.46mi |
Listing history 5 events
-
2026-03-18status Pending
-
2026-03-18status Active
-
2026-03-17historical
-
2025-11-05historical Contingent
-
2025-09-16$49,900 Active
ⓘ Source: listings_history table (triggers on properties + properties_extension) + one-shot
backfill from property_details.listing_events for pre-trigger history.
Tax reassessment forecast AL · Resets to sale price
- Current annual tax
- $815 · $68/mo
- Projected year-2 tax
- $815 · $68/mo
- Expected delta
- $0/yr ($0/mo · 0.0%)
ⓘ Screening estimate from a state-policy table — verify with the county assessor before closing.
Climate risk First Street
- Flood 1/10 Low FEMA zone X (unshaded) · 0% chance over 30 yrs
- Wildfire 1/10 Low
- Heat 6/10 Major 7 d/yr ≥108°F today · 19 d/yr by 30 yrs out
- Wind 6/10 Major 27% chance of damaging wind over 30 yrs
- Air quality 4/10 Moderate 5 unhealthy d/yr today · 5 by 30 yrs out
Nearby sold comps map
Loading sold comps map…
Walkable amenities ~0.75 mi
Loading nearby amenities…
Taxation est. · year 1
- Rental income
- $10,503
- − Mortgage interest
- −$2,795
- − Property taxes
- −$815
- − Insurance
- −$250
- − Repairs & maintenance
- −$840
- − Management
- −$840
- − Depreciation
- −$1,452
- Taxable income
- $3,512
- Est. tax owed @ 24.0%
- −$843
- After-tax cash flow
- $3,250/yr
For passive investors: Depreciation is non-cash, so a rental often shows a tax loss while cash-flowing — sheltering income. Rental losses are passive: they offset passive income freely, and up to $25,000/yr can offset ordinary (W-2) income if you actively participate and your MAGI is under $100k (phasing out to $0 by $150k); unused losses carry forward. On sale, claimed depreciation is recaptured at up to 25%, and gains may owe capital-gains tax (a 1031 exchange can defer both). Figures are a year-1 estimate at your 24.0% rate — not tax advice; consult a CPA.
Schools (NCES district)
- District
- Midfield City
- NCES district ID
- 0102350
- Math proficiency
- 2% ▼ -18.00%
- Reading proficiency
- 14% ▼ -5.00%
- Median HH income
- $39,267
- Composite
- 6.89/100
- National rank
- #9978
- State rank
- #126 of 129 in AL
Livability — Midfield
- Score
- 64/100
- State rank
- #164
- US rank
- #14536
Category grades
Schools grade is shown separately in the Schools card above.
Census & demographics
- Census place
- Midfield, AL
- County
- Jefferson County · 527,445 people
- City population
- 10,216
- Metro
- Birmingham-Hoover, AL
- Population (ZIP)
- 10,216
- Household income
- $50,815
- Rent vs Own
- Severe rent burden
- 456.0
Population outlook (Jefferson County) Hauer SSP2
- Today (2025)
- 669,185 people
- By 2030
- 669,694 · +0.1%
- By 2040
- 661,388 · -1.2%
- By 2050
- 643,086 · -3.9%
- By 2075
- 577,267 · -13.7%
- By 2100
- 474,758 · -29.1%
Race, ethnicity, and origin ACS 2023
- Neighborhood character
- Predominantly Black (89%)
- Race & ethnicity
- Black 89% Hispanic / Latino 5% Two or more races 5% White 5%
- Foreign-born
- 2% · Canada
- Languages at home
- 95% English-only · Spanish 5%
Political lean MEDSL · Jefferson
- 2024 margin
- D (+10.4) · D 54.6% · R 44.2% · Other 1.2%
- 2008→2024 swing
- +5.4pp toward D · 2008: 5.1pp · 2024: 10.4pp
- All cycles
- 2024: D+10.4 2020: D+13.2 2016: D+7.2 2012: D+6.0 2008: D+5.1
Not yet ingested
- Civics
- —
Market trends
- HPI YoY
- ▼ -4.84%
- Current HPI
- 134.8633
- Rent YoY
- ▼ -1.47%
- Metro
- Birmingham-Hoover, AL
- State GDP YoY
- ▲ 2.94%
- F500 in state
- 4
Industry mix (Fortune 500 HQ in AL)
| Industry | F500 HQs | Revenue |
|---|---|---|
| Financial Services | 1 | $8B |
|
||
| Healthcare | 1 | $5B |
|
||
Price history
5 events — show timeline
- 2026-03-18 Pending — Greater Alabama MLS
- 2026-03-18 Relisted — Greater Alabama MLS
- 2026-03-17 Delisted — Greater Alabama MLS
- 2025-11-05 Contingent — Greater Alabama MLS
- 2025-09-16 Listed $49,900 Greater Alabama MLS
Property tax history
+3.5%/yrLatest (2025): $815 · +6.9% YoY. Source: county tax records.
Cash-flow waterfall
monthlySold comps — $/sqft
last 12 mo · ≤1 miLoading sold comps…