 Multi-family
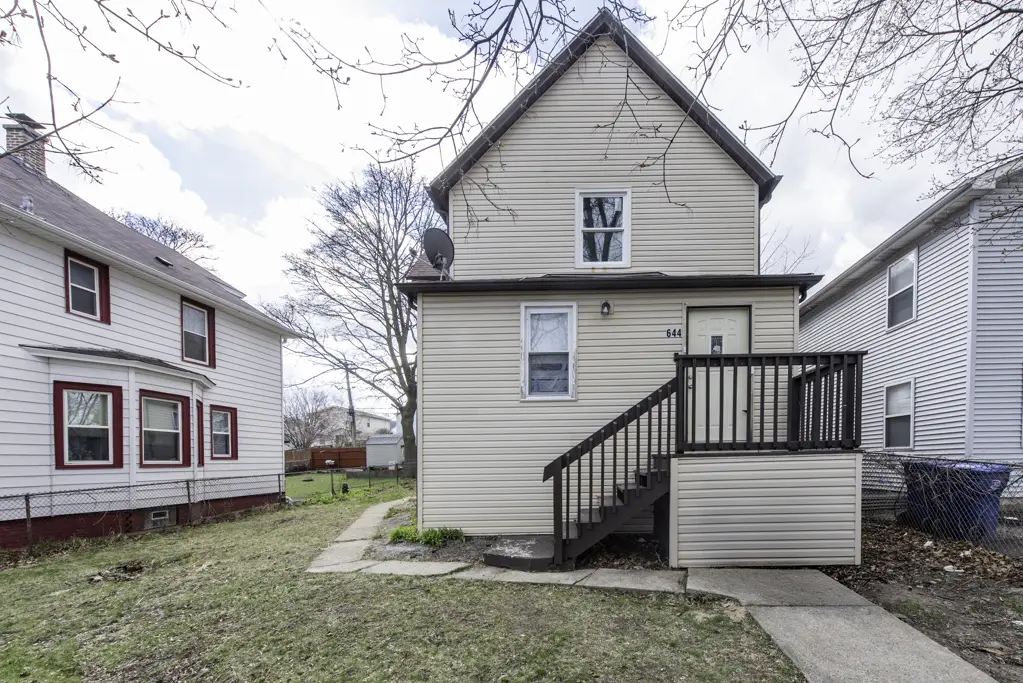
644 Lenox Ave · Waukegan, IL
Flood risk 1/10 · Minimal
- FEMA flood zone
- X (unshaded)
- Chance of flooding over 30 yrs
- 0.0%
- Est. flood insurance / yr
- $473 – $860
Fire risk 1/10 · Minimal
- Est. fire insurance / yr
- $804 – $1,492
Heat risk 2/10 · Minimal
- Hot days now (above 97°F)
- 7 days/yr
- Hot days in 30 yrs
- 14 days/yr
Wind risk 2/10 · Minimal
- Chance of severe wind over 30 yrs
- —
Air-quality risk 4/10 · Minor
- Unhealthy air days now
- 4 days/yr
- Unhealthy air days in 30 yrs
- 5 days/yr
Risk factors via First Street. Map © Google.
Why this score? — see what drove the C+ grade
The composite is a weighted blend of 9 inputs, each scored 0–100. Each bar is that input's sub-score; the figure is the points it added to the 100-point composite (weight × sub-score).
- Cash flow +26.8/30.0
- ARV discount +10.6/15.0
- DSCR +9.2/10.0
- 1% rule +7.8/10.0
- Livability +3.8/5.0
- Rent growth +3.3/5.0
- Condition / age +2.5/5.0
- Schools +0.8/10.0
- Appreciation +0.0/10.0
$250,000
🖨 Deal sheet 📄 Offer letter ✓ Due diligence
Multi-family units
County records classify this as Multi-Family (2-4 Unit). Listing-text estimate: 1 unit. estimate disagrees with records
Listing remarks MLS
This versatile 4-bedroom, 2-bathroom two-unit property at 644 Lenox Ave offers the perfect blend of move-in readiness and investment potential. The first-floor unit is meticulously maintained, boasting a functional layout, spacious bedrooms, and abundant storage throughout. While the upstairs unit requires some TLC, it presents a prime opportunity to build equity or maximize rental income. Complete with a full basement for additional storage or future finishing, and a private driveway with parking for four cars, this home is a standout choice for savvy investors or owner-occupants looking to invest in a solid Waukegan location.
Key facts
- 6,098 sq ft lot
- 4 parking spots
- Built 1920
Neighborhood map
What this means for you Summary
Snapshot
- This is a 4-bed/2.0-bath multifamily listed at $250k.
Deal economics
- At list price, monthly cash flow is $682 ($8k/yr) — positive.
- The deal already cash-flows at list — no discount required.
- Meets the 1% rule at list price ($3k rent vs $250k).
- Recommended offer: $235k (6.0% below list) — sets the bar for market timing.
- Cap rate 9.6% vs local median 4.6% in Waukegan — top-decile yield for the area; either an underpriced asset or a hidden risk that comps aren't pricing in. Stress-test before assuming the spread holds.
Location & tenants
- Location reads 75/100 on livability (#216 in IL, #4,074 nationally) — a middle-class / working-renter tenant base. Strengths: commute A+, cost of living A+, housing A+; Watch: employment C-, crime D, schools F.
- Waukegan CUSD 60 (suburban): math 7% / reading 10% proficiency, ranked #587 of 620 in IL (top 95%) — low school quality limits family demand, transient renter base, plan for 1-2y turnover; 66% free/reduced lunch — lower-income household profile, screen leases tightly.
- Market conditions: Rents rising (+3.2%/yr); 86 active listings in the ZIP; 3 comparable units currently listed for rent nearby; rentals leasing fast (median 2d on market — plan ~1-2 weeks tenant-placement turnaround); 948 units permitted in Lake County in 2024 (424 in 5+ unit buildings).
- At $3,200/mo this rent would consume 57% of the median local household income ($67k/yr) (locally 2742% of renters already pay >50% of income on rent) — very limited rent-growth headroom before tenants either downsize or default.
Forward outlook
- Local home prices are declining (-3.0%/yr); year-one equity from $2k of loan paydown is wiped out by about $8k of value loss. Plan a longer hold.
- Lake County population projected to shrink 8% by 2050 — rents likely to lag national; underwrite the cash flow, not the appreciation.
- At projected returns (-3.0% appreciation + 3.2% rent growth), your $70k cash investment doubles in ~10 years — after that, you're playing with house money.
Negotiation context
- It's been on market 69 days — a 6% lower offer ($235k) is reasonable based on typical stale-listing flexibility.
- 5 sale attempts since 19y ago with the ask held roughly flat each time — persistent listings suggest the price (not the market) is what's stuck; bring a comps-based counter.
Risks & watch-outs
- Watch-outs: built in 1920 — expect roof / HVAC / electrical / plumbing capex.
Questions for the listing agent
- It's been on market 69 days. Have you received any prior offers? Is the seller open to a 6% concession, seller financing, or rate buy-down credit?
- Built in 1920 — when were the roof, HVAC, electrical panel, plumbing, and water heater last replaced?
- Why hasn't it sold? Are there any deal-killer items the seller is aware of (foundation, flood, title, zoning, code violations)?
- Is there a deadline driving the sale (1031 exchange, divorce, estate, relocation)? That informs how much negotiation room exists.
- Schools are F-rated, which usually means shorter tenancies and higher turnover. Who's the typical renter profile here, and what's been the actual vacancy rate?
- Crime grade is D in this area — have there been break-ins, vandalism, or insurance claims at this property in the last 3 years? What carrier currently insures it and at what premium?
- What's the average days-on-market for RENTAL listings here right now (not sales)? A rising rental-DOM trend means longer vacancies and softer asking-rent achievability than the comps imply.
- What's the recent tenant-quality profile in this submarket — average credit score on applications, eviction rate, late-payment / NSF rate, and stable-employment percentage? A property-management company in the area should have these aggregated.
- How much new apartment / multifamily construction is in the pipeline within 1–3 miles? Heavy new supply (>2% of stock underway) typically softens rents 12–24 months out; light construction supports rent growth.
Investment metrics
- 1% rule
- 1.28% ✓
- Cap rate
- 9.57%
- Cash-on-cash
- 11.70%
- DSCR
- 1.52
- GRM
- 6.5
CMA / ARV
- ARV (median comp)
- $268,664
- List price
- $250,000
- Delta
- -6.95%
- Verdict
- FAIR
- Comps
- 3 within 1.0 mi
Projected returns pro-forma
-3.0% appreciation · 3.24% rent growth · sell at horizon
- IRR
- 1.4%
- Equity multiple
- 1.05×
- Total profit
- $3,849
- Equity at exit
- $37,276
- IRR
- 11.3%
- Equity multiple
- 1.90×
- Total profit
- $63,004
- Equity at exit
- $21,615
Cash invested: $70,000 (down + closing). Projections, not guarantees.
Landlord ↔ Tenant lean methodology
- Overall (STATE)
- 43 Moderately Tenant-Leaning
- State Illinois
- 43 Moderately Tenant-Leaning · D+7
- County
- — inherits STATE
- City
- — inherits STATE
ZIP-level market 60085
- Rents YoY
- 3.2%
- Active inventory
- 86
- Price-to-rent
- 13.0×
Monthly cashflow live
- Estimated rent
- $3,200 medium interval (Pro) →
- Mortgage (P&I)
- −$1,311
- Tax from tax record
- −$430 /mo · $5,164/yr
- Insurance
- −$104
- HOA
- −$0
- Vacancy / Maint / Mgmt
- −$672
- Net cashflow
- $682
Break-even live
2-unit breakdown (identical units grouped — click to expand)
| Units | Beds | Baths | Est. rent |
|---|---|---|---|
| 2× units | 2 | 1 | $3,200 |
| #1 | 2 | 1 | $1,600 |
| #2 | 2 | 1 | $1,600 |
| Total (2 units) | $3,200 | ||
UW: 25.0% down · 7.5% · 30yr · 1.5% tax · 5.0% vac · 8.0% maint · 8.0% mgmt
Financing live
Cash to close
- Down payment
- $62,500
- Closing costs
- $7,500
- Reserves months
- —
- Total cash needed
- —
Loan-product check · same deal, 3 products live
Conventional
25% down · 7.5% · 30yr
- Down + closing
- —
- Monthly P&I
- —
- Monthly cashflow
- —
- DSCR
- —
- Eligible?
- —
Personal DTI + credit; lowest rate.
DSCR
20% down · 8.5% · 30yr
- Down + closing
- —
- Monthly P&I
- —
- Monthly cashflow
- —
- DSCR
- —
- Eligible?
- —
No personal income docs; deal must DSCR.
Hard money
10% down · 12.0% · 12mo
- Down + closing
- —
- Monthly P&I
- —
- Monthly cashflow
- —
- DSCR
- —
- Eligible?
- —
Short-term bridge; refi at stabilization.
Rent comps 3 comps
| Address | Beds | Baths | Sqft | Rent | $/sqft | DOM | Units | Dist |
|---|---|---|---|---|---|---|---|---|
| 903 S McAlister Ave Waukegan, IL | 4.0 | 2.0 | 2275 | $2,560 | $1.13 | 1d | 1 | 0.36mi |
| 1701 Victoria Ave North Chicago, IL | 3.0 | 2.0 | 2345 | $1,950 | $0.83 | 43d | 1 | 1.41mi |
| 2404 Pearsall Pkwy Waukegan, IL | 4.0 | 2.0 | 2000 | $4,300 | $2.15 | 1d | 1 | 1.49mi |
Listing history 44 events
-
2026-06-18days on market $250,000 Active 69 DOM
-
2026-06-17days on market $250,000 Active 68 DOM
-
2026-06-16days on market $250,000 Active 67 DOM
-
2026-06-15days on market $250,000 Active 66 DOM
-
2026-06-13days on market $250,000 Active 64 DOM
-
2026-06-09days on market $250,000 Active 60 DOM
-
2026-06-08days on market $250,000 Active 59 DOM
-
2026-06-07days on market $250,000 Active 58 DOM
-
2026-06-04days on market $250,000 Active 55 DOM
-
2026-06-03days on market $250,000 Active 54 DOM
-
2026-06-02statusdays on market $250,000 Active 53 DOM
-
2026-06-01days on market $250,000 Contingent - No Showings 52 DOM
-
2026-05-31days on market $250,000 Contingent - No Showings 51 DOM
-
2026-05-06historical Contingent - No Showings 635-char remark
Show marketing remark (635 chars)
This versatile 4-bedroom, 2-bathroom two-unit property at 644 Lenox Ave offers the perfect blend of move-in readiness and investment potential. The first-floor unit is meticulously maintained, boasting a functional layout, spacious bedrooms, and abundant storage throughout. While the upstairs unit requires some TLC, it presents a prime opportunity to build equity or maximize rental income. Complete with a full basement for additional storage or future finishing, and a private driveway with parking for four cars, this home is a standout choice for savvy investors or owner-occupants looking to invest in a solid Waukegan location.
-
2026-04-09historical 635-char remark
Show marketing remark (635 chars)
This versatile 4-bedroom, 2-bathroom two-unit property at 644 Lenox Ave offers the perfect blend of move-in readiness and investment potential. The first-floor unit is meticulously maintained, boasting a functional layout, spacious bedrooms, and abundant storage throughout. While the upstairs unit requires some TLC, it presents a prime opportunity to build equity or maximize rental income. Complete with a full basement for additional storage or future finishing, and a private driveway with parking for four cars, this home is a standout choice for savvy investors or owner-occupants looking to invest in a solid Waukegan location.
-
2023-04-11soldstatus $244,000
-
2023-03-21soldstatus $244,000 Closed 296-char remark
Show marketing remark (296 chars)
Just like new! Newly Remodeled Two units with two large bedrooms in each unit. Freshly painted throughout. Updated kitchens and baths, New Luxury Vinyl Plank throughout with Eat-in kitchens! Shared Laundry and separate storage spaces in the basement. Perfect for the savvy investor! Tenant ready!
-
2023-02-17status Pending 296-char remark
Show marketing remark (296 chars)
Just like new! Newly Remodeled Two units with two large bedrooms in each unit. Freshly painted throughout. Updated kitchens and baths, New Luxury Vinyl Plank throughout with Eat-in kitchens! Shared Laundry and separate storage spaces in the basement. Perfect for the savvy investor! Tenant ready!
-
2023-02-09historical Contingent - Continue to Show 296-char remark
Show marketing remark (296 chars)
Just like new! Newly Remodeled Two units with two large bedrooms in each unit. Freshly painted throughout. Updated kitchens and baths, New Luxury Vinyl Plank throughout with Eat-in kitchens! Shared Laundry and separate storage spaces in the basement. Perfect for the savvy investor! Tenant ready!
-
2023-01-31price $245,000 296-char remark
Show marketing remark (296 chars)
Just like new! Newly Remodeled Two units with two large bedrooms in each unit. Freshly painted throughout. Updated kitchens and baths, New Luxury Vinyl Plank throughout with Eat-in kitchens! Shared Laundry and separate storage spaces in the basement. Perfect for the savvy investor! Tenant ready!
-
2022-12-11$255,000 Active 296-char remark
Show marketing remark (296 chars)
Just like new! Newly Remodeled Two units with two large bedrooms in each unit. Freshly painted throughout. Updated kitchens and baths, New Luxury Vinyl Plank throughout with Eat-in kitchens! Shared Laundry and separate storage spaces in the basement. Perfect for the savvy investor! Tenant ready!
-
2010-05-12soldstatus $51,450 Closed Sale
-
2010-04-21historical
-
2010-04-13historical Contingent
-
2010-02-09price $59,900 Price Change
-
2010-01-06price $77,900 Price Change
-
2009-12-04price $82,900 Price Change
-
2009-09-30$99,900 New
-
2009-06-24price
-
2009-04-20
-
2009-02-01historical
-
2008-11-07price
-
2008-08-06
-
2007-06-25soldstatus $163,000
-
2007-06-05soldstatus $163,000
-
2007-04-30historical
-
2007-04-09$164,900
-
2002-09-05soldstatus $130,000
-
2000-03-01soldstatus $113,500
-
1999-04-15soldstatus $28,000
-
1994-12-13soldstatus $72,000
-
1990-05-01soldstatus $62,000
-
1984-04-01soldstatus $49,900
-
1983-10-01soldstatus $13,000
ⓘ Source: listings_history table (triggers on properties + properties_extension) + one-shot
backfill from property_details.listing_events for pre-trigger history.
Tax reassessment forecast IL · Partial reset (capped growth)
- Current annual tax
- $5,164 · $430/mo
- Projected year-2 tax
- $5,420 · $452/mo
- Expected delta
- +$255/yr (+$21/mo · 4.9%)
ⓘ Screening estimate from a state-policy table — verify with the county assessor before closing.
Climate risk First Street
- Flood 1/10 Low FEMA zone X (unshaded) · 0% chance over 30 yrs
- Wildfire 1/10 Low
- Heat 2/10 Low 7 d/yr ≥97°F today · 14 d/yr by 30 yrs out
- Wind 2/10 Low
- Air quality 4/10 Moderate 4 unhealthy d/yr today · 5 by 30 yrs out
Nearby sold comps map
Loading sold comps map…
Walkable amenities ~0.75 mi
Loading nearby amenities…
Taxation est. · year 1
- Rental income
- $38,400
- − Mortgage interest
- −$14,004
- − Property taxes
- −$5,164
- − Insurance
- −$1,250
- − Repairs & maintenance
- −$3,072
- − Management
- −$3,072
- − Depreciation
- −$7,273
- Taxable income
- $4,565
- Est. tax owed @ 24.0%
- −$1,096
- After-tax cash flow
- $7,094/yr
For passive investors: Depreciation is non-cash, so a rental often shows a tax loss while cash-flowing — sheltering income. Rental losses are passive: they offset passive income freely, and up to $25,000/yr can offset ordinary (W-2) income if you actively participate and your MAGI is under $100k (phasing out to $0 by $150k); unused losses carry forward. On sale, claimed depreciation is recaptured at up to 25%, and gains may owe capital-gains tax (a 1031 exchange can defer both). Figures are a year-1 estimate at your 24.0% rate — not tax advice; consult a CPA.
Schools (NCES district)
- District
- Waukegan CUSD 60
- NCES district ID
- 1741250
- Math proficiency
- 7% ▼ -8.00%
- Reading proficiency
- 10% ▼ -8.00%
- Median HH income
- $43,248
- Composite
- 7.73/100
- National rank
- #9939
- State rank
- #587 of 620 in IL
Livability — Waukegan
- Score
- 75/100
- State rank
- #216
- US rank
- #4074
Category grades
Schools grade is shown separately in the Schools card above.
Census & demographics
- Census place
- Waukegan, IL
- County
- Lake County · 591,991 people
- City population
- 99,634
- Metro
- Chicago-Naperville-Elgin, IL-IN-WI
- Population (ZIP)
- 72,341
- Household income
- $66,793
- Rent vs Own
- Severe rent burden
- 2742.0
Population outlook (Lake County) Hauer SSP2
- Today (2025)
- 700,217 people
- By 2030
- 693,290 · -1.0%
- By 2040
- 673,588 · -3.8%
- By 2050
- 643,556 · -8.1%
- By 2075
- 562,792 · -19.6%
- By 2100
- 457,715 · -34.6%
Race, ethnicity, and origin ACS 2023
- Neighborhood character
- Diverse neighborhood (Simpson 0.57)
- Race & ethnicity
- Hispanic / Latino 62% Two or more races 24% Black 14% White 14% Asian 6% Native American 2%
- Hispanic origin (detail)
- Mexican 51% Puerto Rican 3%
- Common ancestry
- Romanian 1% British 1% Portuguese 1%
- Foreign-born
- 34% · Canada, Jamaica
- Languages at home
- 39% English-only · Spanish 54% Tagalog/Filipino 2% Other Asian/Pacific 1%
Political lean MEDSL · Lake
- 2024 margin
- Strong D (+20.8) · D 59.7% · R 38.9% · Other 1.4%
- 2008→2024 swing
- +1.1pp toward D · 2008: 19.6pp · 2024: 20.8pp
- All cycles
- 2024: D+20.8 2020: D+24.1 2016: D+20.3 2012: D+8.1 2008: D+19.6
Not yet ingested
- Civics
- —
Market trends
- HPI YoY
- ▼ -114.04%
- Current HPI
- 203.6304
- Rent YoY
- ▲ 3.24%
- Metro
- Chicago-Naperville-Elgin, IL-IN-WI
- State GDP YoY
- ▲ 1.59%
- F500 in state
- 60
Industry mix (Fortune 500 HQ in IL)
| Industry | F500 HQs | Revenue |
|---|---|---|
| Insurance | 4 | $201B |
|
||
| Consumer Goods | 4 | $87B |
|
||
| Industrial Machinery | 3 | $64B |
|
||
| Healthcare | 2 | $55B |
|
||
| Retail / Pharmacy | 1 | $148B |
|
||
| Agriculture / Food | 1 | $86B |
|
||
Price history
+1776.9% since first listed31 events — show timeline
- 2026-05-06 Contingent — MRED as Distributed by MLS Grid
- 2026-04-09 Listing Removed — MRED as Distributed by MLS Grid
- 2023-04-11 Sold (Public Records) $244,000 Public Records
- 2023-03-21 Sold (MLS) $244,000 MRED as Distributed by MLS Grid
- 2023-02-17 Pending — MRED as Distributed by MLS Grid
- 2023-02-09 Contingent — MRED as Distributed by MLS Grid
- 2023-01-31 Price Changed $245,000 MRED as Distributed by MLS Grid
- 2022-12-11 Listed $255,000 MRED as Distributed by MLS Grid
- 2010-05-12 Sold (MLS) $51,450 MRED as Distributed by MLS Grid
- 2010-04-21 Listing Removed — MRED as Distributed by MLS Grid
- 2010-04-13 Contingent — MRED as Distributed by MLS Grid
- 2010-02-09 Price Changed $59,900 MRED as Distributed by MLS Grid
- 2010-01-06 Price Changed $77,900 MRED as Distributed by MLS Grid
- 2009-12-04 Price Changed $82,900 MRED as Distributed by MLS Grid
- 2009-09-30 Listed $99,900 MRED as Distributed by MLS Grid
- 2009-06-24 Price Changed — MRED as Distributed by MLS Grid
- 2009-04-20 Listed — MRED as Distributed by MLS Grid
- 2009-02-01 Listing Removed — MRED as Distributed by MLS Grid
- 2008-11-07 Price Changed — MRED as Distributed by MLS Grid
- 2008-08-06 Listed — MRED as Distributed by MLS Grid
- 2007-06-25 Sold (Public Records) $163,000 Public Records
- 2007-06-05 Sold (MLS) $163,000 MRED as Distributed by MLS Grid
- 2007-04-30 Listing Removed — MRED as Distributed by MLS Grid
- 2007-04-09 Listed $164,900 MRED as Distributed by MLS Grid
- 2002-09-05 Sold (Public Records) $130,000 Public Records
- 2000-03-01 Sold (Public Records) $113,500 Public Records
- 1999-04-15 Sold (Public Records) $28,000 Public Records
- 1994-12-13 Sold (Public Records) $72,000 Public Records
- 1990-05-01 Sold (Public Records) $62,000 Public Records
- 1984-04-01 Sold (Public Records) $49,900 Public Records
- 1983-10-01 Sold (Public Records) $13,000 Public Records
Property tax history
+1.5%/yrLatest (2024): $5,164 · +2.1% YoY. Source: county tax records.
Cash-flow waterfall
monthlySold comps — $/sqft
last 12 mo · ≤1 miLoading sold comps…