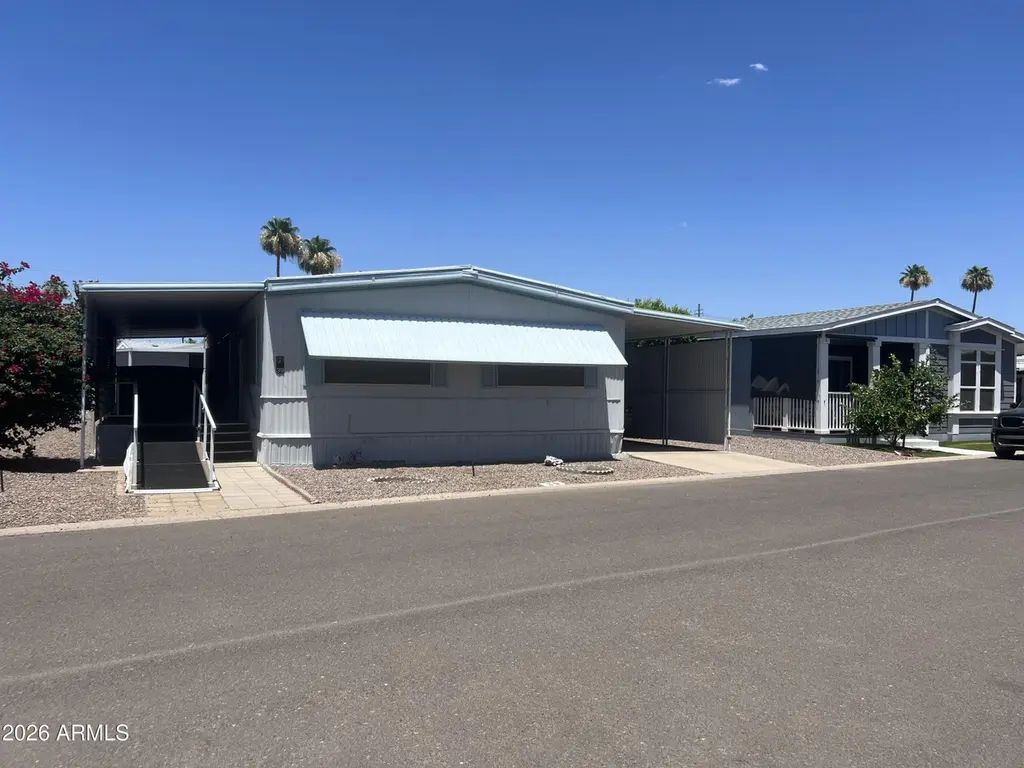
2727 E University Dr #39 · Tempe, AZ
Flood risk 1/10 · Minimal
- FEMA flood zone
- X (shaded)
- Chance of flooding over 30 yrs
- 0.0%
- Est. flood insurance / yr
- $507 – $1,088
Fire risk 1/10 · Minimal
- Est. fire insurance / yr
- $610 – $1,132
Heat risk 9/10 · Severe
- Hot days now (above 112°F)
- 7 days/yr
- Hot days in 30 yrs
- 18 days/yr
Wind risk 1/10 · Minimal
- Chance of severe wind over 30 yrs
- —
Air-quality risk 2/10 · Minimal
- Unhealthy air days now
- 1 days/yr
- Unhealthy air days in 30 yrs
- 1 days/yr
Risk factors via First Street. Map © Google.
Why this score? — see what drove the D+ grade
The composite is a weighted blend of 9 inputs, each scored 0–100. Each bar is that input's sub-score; the figure is the points it added to the 100-point composite (weight × sub-score).
- Cash flow +15.0/30.0
- ARV discount +7.5/15.0
- 1% rule +5.0/10.0
- DSCR +5.0/10.0
- Livability +3.9/5.0
- Rent growth +2.9/5.0
- Appreciation +2.7/10.0
- Condition / age +2.5/5.0
- Schools +2.0/10.0
$19,900
🖨 Deal sheet 📄 Offer letter ✓ Due diligence
Listing remarks
REDUCED FOR QUICK CASH SALE * * * BRING ALL REASONABLE OFFERS * * * LARGER 1975 WOODCREST 2 BEDROOM 2 BATHROOM DOUBLEWIDE, 1344 SQ FT, NEWER AC/HOT WATER HEATER/ROOFING SEALED AND COATED ALL WITHIN 5 YEARS AGO APPROX, WAHER/DRYER INSIDE AND INCLUDED, RAMP TO DECK WITH SHED, TANDEM 2 CAR COVERED PARKING, PRIVACY PANELS ON BOTH SIDES OF HOME, N/S FACING, NEWER REFRIGERATOR, enjoy the recently renovated pool, playing shuffleboard, or bocce ball. Bring your dog for a walk around the neighborhood or the dog park. Sage Point is a sunny 55+ adult community with an active lifestyle centered around exploring the area, tucked away from the urban bustle of Phoenix but still conveniently situated r
Key facts
- Ramp to deck
- Newer refrigerator
- Newer roofing
Tags
Property features AI
Finance
- Other: Property sold/managed on leased land
- HOA & community: Land lease: $1,085 per month; No association fees included; Community pool; Community spa (heated); Community media room; Biking/walking path; Near light rail stop; Near bus stop
Exterior
- Parking: 2 covered parking spaces; 2 carport spaces
- Security: Gated community
- Utilities: City water; Public sewer; 220 volts in kitchen (electric)
- Home design: Manufactured / mobile home; Leasehold ownership; City and city lights views
- Construction: Metal siding; Wood frame construction; Painted exterior
- Exterior features: Private street(s); Gravel/stone front and back; Reflective roof coating; Asphalt road surface; Private maintained road
Interior
- Kitchen: 220 volts in kitchen; Laminate counters; Refrigerator; Dishwasher
- Bedrooms: Up to 3 bedrooms
- Flooring: Vinyl
- Bathrooms: 2 full bathrooms
- Heating & cooling: Heat pump heating; Natural gas heating; Heat pump cooling; Central air; Ceiling fans; Programmable thermostat
- Interior features: Breakfast bar; Kitchen island; Pantry; High-speed internet; No interior steps; Full bath in primary bedroom; Accessible approach with ramp; Multiple entries/exits; Storage
- Laundry & utility: Laundry inside
Neighborhood map
What this means for you Summary
Snapshot
- This is a 2-bed/2.0-bath manufactured listed at $20k.
Deal economics
- At list price, monthly cash flow is $1k ($16k/yr) — positive.
- The deal already cash-flows at list — no discount required.
- Meets the 1% rule at list price ($2k rent vs $20k).
- Recommended offer: $20k (1.5% below list) — sets the bar for market timing.
- Cap rate 86.0% vs local median 3.4% in Tempe — top-decile yield for the area; either an underpriced asset or a hidden risk that comps aren't pricing in. Stress-test before assuming the spread holds.
Location & tenants
- Location reads 78/100 on livability (#10 in AZ, #2,527 nationally) — a middle-class / working-renter tenant base. Strengths: amenities A+, commute A+, housing A+; Watch: schools C-, cost of living C-, health & safety D.
- Tempe School District (4258) (urban): math 17% / reading 29% proficiency, ranked #170 of 249 in AZ (top 68%) — low school quality limits family demand, transient renter base, plan for 1-2y turnover.
- Market conditions: Rents rising (+1.7%/yr); 105 active listings in the ZIP; 40 comparable units currently listed for rent nearby; rentals leasing fast (median 1d on market — plan ~1-2 weeks tenant-placement turnaround); 36,011 units permitted in Maricopa County in 2024 (12,801 in 5+ unit buildings).
Forward outlook
- Local home prices are declining (-3.0%/yr); year-one equity from $138 of loan paydown is wiped out by about $597 of value loss. Plan a longer hold.
- Maricopa County population projected at +38% by 2050 — long-run rental-demand tailwind backs the buy-and-hold thesis.
- At projected returns (-3.0% appreciation + 1.7% rent growth), your $6k cash investment doubles in ~1 year — after that, you're playing with house money.
Negotiation context
- It's been on market 19 days — a 2% lower offer ($20k) is reasonable based on typical stale-listing flexibility.
Risks & watch-outs
- Climate carrying-cost: extreme-heat days projected 7→18/yr by 2055 (HVAC capex compounding) — expect insurance premiums to compound above CPI over the hold.
Questions for the listing agent
- Built in 1975 — when were the roof, HVAC, electrical panel, plumbing, and water heater last replaced?
- Is there a deadline driving the sale (1031 exchange, divorce, estate, relocation)? That informs how much negotiation room exists.
- Crime grade is F in this area — have there been break-ins, vandalism, or insurance claims at this property in the last 3 years? What carrier currently insures it and at what premium?
- The area grade is low — what's the realistic commute time and amenity access for the typical tenant pool here? Any planned neighborhood developments (good or bad) we should know about?
- What's the average days-on-market for RENTAL listings here right now (not sales)? A rising rental-DOM trend means longer vacancies and softer asking-rent achievability than the comps imply.
- What's the recent tenant-quality profile in this submarket — average credit score on applications, eviction rate, late-payment / NSF rate, and stable-employment percentage? A property-management company in the area should have these aggregated.
- How much new for-sale + rental construction is in the pipeline within 1–3 miles? Heavy new supply typically softens prices + rents 12–24 months out; constrained supply supports both.
Investment metrics
- 1% rule
- 9.28% ✓
- Cap rate
- 86.02%
- Cash-on-cash
- 284.74%
- DSCR
- 13.67
- GRM
- 0.9
CMA / ARV
- ARV (on-the-fly)
- $127,680
- Comps found
- 12
Show comp detail 12 sales within ~0.75 mi
| Address | Dist | Beds/Ba | Sqft | Sold | Price | $/sf | Match |
|---|---|---|---|---|---|---|---|
| 2727 E University Dr #80 | 0.12mi | 3/2.0 (+1) | 1,344 (0%) | 9mo | $20,000 | $15 | 82 |
| 2727 E University Dr #146 | 0.00mi | 3/2.0 (+1) | 1,248 (-7%) | 2mo | $162,500 | $130 | 81 |
| 2727 E University Dr #41 | 0.00mi | 3/2.0 (+1) | 1,248 (-7%) | 8mo | $67,000 | $54 | 77 |
| 2727 E University Dr #99 | 0.00mi | 3/2.0 (+1) | 1,456 (+8%) | 6mo | $172,000 | $118 | 76 |
| 2727 E University Dr #110 | 0.00mi | 3/2.0 (+1) | 1,456 (+8%) | 8mo | $138,000 | $95 | 74 |
| 2727 E University Dr #28 | 0.12mi | 2/2.0 | 1,426 (+6%) | 14mo | $165,000 | $116 | 72 |
| 2727 E Unversity Dr #106 | 0.13mi | 3/2.0 (+1) | 1,456 (+8%) | 4mo | $140,000 | $96 | 72 |
| 2727 E University Dr #40 | 0.12mi | 2/2.0 | 1,456 (+8%) | 14mo | $192,050 | $132 | 68 |
| 2340 E University Dr #52 | 0.51mi | 3/2.0 (+1) | 1,344 (0%) | 7mo | $80,000 | $60 | 65 |
| 2727 E University Dr #78 | 0.12mi | 3/2.0 (+1) | 1,540 (+15%) | 3mo | $136,130 | $88 | 63 |
| 2340 E University Dr #37 | 0.48mi | 3/2.0 (+1) | 1,325 (-1%) | 21mo | $99,000 | $75 | 53 |
| 2340 E University Dr #126 | 0.60mi | 2/2.0 | 1,152 (-14%) | 12mo | $49,900 | $43 | 38 |
Match score weights: distance 35% · size 25% · config 20% · recency 20%. Top-matched comps best support the ARV.
Projected returns pro-forma
-3.0% appreciation · 1.66% rent growth · sell at horizon
- IRR
- —
- Equity multiple
- 15.10×
- Total profit
- $78,553
- Equity at exit
- $2,967
- IRR
- —
- Equity multiple
- 30.99×
- Total profit
- $167,127
- Equity at exit
- $1,721
Cash invested: $5,572 (down + closing). Projections, not guarantees.
Landlord ↔ Tenant lean methodology
- Overall (STATE)
- 87 Strongly Landlord-Friendly
- State Arizona
- 87 Strongly Landlord-Friendly · R+3
- County
- — inherits STATE
- City
- — inherits STATE
ZIP-level market 85288
- Home prices YoY
- -0.7%
- Rents YoY
- 1.7%
- Active inventory
- 105
- Price-to-rent
- 0.9×
Monthly cashflow live
- Estimated rent
- $1,848 high interval (Pro) →
- Mortgage (P&I)
- −$104
- Tax est. 1.5%
- −$25 /mo · $298/yr
- Insurance
- −$8
- HOA
- −$0
- Vacancy / Maint / Mgmt
- −$388
- Net cashflow
- $1,322
Break-even live
UW: 25.0% down · 7.5% · 30yr · 1.5% tax · 5.0% vac · 8.0% maint · 8.0% mgmt
Financing live
Cash to close
- Down payment
- $4,975
- Closing costs
- $597
- Reserves months
- —
- Total cash needed
- —
Loan-product check · same deal, 3 products live
Conventional
25% down · 7.5% · 30yr
- Down + closing
- —
- Monthly P&I
- —
- Monthly cashflow
- —
- DSCR
- —
- Eligible?
- —
Personal DTI + credit; lowest rate.
DSCR
20% down · 8.5% · 30yr
- Down + closing
- —
- Monthly P&I
- —
- Monthly cashflow
- —
- DSCR
- —
- Eligible?
- —
No personal income docs; deal must DSCR.
Hard money
10% down · 12.0% · 12mo
- Down + closing
- —
- Monthly P&I
- —
- Monthly cashflow
- —
- DSCR
- —
- Eligible?
- —
Short-term bridge; refi at stabilization.
Rent comps 40 comps
| Address | Beds | Baths | Sqft | Rent | $/sqft | DOM | Units | Dist |
|---|---|---|---|---|---|---|---|---|
| 2693 E Silk Oak Dr Unit 2693 Tempe, AZ | 2.0 | 1.0 | 951 | $1,400 | $1.47 | 21d | 1 | 0.11mi |
| 2605 E Lemon St Tempe, AZ | 3.0 | 2.0 | 1176 | $1,999 | $1.70 | 1d | 1 | 0.26mi |
| 540 N May #3106 Mesa, AZ | 3.0 | 2.0 | 1306 | $1,540 | $1.18 | 1d | 1 | 0.35mi |
| 540 N May #3122 Mesa, AZ | 3.0 | 2.0 | 1306 | $1,700 | $1.30 | 1d | 1 | 0.37mi |
| 555 N May Mesa, AZ | 2.0 | 2.0 | 963 | $1,695 | $1.76 | 17d | 1 | 0.38mi |
| 540 N May #3119 Mesa, AZ | 2.0 | 2.0 | 1029 | $1,395 | $1.36 | 3d | 1 | 0.39mi |
| 555 N May #23 Mesa, AZ | 2.0 | 2.0 | 963 | $1,752 | $1.82 | 16d | 1 | 0.41mi |
| 546 S Allred Dr Tempe, AZ | 2.0 | 2.0 | 987 | $1,550 | $1.57 | 16d | 1 | 0.42mi |
| 540 N May #2145 Mesa, AZ | 2.0 | 2.0 | 988 | $1,495 | $1.51 | 1d | 1 | 0.44mi |
| 2450 E 5th Pl Tempe, AZ | 2.0 | 2.0 | 987 | $1,650 | $1.67 | 3d | 1 | 0.44mi |
| 633 N May #31 Mesa, AZ | 3.0 | 2.0 | 936 | $1,600 | $1.71 | 21d | 1 | 0.52mi |
| 711 N Evergreen Rd Mesa, AZ | 1.0–2.0 | 1.0–2.0 | 1017 | $2,038 | $2.00 | 1d | 11 | 0.55mi |
| 712 N Santa Barbara #1 Mesa, AZ | 3.0 | 2.0 | 1363 | $2,145 | $1.57 | 1d | 1 | 0.58mi |
| 2320 E Apache Blvd Tempe, AZ | 1.0–3.0 | 1.0–2.0 | 826 | $1,185 | $1.43 | 1d | 18 | 0.61mi |
| 2060 W Devonshire Cir Mesa, AZ | 3.0 | 2.0 | 1791 | $2,600 | $1.45 | 1d | 1 | 0.62mi |
| 2401 E Rio Salado Pkwy Tempe, AZ | 2.0–3.0 | 2.0–3.0 | 1234 | $1,895 | $1.54 | 24d | 6 | 0.69mi |
| 2401 E Rio Salado Pkwy Tempe, AZ | 2.0–4.0 | 2.0–3.5 | 1470 | $1,800 | $1.22 | 1d | 4 | 0.69mi |
| 2131 E 10th St #3 Tempe, AZ | 3.0 | 2.0 | 1036 | $1,950 | $1.88 | 2d | 1 | 0.75mi |
| 2325 E Rio Salado Pkwy Tempe, AZ | 2.0 | 1.0–2.0 | 901 | $2,072 | $2.30 | 1d | 12 | 0.77mi |
| 2123 E Kirkland Ln #2 Tempe, AZ | 3.0 | 2.0 | 1036 | $3,200 | $3.09 | 2d | 1 | 0.79mi |
| 2141 E University Dr Tempe, AZ | 1.0–3.0 | 1.0 | 825 | $1,440 | $1.74 | 1d | 6 | 0.85mi |
| 2157 E Apache Blvd Tempe, AZ | 2.0 | 1.0–2.5 | 899 | $2,225 | $2.47 | 1d | 35 | 0.88mi |
| 2125 E Apache Blvd Tempe, AZ | 2.0 | 1.0–2.0 | 818 | $2,017 | $2.47 | 1d | 21 | 0.97mi |
| 850 S River Dr Rm 2 Tempe, AZ | 3.0 | 3.0 | 1130 | $800 | $0.71 | 1d | 1 | 0.98mi |
| 850 S River Dr #2085 Tempe, AZ | 2.0 | 2.0 | 1130 | $1,599 | $1.42 | 1d | 1 | 0.98mi |
| 2063 E Lemon St Unit 2004 Tempe, AZ | 2.0 | 2.0 | 1000 | $1,695 | $1.70 | 1d | 1 | 1.04mi |
| 2063 E Lemon St Unit 3004 Tempe, AZ | 2.0 | 2.0 | 1000 | $1,795 | $1.79 | 1d | 1 | 1.04mi |
| 1750 S Price Rd Tempe, AZ | 2.0 | 1.0–2.0 | 732 | $1,399 | $1.91 | 1d | 12 | 1.06mi |
| 2027 E University Dr #113 Tempe, AZ | 3.0 | 3.0 | 1510 | $2,250 | $1.49 | 1d | 1 | 1.10mi |
| 901 S Smith Rd #1047 Tempe, AZ | 3.0 | 3.5 | 1839 | $2,895 | $1.57 | 1d | 1 | 1.13mi |
| 901 S Smith Rd #1047 Tempe, AZ | 3.0 | 3.5 | 1839 | $2,895 | $1.57 | 18d | 1 | 1.13mi |
| 98 S River Dr Tempe, AZ | 3.0 | 1.0–3.0 | 1090 | $3,524 | $3.23 | 1d | 25 | 1.15mi |
| 901 S Smith Rd #1056 Tempe, AZ | 3.0 | 2.5 | 1833 | $3,000 | $1.64 | 1d | 1 | 1.15mi |
| 2058 E Apache Blvd Tempe, AZ | 1.0–3.0 | 1.0–3.0 | 1028 | $2,276 | $2.21 | 1d | 19 | 1.15mi |
| 2025 E Apache Blvd Tempe, AZ | 1.0–2.0 | 1.0–2.0 | 810 | $2,293 | $2.83 | 1d | 22 | 1.18mi |
| 2182 E Palmcroft Dr Tempe, AZ | 3.0 | 2.0 | 1640 | $2,296 | $1.40 | 21d | 1 | 1.21mi |
| 2134 E Broadway Rd Tempe, AZ | 2.0 | 2.0 | 1083 | $1,488 | $1.37 | 16d | 3 | 1.22mi |
| 1975 E University Dr Tempe, AZ | 1.0–2.0 | 1.0–2.0 | 845 | $1,643 | $1.94 | 1d | 23 | 1.24mi |
| 909 S Kenwood Cir Unit A Tempe, AZ | 2.0 | 1.0 | 1443 | $1,395 | $0.97 | 5d | 1 | 1.24mi |
| 909 S Kenwood Cir Tempe, AZ | 2.0 | 1.0 | 1443 | $1,395 | $0.97 | 1d | 1 | 1.24mi |
Listing history 15 events
-
2026-06-18days on market $19,900 Active 19 DOM
-
2026-06-17days on market $19,900 Active 18 DOM
-
2026-06-16days on market $19,900 Active 17 DOM
-
2026-06-15days on market $19,900 Active 16 DOM
-
2026-06-13days on market $19,900 Active 14 DOM
-
2026-06-13days on market $19,900 Active 13 DOM
-
2026-06-09days on market $19,900 Active 10 DOM
-
2026-06-08days on market $19,900 Active 9 DOM
-
2026-06-07days on market $19,900 Active 8 DOM
-
2026-06-04pricedays on market $19,900 Active 5 DOM
-
2026-06-03days on market $29,500 Active 4 DOM
-
2026-06-02days on market $29,500 Active 3 DOM
-
2026-06-01days on market $29,500 Active 2 DOM
-
2026-05-31remarks 699-char remark
-
2026-05-31$29,500 Active 1 DOM
ⓘ Source: listings_history table (triggers on properties + properties_extension) + one-shot
backfill from property_details.listing_events for pre-trigger history.
Climate risk First Street
- Flood 1/10 Low FEMA zone X (shaded) · 0% chance over 30 yrs
- Wildfire 1/10 Low
- Heat 9/10 Extreme 7 d/yr ≥112°F today · 18 d/yr by 30 yrs out
- Wind 1/10 Low
- Air quality 2/10 Low 1 unhealthy d/yr today · 1 by 30 yrs out
Nearby sold comps map
Loading sold comps map…
Walkable amenities ~0.75 mi
Loading nearby amenities…
Taxation est. · year 1
- Rental income
- $22,172
- − Mortgage interest
- −$1,115
- − Property taxes
- −$298
- − Insurance
- −$100
- − Repairs & maintenance
- −$1,774
- − Management
- −$1,774
- − Depreciation
- −$579
- Taxable income
- $16,533
- Est. tax owed @ 24.0%
- −$3,968
- After-tax cash flow
- $11,898/yr
For passive investors: Depreciation is non-cash, so a rental often shows a tax loss while cash-flowing — sheltering income. Rental losses are passive: they offset passive income freely, and up to $25,000/yr can offset ordinary (W-2) income if you actively participate and your MAGI is under $100k (phasing out to $0 by $150k); unused losses carry forward. On sale, claimed depreciation is recaptured at up to 25%, and gains may owe capital-gains tax (a 1031 exchange can defer both). Figures are a year-1 estimate at your 24.0% rate — not tax advice; consult a CPA.
Schools (NCES district)
- District
- Tempe School District (4258)
- NCES district ID
- 0408310
- Math proficiency
- 17% ▼ -19.00%
- Reading proficiency
- 29% ▼ -10.00%
- Median HH income
- $43,112
- Composite
- 19.7/100
- National rank
- #8721
- State rank
- #170 of 249 in AZ
Livability — Tempe
- Score
- 78/100
- State rank
- #10
- US rank
- #2527
Category grades
Schools grade is shown separately in the Schools card above.
Census & demographics
- Census place
- Tempe, AZ
- County
- Maricopa County · 4,537,380 people
- City population
- 193,337
- Metro
- Phoenix-Mesa-Chandler, AZ
Population outlook (Maricopa County) Hauer SSP2
- Today (2025)
- 4,979,203 people
- By 2030
- 5,378,229 · +8.0%
- By 2040
- 6,156,598 · +23.6%
- By 2050
- 6,872,376 · +38.0%
- By 2075
- 8,401,270 · +68.7%
- By 2100
- 9,247,439 · +85.7%
Not yet ingested
- Political lean
- —
- Race & ethnicity
- —
- Common origin
- —
- Civics
- —
Market trends
- HPI YoY
- ▼ -4.56%
- Current HPI
- 693.23
- Rent YoY
- ▲ 1.66%
- Metro
- Phoenix-Mesa-Chandler, AZ
- State GDP YoY
- ▲ 4.54%
- F500 in state
- 20
Industry mix (Fortune 500 HQ in AZ)
| Industry | F500 HQs | Revenue |
|---|---|---|
| Technology | 2 | $13B |
|
||
| Mining / Metals | 1 | $23B |
|
||
| Environmental Services | 1 | $16B |
|
||
| Metals / Steel | 1 | $14B |
|
||
| Technology Distribution | 1 | $9B |
|
||
| Homebuilding | 1 | $8B |
|
||
Price history
1 event — show timeline
- 2026-05-27 Listed $29,500 ARMLS
Cash-flow waterfall
monthlySold comps — $/sqft
last 12 mo · ≤1 miLoading sold comps…