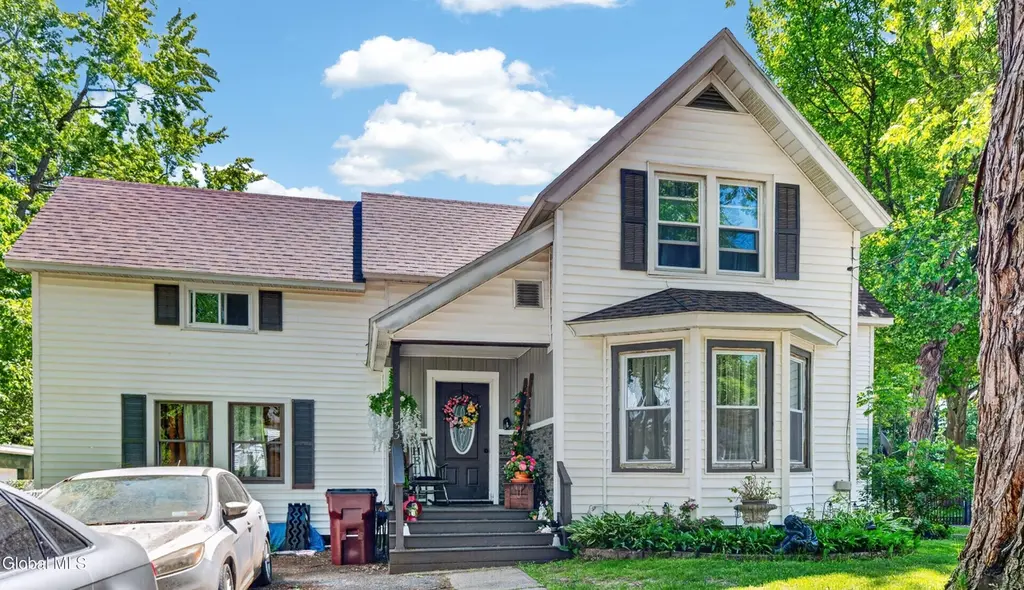
33 Clyde St · Gloversville, NY
Flood risk 1/10 · Minimal
- FEMA flood zone
- X
- Chance of flooding over 30 yrs
- 0.0%
- Est. flood insurance / yr
- $473 – $860
Fire risk 1/10 · Minimal
- Est. fire insurance / yr
- $691 – $1,283
Heat risk 2/10 · Minimal
- Hot days now (above 93°F)
- 7 days/yr
- Hot days in 30 yrs
- 16 days/yr
Wind risk 2/10 · Minimal
- Chance of severe wind over 30 yrs
- 3.0%
Air-quality risk 1/10 · Minimal
- Unhealthy air days now
- 0 days/yr
- Unhealthy air days in 30 yrs
- 0 days/yr
Risk factors via First Street. Map © Google.
Why this score? — see what drove the D+ grade
The composite is a weighted blend of 9 inputs, each scored 0–100. Each bar is that input's sub-score; the figure is the points it added to the 100-point composite (weight × sub-score).
- ARV discount +11.5/15.0
- Appreciation +10.0/10.0
- Cash flow +8.6/30.0
- Livability +4.1/5.0
- Schools +2.8/10.0
- Rent growth +2.5/5.0
- Condition / age +2.5/5.0
- DSCR +2.3/10.0
- 1% rule +2.2/10.0
$229,900
🖨 Deal sheet (PDF) 📄 Offer letter ✓ Due diligence
Listing remarks
Looking for space, character, and room to grow? This inviting Gloversville home offers over 2,500 square feet of living space with 4 bedrooms, 1.5 baths, and a flexible floor plan that fits a variety of lifestyles. Step inside and discover a spacious layout featuring a welcoming living room, formal dining room, and an eat-in kitchen designed for everyday living and entertaining. Hardwood floors add warmth and character throughout much of the home, while large windows bring in abundant natural light. The main floor includes a full bathroom and a versatile bonus room that can easily serve as a home office, playroom, hobby room, guest space, or den. Upstairs, you'll find four generously sized
Key facts
- Large windows
- Formal dining room
- Flexible floor plan
Tags
Property features AI
Exterior
- Parking: Two off-street parking spaces (driveway)
- Utilities: 100 amp electric service with circuit breakers; Public water; Public sewer
- Home design: Single family residence
- Construction: Vinyl siding
- Exterior features: Paved driveway; Corner lot; Shed(s)
Interior
- Kitchen: Dishwasher; Range; Refrigerator
- Bedrooms: Four bedrooms on the second floor
- Flooring: Hardwood floors
- Bathrooms: One full bathroom on the first floor; One half bathroom on the second floor
- Heating & cooling: Electric heating; Forced air; Natural gas
- Interior features: 10 total rooms; Full basement
Neighborhood map
What this means for you Summary
Snapshot
- This is a 4-bed/1.5-bath single-family listed at $230k.
Deal economics
- At list price, monthly cash flow is $-200 ($-2k/yr) — negative.
- To cash-flow at today's rent, offer at most $195k (15.4% below list).
- To meet the 1% rule (rent ≥ 1% of price), the offer needs to be $165k (28.2% below list).
- Recommended offer: $165k (28.2% below list) — sets the bar for 1% rule.
- Cap rate 5.2% vs local median 8.6% in Gloversville — below-typical yield; the buyer is paying a premium for something (appreciation thesis, condition, location) that the cap rate doesn't capture.
Location & tenants
- Location reads 82/100 on livability (#70 in NY, #1,048 nationally) — a professional / high-income tenant draw. Strengths: amenities A+, commute A+, cost of living A+; Watch: employment F.
- Gloversville City School District (town): math 26% / reading 42% proficiency, ranked #565 of 590 in NY (top 96%) — families likely to look elsewhere, expect single-tenant / working-renter base with shorter leases.
- Zoned schools: Boulevard School (math 24% / reading 35%, grade F, #1,729 of 2,108 statewide, top 84%, 568 students, 72% FRL); Gloversville Middle School (math 6% / reading 35%, grade F, #664 of 729 statewide, top 91%, 548 students, 70% FRL); Gloversville High School (math 82% / reading 77%, grade A-, #518 of 1,100 statewide, top 51%, 697 students, 71% FRL) — zoned schools average 71% FRL vs 54% district-wide (17 pts higher); higher-poverty schools than district average — tighter screening recommended.
- Market conditions: 173 active listings in the ZIP; 1 comparable units currently listed for rent nearby; 112 units permitted in Fulton County in 2024 (50 in 5+ unit buildings).
Forward outlook
- In year one you build about $25k of equity ($2k loan paydown + $23k appreciation (10.0% local appreciation)).
- Fulton County population projected at -23% by 2050 — secular population decline; favor cash flow + early exit over multi-decade hold.
- By year 2, paydown + projected appreciation supports a ~$40k cash-out refi (75% LTV) — recoverable capital for the next deal without selling this one.
Negotiation context
- It's been on market 16 days — a 2% lower offer ($226k) is reasonable based on typical stale-listing flexibility.
- Current owner paid $49k; list at $230k implies a 369% gain — meaningful room to come down on a strong offer.
Risks & watch-outs
- Watch-outs: built in 1949 — expect roof / HVAC / electrical / plumbing capex.
Questions for the listing agent
- What do current leases actually rent for vs. the listed asking? Can we see a recent rent roll and the last 12 months of T-12 income?
- Built in 1949 — when were the roof, HVAC, electrical panel, plumbing, and water heater last replaced?
- Is there a deadline driving the sale (1031 exchange, divorce, estate, relocation)? That informs how much negotiation room exists.
- Schools are D-rated, which usually means shorter tenancies and higher turnover. Who's the typical renter profile here, and what's been the actual vacancy rate?
- The area grade is low — what's the realistic commute time and amenity access for the typical tenant pool here? Any planned neighborhood developments (good or bad) we should know about?
- What's the average days-on-market for RENTAL listings here right now (not sales)? A rising rental-DOM trend means longer vacancies and softer asking-rent achievability than the comps imply.
- What's the recent tenant-quality profile in this submarket — average credit score on applications, eviction rate, late-payment / NSF rate, and stable-employment percentage? A property-management company in the area should have these aggregated.
- How much new for-sale + rental construction is in the pipeline within 1–3 miles? Heavy new supply typically softens prices + rents 12–24 months out; constrained supply supports both.
Investment metrics
- 1% rule
- 0.72% ✗
- Cap rate
- 5.25%
- Cash-on-cash
- -3.72%
- DSCR
- 0.83
- GRM
- 11.6
CMA / ARV
- ARV (on-the-fly)
- $252,300
- Comps found
- 11
Show comp detail 11 sales within ~0.75 mi
| Address | Dist | Beds/Ba | Sqft | Sold | Price | $/sf | Match |
|---|---|---|---|---|---|---|---|
| 240 E Fulton St | 0.23mi | 3/2.5 (-1) | 2,590 (+3%) | 6mo | $240,000 | $93 | 71 |
| 34 Pearl St | 0.12mi | 4/2.0 | 2,242 (-11%) | 12mo | $189,000 | $84 | 64 |
| 98 Oakland Ave | 0.34mi | 4/2.5 | 2,419 (-4%) | 15mo | $245,000 | $101 | 61 |
| 12 Lark St | 0.29mi | 3/2.5 (-1) | 2,460 (-2%) | 20mo | $295,000 | $120 | 57 |
| 114 S Kingsboro Ave | 0.42mi | 4/3.0 | 2,387 (-5%) | 14mo | $212,500 | $89 | 54 |
| 95 Kingsboro Ave | 0.66mi | 4/1.5 | 2,480 (-2%) | 21mo | $262,650 | $106 | 49 |
| 38 East Blvd | 0.45mi | 5/2.0 (+1) | 2,146 (-15%) | 3mo | $215,000 | $100 | 44 |
| 62 East Blvd | 0.56mi | 3/1.5 (-1) | 2,170 (-14%) | 2mo | $229,500 | $106 | 44 |
| 139 2nd Ave | 0.58mi | 3/1.0 (-1) | 2,240 (-11%) | 4mo | $167,000 | $75 | 44 |
| 14 Wells St | 0.41mi | 3/2.0 (-1) | 2,700 (+7%) | 24mo | $260,000 | $96 | 42 |
| 107 Kingsboro Ave Ave | 0.72mi | 4/2.5 | 2,200 (-13%) | 20mo | $310,000 | $141 | 24 |
Match score weights: distance 35% · size 25% · config 20% · recency 20%. Top-matched comps best support the ARV.
Projected returns pro-forma
10.0% appreciation · 3.0% rent growth · sell at horizon
- IRR
- 21.6%
- Equity multiple
- 2.75×
- Total profit
- $112,456
- Equity at exit
- $207,112
- IRR
- 19.5%
- Equity multiple
- 6.30×
- Total profit
- $341,117
- Equity at exit
- $446,645
Cash invested: $64,372 (down + closing). Projections, not guarantees.
Landlord ↔ Tenant lean methodology
- Overall (STATE)
- 15 Strongly Tenant-Friendly
- State New York
- 15 Strongly Tenant-Friendly · D+10
- County
- — inherits STATE
- City
- — inherits STATE
ZIP-level market 12078
- Home prices YoY
- 12.2%
- Active inventory
- 173
- Price-to-rent
- 11.6×
Monthly cashflow live
- Estimated rent
- $1,650 medium interval (Pro) →
- Mortgage (P&I)
- −$1,206
- Tax from tax record
- −$202 /mo · $2,423/yr
- Insurance
- −$96
- HOA
- −$0
- Vacancy / Maint / Mgmt
- −$346
- Net cashflow
- $-200
Break-even live
Sensitivity live
| Price | -10% $-70 | -5% $-135 | +0% $-200 | +5% $-265 | +10% $-330 |
|---|---|---|---|---|---|
| Rent | -10% $-330 | -5% $-265 | +0% $-200 | +5% $-135 | +10% $-69 |
| Rate | -1.0pp $-84 | -0.5pp $-141 | base $-200 | +0.5pp $-259 | +1.0pp $-320 |
UW: 25.0% down · 7.5% · 30yr · 1.5% tax · 5.0% vac · 8.0% maint · 8.0% mgmt
Financing live
Cash to close
- Down payment
- $57,475
- Closing costs
- $6,897
- Reserves months
- —
- Total cash needed
- —
Loan-product check · same deal, 3 products live
Conventional
25% down · 7.5% · 30yr
- Down + closing
- —
- Monthly P&I
- —
- Monthly cashflow
- —
- DSCR
- —
- Eligible?
- —
Personal DTI + credit; lowest rate.
DSCR
20% down · 8.5% · 30yr
- Down + closing
- —
- Monthly P&I
- —
- Monthly cashflow
- —
- DSCR
- —
- Eligible?
- —
No personal income docs; deal must DSCR.
Hard money
10% down · 12.0% · 12mo
- Down + closing
- —
- Monthly P&I
- —
- Monthly cashflow
- —
- DSCR
- —
- Eligible?
- —
Short-term bridge; refi at stabilization.
Rent comps 1 comps
| Address | Beds | Baths | Sqft | Rent | $/sqft | DOM | Units | Dist |
|---|---|---|---|---|---|---|---|---|
| 11 Fremont St Gloversville, NY | 2.0–3.0 | 1.5–2.0 | 1612 | $1,650 | $1.02 | 45d | 3 | 0.67mi |
Listing history 13 events
-
2026-06-21days on market $229,900 Active 16 DOM
-
2026-06-21days on market $229,900 Active 15 DOM
-
2026-06-18days on market $229,900 Active 13 DOM
-
2026-06-17days on market $229,900 Active 12 DOM
-
2026-06-16days on market $229,900 Active 11 DOM
-
2026-06-15days on market $229,900 Active 10 DOM
-
2026-06-13days on market $229,900 Active 8 DOM
-
2026-06-12days on market $229,900 Active 7 DOM
-
2026-06-09days on market $229,900 Active 4 DOM
-
2026-06-08days on market $229,900 Active 3 DOM
-
2026-06-07days on market $229,900 Active 2 DOM
-
2026-06-07remarks 699-char remark
-
2026-06-07$229,900 Active 1 DOM
ⓘ Source: listings_history table (triggers on properties + properties_extension) + one-shot
backfill from property_details.listing_events for pre-trigger history.
Tax reassessment forecast NY · Partial reset (capped growth)
- Current annual tax
- $2,423 · $202/mo
- Projected year-2 tax
- $3,154 · $263/mo
- Expected delta
- +$731/yr (+$61/mo · 30.2%)
ⓘ Screening estimate from a state-policy table — verify with the county assessor before closing.
Climate risk First Street
- Flood 1/10 Low FEMA zone X · 0% chance over 30 yrs
- Wildfire 1/10 Low
- Heat 2/10 Low 7 d/yr ≥93°F today · 16 d/yr by 30 yrs out
- Wind 2/10 Low 3% chance of damaging wind over 30 yrs
- Air quality 1/10 Low 0 unhealthy d/yr today · 0 by 30 yrs out
Nearby sold comps map
Loading sold comps map…
Walkable amenities ~0.75 mi
Loading nearby amenities…
Taxation est. · year 1
- Rental income
- $19,800
- − Mortgage interest
- −$12,878
- − Property taxes
- −$2,423
- − Insurance
- −$1,150
- − Repairs & maintenance
- −$1,584
- − Management
- −$1,584
- − Depreciation
- −$6,688
- Taxable loss
- −$6,506
- Est. tax savings @ 24.0%
- +$1,562
- After-tax cash flow
- $-836/yr
For passive investors: Depreciation is non-cash, so a rental often shows a tax loss while cash-flowing — sheltering income. Rental losses are passive: they offset passive income freely, and up to $25,000/yr can offset ordinary (W-2) income if you actively participate and your MAGI is under $100k (phasing out to $0 by $150k); unused losses carry forward. On sale, claimed depreciation is recaptured at up to 25%, and gains may owe capital-gains tax (a 1031 exchange can defer both). Figures are a year-1 estimate at your 24.0% rate — not tax advice; consult a CPA.
Schools (NCES district)
- District
- Gloversville City School District
- NCES district ID
- 3612270
- Math proficiency
- 26% ▼ -6.00%
- Reading proficiency
- 42% ▲ 7.00%
- Median HH income
- $36,775
- Composite
- 28.2/100
- National rank
- #6806
- State rank
- #565 of 590 in NY
Livability — Gloversville
- Score
- 82/100
- State rank
- #70
- US rank
- #1048
Category grades
Schools grade is shown separately in the Schools card above.
Census & demographics
- Census place
- Gloversville, NY
- Population (ZIP)
- 23,087
Population outlook (Fulton County) Hauer SSP2
- Today (2025)
- 51,132 people
- By 2030
- 49,114 · -3.9%
- By 2040
- 44,373 · -13.2%
- By 2050
- 39,321 · -23.1%
- By 2075
- 28,503 · -44.3%
- By 2100
- 19,268 · -62.3%
Race, ethnicity, and origin ACS 2023
- Neighborhood character
- Predominantly White (86%)
- Race & ethnicity
- White 86% Two or more races 8% Hispanic / Latino 5% Black 2% Asian 1%
- Hispanic origin (detail)
- Puerto Rican 3%
- Common ancestry
- Lithuanian 5% Romanian 4% Iranian 4%
- Foreign-born
- 2% · Canada, China
- Languages at home
- 97% English-only · Spanish 2%
Political lean MEDSL · Fulton
- 2024 margin
- Solid R (+35.9) · D 32.1% · R 67.9%
- 2008→2024 swing
- -26.6pp toward R · 2008: -9.2pp · 2024: -35.9pp
- All cycles
- 2024: R+35.9 2020: R+31.4 2016: R+35.5 2012: R+10.5 2008: R+9.2
Not yet ingested
- Civics
- —
Market trends
- HPI YoY
- ▲ 34.22%
- Current HPI
- 315.1368
- Rent YoY
- —
- Metro
- —
- State GDP YoY
- ▲ 2.60%
- F500 in state
- 92
Industry mix (Fortune 500 HQ in NY)
| Industry | F500 HQs | Revenue |
|---|---|---|
| Financial Services | 10 | $950B |
|
||
| Consumer Goods | 9 | $162B |
|
||
| Insurance | 4 | $225B |
|
||
| Telecommunications | 2 | $144B |
|
||
| Pharmaceuticals | 2 | $112B |
|
||
| Media / Entertainment | 2 | $69B |
|
||
Price history
+405.3% since first listed3 events — show timeline
- 2026-06-05 Listed $229,900 Global MLS
- 2006-04-28 Sold (Public Records) $49,000 Public Records
- 1996-11-06 Sold (Public Records) $45,500 Public Records
Property tax history
+1.1%/yrLatest (2025): $2,423 · +5.4% YoY. Source: county tax records.
Cash-flow waterfall
monthlySold comps — $/sqft
last 12 mo · ≤1 miLoading sold comps…