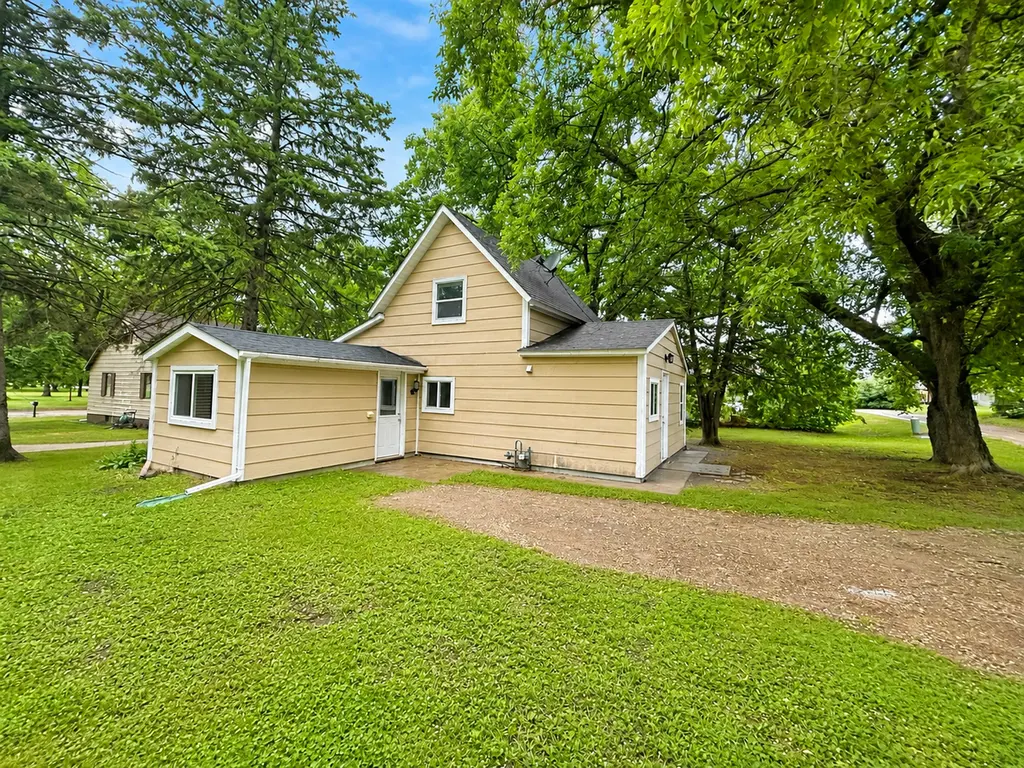
404 E Gilman St · New York Mills, MN
Flood risk 1/10 · Minimal
- FEMA flood zone
- —
- Chance of flooding over 30 yrs
- 0.0%
- Est. flood insurance / yr
- —
Fire risk 2/10 · Minimal
- Est. fire insurance / yr
- $888 – $1,650
Heat risk 2/10 · Minimal
- Hot days now (above 95°F)
- 7 days/yr
- Hot days in 30 yrs
- 12 days/yr
Wind risk 2/10 · Minimal
- Chance of severe wind over 30 yrs
- —
Air-quality risk 3/10 · Minor
- Unhealthy air days now
- 2 days/yr
- Unhealthy air days in 30 yrs
- 3 days/yr
Risk factors via First Street. Map © Google.
Why this score? — see what drove the C+ grade
The composite is a weighted blend of 9 inputs, each scored 0–100. Each bar is that input's sub-score; the figure is the points it added to the 100-point composite (weight × sub-score).
- Cash flow +20.3/30.0
- Appreciation +9.1/10.0
- ARV discount +7.5/15.0
- DSCR +6.4/10.0
- 1% rule +4.5/10.0
- Livability +3.9/5.0
- Schools +3.8/10.0
- Rent growth +2.5/5.0
- Condition / age +2.5/5.0
$114,000
🖨 Deal sheet 📄 Offer letter ✓ Due diligence
Listing remarks
Enjoy the benefits of home ownership without breaking the bank. Adorable 3 bedroom 1 bath home on a nicely wooded and shaded lot and a 2 stall garage. Home has a main floor bedroom, bath, laundry and a bonus room for an office. The upper level has 2 bedrooms. With a little vision and updating this home will shine!
Key facts
- 0.3 acre lot
- 2 garage spots
- Built 1934
Property features AI
Finance
- Other: Living area reported as 1,160 square feet; Main level finished area 860
Exterior
- Parking: Detached 2-car garage
- Utilities: City water; City sewer; Natural gas
- Home design: Residential property; One-and-a-half story; No external stairs (accessible)
- Construction: Block foundation; Built area: above grade finished area 1,160; below grade 160; total building area 1,320
- Exterior features: Vinyl exterior; Approximately 0.297-acre lot; 16-foot driveway access from E Gilman St
Interior
- Bedrooms: 3 bedrooms
- Bathrooms: 1 full bathroom
- Heating & cooling: Baseboard heating; Fireplace heating; No central air
- Interior features: Crawl space basement; One fireplace
Neighborhood map
What this means for you Summary
Snapshot
- This is a 3-bed/1.0-bath single-family listed at $114k.
Deal economics
- At list price, monthly cash flow is $146 ($2k/yr) — positive.
- The deal already cash-flows at list — no discount required.
- To meet the 1% rule (rent ≥ 1% of price), the offer needs to be $108k (5.0% below list).
- Recommended offer: $108k (5.0% below list) — sets the bar for 1% rule.
Location & tenants
- Location reads 78/100 on livability (#112 in MN, #2,554 nationally) — a middle-class / working-renter tenant base. Strengths: crime A+, cost of living A+, housing A+; Watch: employment C-, amenities F, commute F.
- New York Mills Public School District (rural): math 41% / reading 47% proficiency, ranked #189 of 301 in MN (top 63%) — families likely to look elsewhere, expect single-tenant / working-renter base with shorter leases.
- Market conditions: 31 active listings in the ZIP; 140 units permitted in Otter Tail County in 2024 (48 in 5+ unit buildings).
Forward outlook
- In year one you build about $10k of equity ($788 loan paydown + $9k appreciation (8.2% local appreciation)).
- At projected returns (8.2% appreciation + 3.0% rent growth), your $32k cash investment doubles in ~3 years — after that, you're playing with house money.
- By year 4, paydown + projected appreciation supports a ~$35k cash-out refi (75% LTV) — recoverable capital for the next deal without selling this one.
Negotiation context
- Only 10 days on market — expect competitive offers; lowballing is unlikely to land.
Risks & watch-outs
- Watch-outs: built in 1934 — expect roof / HVAC / electrical / plumbing capex.
Questions for the listing agent
- Built in 1934 — when were the roof, HVAC, electrical panel, plumbing, and water heater last replaced?
- Is there a deadline driving the sale (1031 exchange, divorce, estate, relocation)? That informs how much negotiation room exists.
- Schools are B-rated — typically a magnet for longer-tenancy family renters. What's the average tenant stay here, and is there a school-zone premium baked into asking?
- What's the average days-on-market for RENTAL listings here right now (not sales)? A rising rental-DOM trend means longer vacancies and softer asking-rent achievability than the comps imply.
- What's the recent tenant-quality profile in this submarket — average credit score on applications, eviction rate, late-payment / NSF rate, and stable-employment percentage? A property-management company in the area should have these aggregated.
- How much new for-sale + rental construction is in the pipeline within 1–3 miles? Heavy new supply typically softens prices + rents 12–24 months out; constrained supply supports both.
Investment metrics
- 1% rule
- 0.95% ✗
- Cap rate
- 7.83%
- Cash-on-cash
- 5.50%
- DSCR
- 1.24
- GRM
- 8.8
CMA / ARV
No comps found within radius.
Projected returns pro-forma
8.2% appreciation · 3.0% rent growth · sell at horizon
- IRR
- 24.6%
- Equity multiple
- 2.81×
- Total profit
- $57,737
- Equity at exit
- $88,197
- IRR
- 22.2%
- Equity multiple
- 6.03×
- Total profit
- $160,606
- Equity at exit
- $176,606
Cash invested: $31,920 (down + closing). Projections, not guarantees.
Landlord ↔ Tenant lean methodology
- Overall (STATE)
- 46 Balanced
- State Minnesota
- 46 Balanced · D+2
- County
- — inherits STATE
- City
- — inherits STATE
ZIP-level market 56567
- Home prices YoY
- 3.5%
- Active inventory
- 31
- Price-to-rent
- 8.8×
Monthly cashflow live
- Estimated rent
- $1,083 medium interval (Pro) →
- Mortgage (P&I)
- −$598
- Tax from tax record
- −$64 /mo · $766/yr
- Insurance
- −$48
- HOA
- −$0
- Vacancy / Maint / Mgmt
- −$227
- Net cashflow
- $146
Break-even live
UW: 25.0% down · 7.5% · 30yr · 1.5% tax · 5.0% vac · 8.0% maint · 8.0% mgmt
Financing live
Cash to close
- Down payment
- $28,500
- Closing costs
- $3,420
- Reserves months
- —
- Total cash needed
- —
Loan-product check · same deal, 3 products live
Conventional
25% down · 7.5% · 30yr
- Down + closing
- —
- Monthly P&I
- —
- Monthly cashflow
- —
- DSCR
- —
- Eligible?
- —
Personal DTI + credit; lowest rate.
DSCR
20% down · 8.5% · 30yr
- Down + closing
- —
- Monthly P&I
- —
- Monthly cashflow
- —
- DSCR
- —
- Eligible?
- —
No personal income docs; deal must DSCR.
Hard money
10% down · 12.0% · 12mo
- Down + closing
- —
- Monthly P&I
- —
- Monthly cashflow
- —
- DSCR
- —
- Eligible?
- —
Short-term bridge; refi at stabilization.
Listing history 8 events
-
2026-06-18days on market $114,000 Active 10 DOM
-
2026-06-17days on market $114,000 Active 9 DOM
-
2026-06-16days on market $114,000 Active 8 DOM
-
2026-06-15days on market $114,000 Active 7 DOM
-
2026-06-13days on market $114,000 Active 5 DOM
-
2026-06-12days on market $114,000 Active 4 DOM
-
2026-06-09remarks 315-char remark
-
2026-06-09$114,000 Active 1 DOM
ⓘ Source: listings_history table (triggers on properties + properties_extension) + one-shot
backfill from property_details.listing_events for pre-trigger history.
Tax reassessment forecast MN · Partial reset (capped growth)
- Current annual tax
- $766 · $64/mo
- Projected year-2 tax
- $1,021 · $85/mo
- Expected delta
- +$255/yr (+$21/mo · 33.3%)
ⓘ Screening estimate from a state-policy table — verify with the county assessor before closing.
Climate risk First Street
- Flood 1/10 Low 0% chance over 30 yrs
- Wildfire 2/10 Low
- Heat 2/10 Low 7 d/yr ≥95°F today · 12 d/yr by 30 yrs out
- Wind 2/10 Low
- Air quality 3/10 Moderate 2 unhealthy d/yr today · 3 by 30 yrs out
Nearby sold comps map
Loading sold comps map…
Walkable amenities ~0.75 mi
Loading nearby amenities…
Taxation est. · year 1
- Rental income
- $12,994
- − Mortgage interest
- −$6,386
- − Property taxes
- −$766
- − Insurance
- −$570
- − Repairs & maintenance
- −$1,039
- − Management
- −$1,039
- − Depreciation
- −$3,316
- Taxable loss
- −$124
- Est. tax savings @ 24.0%
- +$30
- After-tax cash flow
- $1,785/yr
For passive investors: Depreciation is non-cash, so a rental often shows a tax loss while cash-flowing — sheltering income. Rental losses are passive: they offset passive income freely, and up to $25,000/yr can offset ordinary (W-2) income if you actively participate and your MAGI is under $100k (phasing out to $0 by $150k); unused losses carry forward. On sale, claimed depreciation is recaptured at up to 25%, and gains may owe capital-gains tax (a 1031 exchange can defer both). Figures are a year-1 estimate at your 24.0% rate — not tax advice; consult a CPA.
Schools (NCES district)
- District
- New York Mills Public School District
- NCES district ID
- 2723520
- Math proficiency
- 41% ▼ -15.00%
- Reading proficiency
- 47% ▼ -13.00%
- Median HH income
- $47,845
- Composite
- 37.59/100
- National rank
- #4382
- State rank
- #189 of 301 in MN
Livability — New York Mills
- Score
- 78/100
- State rank
- #112
- US rank
- #2554
Category grades
Schools grade is shown separately in the Schools card above.
Census & demographics
- Census place
- New York Mills, MN
- Population (ZIP)
- 3,247
Population outlook (Otter Tail County) Hauer SSP2
- Today (2025)
- 58,183 people
- By 2030
- 58,267 · +0.1%
- By 2040
- 57,999 · -0.3%
- By 2050
- 57,183 · -1.7%
- By 2075
- 57,638 · -0.9%
- By 2100
- 54,697 · -6.0%
Race, ethnicity, and origin ACS 2023
- Neighborhood character
- Predominantly White (93%)
- Race & ethnicity
- White 93% Two or more races 4% Hispanic / Latino 1%
- Common ancestry
- Portuguese 10% Romanian 6% Iranian 3%
- Foreign-born
- 1% · Canada
- Languages at home
- 94% English-only · Spanish 2% German/W. Germanic 2%
Political lean MEDSL · Otter Tail
- 2024 margin
- Solid R (+34.2) · D 32.1% · R 66.3% · Other 1.6%
- 2008→2024 swing
- -21.3pp toward R · 2008: -12.9pp · 2024: -34.2pp
- All cycles
- 2024: R+34.2 2020: R+32.5 2016: R+35.9 2012: R+21.2 2008: R+12.9
Not yet ingested
- Civics
- —
Market trends
- HPI YoY
- ▲ 8.20%
- Current HPI
- 244.2142
- Rent YoY
- —
- Metro
- —
- State GDP YoY
- ▲ 2.41%
- F500 in state
- 34
Industry mix (Fortune 500 HQ in MN)
| Industry | F500 HQs | Revenue |
|---|---|---|
| Healthcare | 2 | $407B |
|
||
| Retail | 2 | $150B |
|
||
| Consumer Goods | 2 | $32B |
|
||
| Industrial Machinery | 2 | $6B |
|
||
| Agriculture | 1 | $40B |
|
||
| Healthcare / Medical Devices | 1 | $32B |
|
||
Price history
1 event — show timeline
- 2026-06-01 Listed $114,000 NORTHSTARMLS as Distributed by MLS Grid
Property tax history
+3.8%/yrLatest (2025): $766 · +3.8% YoY. Source: county tax records.
Cash-flow waterfall
monthlySold comps — $/sqft
last 12 mo · ≤1 miLoading sold comps…