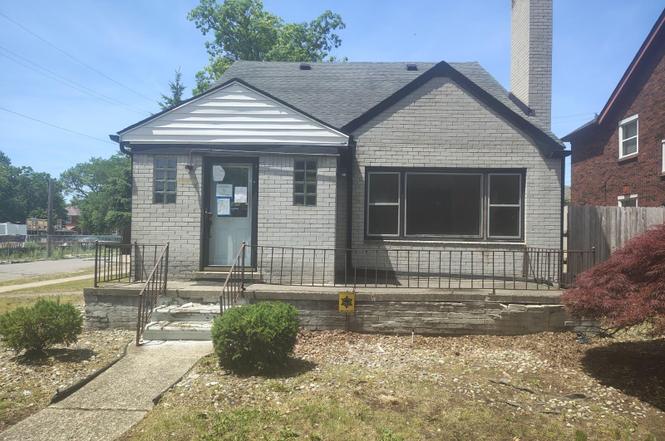
16803 Normandy St · Detroit, MI
Flood risk 1/10 · Minimal
- FEMA flood zone
- X (unshaded)
- Chance of flooding over 30 yrs
- 0.0%
- Est. flood insurance / yr
- $473 – $860
Fire risk 1/10 · Minimal
- Est. fire insurance / yr
- $784 – $1,456
Heat risk 2/10 · Minimal
- Hot days now (above 97°F)
- 7 days/yr
- Hot days in 30 yrs
- 14 days/yr
Wind risk 2/10 · Minimal
- Chance of severe wind over 30 yrs
- —
Air-quality risk 4/10 · Minor
- Unhealthy air days now
- 4 days/yr
- Unhealthy air days in 30 yrs
- 6 days/yr
Risk factors via First Street. Map © Google.
Why this score? — see what drove the C grade
The composite is a weighted blend of 9 inputs, each scored 0–100. Each bar is that input's sub-score; the figure is the points it added to the 100-point composite (weight × sub-score).
- Cash flow +30.0/30.0
- DSCR +10.0/10.0
- 1% rule +9.2/10.0
- Livability +3.7/5.0
- Rent growth +3.4/5.0
- Condition / age +2.5/5.0
- Schools +1.3/10.0
- ARV discount +0.0/15.0
- Appreciation +0.0/10.0
$94,900
🖨 Deal sheet 📄 Offer letter ✓ Due diligence
Listing remarks MLS
Amazing opportunity on this 2 bedroom, 1 full bath, 2 half baths brick residence combining classic Detroit character with fantastic upside. Boasting 1,346 square feet of comfortable living space, this home features a spacious layout, a spacious basement perfect for a recreation room or home office. Situated on a tree-lined street just blocks away from University District and the Avenue of Fashion, you are minutes from excellent local dining, shopping, and major commuter routes via the Lodge Freeway (M-10). Sold as is. Buyer and agent to verify all information.
Key facts
- Brick residence
- University district
- Tree-lined street
Tags
Property features AI
Finance
- Financial info: Annual tax: $1,152
Exterior
- Parking: Detached 1-car garage
- Utilities: Public water; Public sewer
- Home design: Single-family residence; One and one-half stories; Ground-level entry; Brick exterior
- Construction: Brick construction
- Exterior features: Paved road access; Lot dimensions approximately 52 x 114 (0.13 acres)
Interior
- Bedrooms: Total of 2 rooms
- Bathrooms: 1 full bathroom; 2 half bathrooms
- Heating & cooling: Forced air heating (natural gas); No central cooling
- Interior features: Unfinished basement
Neighborhood map
What this means for you Summary
Snapshot
- This is a 2-bed/1.0-bath single-family listed at $95k.
Deal economics
- At list price, monthly cash flow is $430 ($5k/yr) — positive.
- The deal already cash-flows at list — no discount required.
- Meets the 1% rule at list price ($1k rent vs $95k).
Location & tenants
- Location reads 73/100 on livability (#218 in MI) — a middle-class / working-renter tenant base. Strengths: amenities A+, commute A+, cost of living A+; Watch: schools F, crime F, employment F.
- Detroit Public Schools Community District (urban): math 10% / reading 24% proficiency, ranked #499 of 540 in MI (top 92%) — low school quality limits family demand, transient renter base, plan for 1-2y turnover; 90% free/reduced lunch — lower-income household profile, screen leases tightly.
- Market conditions: Rents rising (+3.4%/yr); 349 active listings in the ZIP; 40 comparable units currently listed for rent nearby; rentals at typical pace (median 24d on market — plan ~3-4 weeks tenant-placement turnaround); 48% of comp listings sitting > 30 days — soft ceiling on asking rent; 2,639 units permitted in Wayne County in 2024 (1,216 in 5+ unit buildings).
Forward outlook
- Local home prices are declining (-3.0%/yr); year-one equity from $656 of loan paydown is wiped out by about $3k of value loss. Plan a longer hold.
- Wayne County population projected at -17% by 2050 — secular population decline; favor cash flow + early exit over multi-decade hold.
- At projected returns (-3.0% appreciation + 3.4% rent growth), your $27k cash investment doubles in ~7 years — after that, you're playing with house money.
Negotiation context
- Only 1 days on market — expect competitive offers; lowballing is unlikely to land.
- 2 sale attempts with the ask held roughly flat each time — persistent listings suggest the price (not the market) is what's stuck; bring a comps-based counter.
Risks & watch-outs
- Watch-outs: built in 1955 — expect roof / HVAC / electrical / plumbing capex.
Questions for the listing agent
- Built in 1955 — when were the roof, HVAC, electrical panel, plumbing, and water heater last replaced?
- Is there a deadline driving the sale (1031 exchange, divorce, estate, relocation)? That informs how much negotiation room exists.
- Schools are F-rated, which usually means shorter tenancies and higher turnover. Who's the typical renter profile here, and what's been the actual vacancy rate?
- Crime grade is F in this area — have there been break-ins, vandalism, or insurance claims at this property in the last 3 years? What carrier currently insures it and at what premium?
- What's the average days-on-market for RENTAL listings here right now (not sales)? A rising rental-DOM trend means longer vacancies and softer asking-rent achievability than the comps imply.
- What's the recent tenant-quality profile in this submarket — average credit score on applications, eviction rate, late-payment / NSF rate, and stable-employment percentage? A property-management company in the area should have these aggregated.
- How much new for-sale + rental construction is in the pipeline within 1–3 miles? Heavy new supply typically softens prices + rents 12–24 months out; constrained supply supports both.
Investment metrics
- 1% rule
- 1.42% ✓
- Cap rate
- 11.73%
- Cash-on-cash
- 19.40%
- DSCR
- 1.86
- GRM
- 5.9
CMA / ARV
- ARV (on-the-fly)
- $68,646
- Comps found
- 12
Show comp detail 12 sales within ~0.75 mi
| Address | Dist | Beds/Ba | Sqft | Sold | Price | $/sf | Match |
|---|---|---|---|---|---|---|---|
| 16177 Inverness St | 0.33mi | 3/1.0 (+1) | 1,404 (+4%) | 4mo | $70,000 | $50 | 69 |
| 15877 Baylis St | 0.46mi | 3/1.0 (+1) | 1,400 (+4%) | 5mo | $71,000 | $51 | 63 |
| 16180 Wildemere St | 0.37mi | 3/1.5 (+1) | 1,454 (+8%) | 2mo | $115,000 | $79 | 60 |
| 16533 Parkside St | 0.27mi | 3/2.0 (+1) | 1,500 (+11%) | 2mo | $205,000 | $137 | 58 |
| 16141 Wildemere St | 0.42mi | 3/1.5 (+1) | 1,448 (+8%) | 5mo | $165,000 | $114 | 57 |
| 15904 Parkside St | 0.45mi | 3/1.5 (+1) | 1,204 (-10%) | 2mo | $140,000 | $116 | 53 |
| 15840 Lawton St | 0.47mi | 3/1.0 (+1) | 1,176 (-13%) | 6mo | $38,000 | $32 | 46 |
| 15897 Holmur St | 0.68mi | 3/1.0 (+1) | 1,260 (-6%) | 13mo | $35,000 | $28 | 42 |
| 15863 Belden St | 0.62mi | 3/1.0 (+1) | 1,156 (-14%) | 1mo | $18,600 | $16 | 42 |
| 17421 Quincy St | 0.72mi | 3/1.5 (+1) | 1,474 (+10%) | 2mo | $234,500 | $159 | 42 |
| 15580 Linwood St | 0.60mi | 3/1.0 (+1) | 1,546 (+15%) | 6mo | $45,000 | $29 | 37 |
| 15404 Normandy St | 0.74mi | 3/3.0 (+1) | 1,486 (+10%) | 13mo | $76,000 | $51 | 24 |
Match score weights: distance 35% · size 25% · config 20% · recency 20%. Top-matched comps best support the ARV.
Projected returns pro-forma
-3.0% appreciation · 3.44% rent growth · sell at horizon
- IRR
- 11.9%
- Equity multiple
- 1.47×
- Total profit
- $12,593
- Equity at exit
- $14,150
- IRR
- 21.2%
- Equity multiple
- 2.83×
- Total profit
- $48,708
- Equity at exit
- $8,205
Cash invested: $26,572 (down + closing). Projections, not guarantees.
Landlord ↔ Tenant lean methodology
- Overall (STATE)
- 62 Landlord-Friendly
- State Michigan
- 62 Landlord-Friendly · EVEN
- County
- — inherits STATE
- City
- — inherits STATE
ZIP-level market 48221
- Rents YoY
- 3.4%
- Active inventory
- 349
- Price-to-rent
- 5.9×
Monthly cashflow live
- Estimated rent
- $1,345 high interval (Pro) →
- Mortgage (P&I)
- −$498
- Tax from tax record
- −$96 /mo · $1,152/yr
- Insurance
- −$40
- HOA
- −$0
- Vacancy / Maint / Mgmt
- −$283
- Net cashflow
- $430
Break-even live
UW: 25.0% down · 7.5% · 30yr · 1.5% tax · 5.0% vac · 8.0% maint · 8.0% mgmt
Financing live
Cash to close
- Down payment
- $23,725
- Closing costs
- $2,847
- Reserves months
- —
- Total cash needed
- —
Loan-product check · same deal, 3 products live
Conventional
25% down · 7.5% · 30yr
- Down + closing
- —
- Monthly P&I
- —
- Monthly cashflow
- —
- DSCR
- —
- Eligible?
- —
Personal DTI + credit; lowest rate.
DSCR
20% down · 8.5% · 30yr
- Down + closing
- —
- Monthly P&I
- —
- Monthly cashflow
- —
- DSCR
- —
- Eligible?
- —
No personal income docs; deal must DSCR.
Hard money
10% down · 12.0% · 12mo
- Down + closing
- —
- Monthly P&I
- —
- Monthly cashflow
- —
- DSCR
- —
- Eligible?
- —
Short-term bridge; refi at stabilization.
Rent comps 40 comps
| Address | Beds | Baths | Sqft | Rent | $/sqft | DOM | Units | Dist |
|---|---|---|---|---|---|---|---|---|
| 2521 W McNichols Rd Unit B2 Detroit, MI | 2.0 | 1.0 | 1300 | $1,250 | $0.96 | 43d | 1 | 0.15mi |
| 16927 Inverness St Detroit, MI | 2.0 | 1.0 | 897 | $1,650 | $1.84 | 16d | 1 | 0.23mi |
| 16174 Princeton St Detroit, MI | 2.0 | 1.0 | 985 | $1,100 | $1.12 | 19d | 1 | 0.27mi |
| 16174 Princeton St Unit 2 Detroit, MI | 2.0 | 1.0 | 985 | $1,100 | $1.12 | 43d | 1 | 0.27mi |
| 16834 Fairfield St Detroit, MI | 2.0 | 1.0 | 1516 | $1,363 | $0.90 | 24d | 1 | 0.41mi |
| 15906 Alden St Detroit, MI | 3.0 | 1.0 | 1030 | $1,150 | $1.12 | 16d | 1 | 0.43mi |
| 326 Eason St Highland Park, MI | 3.0 | 1.0 | 1256 | $1,300 | $1.04 | 17d | 1 | 0.66mi |
| 17670 Manderson Rd Unit 17670 Detroit, MI | 2.0 | 1.0 | 1199 | $1,595 | $1.33 | 43d | 1 | 0.68mi |
| 17765 Manderson Rd Unit 14 Highland Park, MI | 2.0 | 1.0 | 1000 | $1,175 | $1.18 | 43d | 1 | 0.68mi |
| 17765 Manderson Rd Unit 22 Highland Park, MI | 1.0 | 1.0 | 935 | $1,245 | $1.33 | 24d | 1 | 0.68mi |
| 17765 Manderson Rd Unit 8 Highland Park, MI | 2.0 | 1.0 | 1000 | $1,215 | $1.22 | 1d | 1 | 0.68mi |
| 17666 Manderson Rd Unit 17666 Detroit, MI | 2.0 | 1.0 | 1200 | $1,595 | $1.33 | 43d | 1 | 0.68mi |
| 1031 Covington Dr Unit 1061 Detroit, MI | 2.0 | 1.0 | 1200 | $1,595 | $1.33 | 43d | 1 | 0.69mi |
| 1029 Covington Dr Unit 1029 Detroit, MI | 2.0 | 1.0 | 1200 | $1,495 | $1.25 | 43d | 1 | 0.69mi |
| 931 Covington Dr Unit 106 Highland Park, MI | 1.0 | 2.0 | 1000 | $1,275 | $1.27 | 43d | 1 | 0.70mi |
| 885 Covington Dr Unit 201 Highland Park, MI | 2.0 | 2.0 | 1350 | $1,695 | $1.26 | 43d | 1 | 0.72mi |
| 17215 Warrington Dr Detroit, MI | 2.0 | 1.0 | 1015 | $2,000 | $1.97 | 43d | 1 | 0.72mi |
| 16582 Santa Rosa Dr Detroit, MI | 3.0 | 1.0 | 1314 | $1,399 | $1.06 | 17d | 1 | 0.81mi |
| 15345 Parkside St Detroit, MI | 3.0 | 1.0 | 1152 | $1,300 | $1.13 | 43d | 1 | 0.82mi |
| 17150 Santa Rosa Dr Detroit, MI | 1.0 | 1.0 | 950 | $1,250 | $1.32 | 17d | 1 | 0.83mi |
| 17145 Santa Rosa Dr Unit 1 Detroit, MI | 3.0 | 1.0 | 1050 | $1,400 | $1.33 | 17d | 1 | 0.86mi |
| 17147 Monica St Unit 2 1 Detroit, MI | 2.0 | 1.0 | 900 | $975 | $1.08 | 24d | 1 | 0.91mi |
| 17550 2nd Ave Detroit, MI | 2.0 | 1.0 | 1350 | $1,150 | $0.85 | 17d | 1 | 0.94mi |
| 17596 Santa Rosa Dr Detroit, MI | 2.0 | 1.0 | 1350 | $1,195 | $0.89 | 43d | 1 | 0.95mi |
| 17596 Santa Rosa Dr Unit 2 Detroit, MI | 2.0 | 1.0 | 1350 | $1,195 | $0.89 | 24d | 1 | 0.95mi |
| 17551 Santa Rosa Dr Detroit, MI | 2.0 | 1.0 | 1036 | $1,095 | $1.06 | 43d | 1 | 0.96mi |
| 17163 Prairie St Unit 1B Detroit, MI | 3.0 | 1.5 | 1317 | $1,350 | $1.03 | 43d | 1 | 0.97mi |
| 16255 Lilac St Detroit, MI | 3.0 | 1.0 | 1312 | $1,394 | $1.06 | 17d | 1 | 1.05mi |
| 7350 Globe St Detroit, MI | 3.0 | 1.0 | 1000 | $1,550 | $1.55 | 3d | 1 | 1.06mi |
| 16722 Tuller St Detroit, MI | 3.0 | 1.5 | 1100 | $1,500 | $1.36 | 16d | 1 | 1.07mi |
| 2286 Kendall St Detroit, MI | 1.0 | 1.0 | 1689 | $500 | $0.30 | 43d | 1 | 1.14mi |
| 17368 Woodingham Dr Detroit, MI | 3.0 | 1.5 | 1200 | $1,800 | $1.50 | 43d | 1 | 1.22mi |
| 15771 Turner St Detroit, MI | 2.0 | 1.0 | 1000 | $1,049 | $1.05 | 43d | 1 | 1.24mi |
| 574 W Golden Gate Highland Park, MI | 3.0 | 1.0 | 1315 | $1,300 | $0.99 | 43d | 1 | 1.29mi |
| 19031 Livernois Unit F Detroit, MI | 2.0 | 2.0 | 1100 | $2,135 | $1.94 | 43d | 1 | 1.35mi |
| 17530 Roselawn St Unit 1 Detroit, MI | 3.0 | 2.0 | 1600 | $2,000 | $1.25 | 24d | 1 | 1.36mi |
| 101 Stevens St Highland Park, MI | 3.0 | 1.5 | 1152 | $1,600 | $1.39 | 17d | 1 | 1.37mi |
| 17159 Northlawn St Unit 17161 Detroit, MI | 2.0 | 1.0 | 1122 | $975 | $0.87 | 4d | 1 | 1.39mi |
| 1926 Clements St Unit 1926 Detroit, MI | 3.0 | 1.0 | 1150 | $1,250 | $1.09 | 20d | 1 | 1.39mi |
| 1926 Clements St Detroit, MI | 3.0 | 1.0 | 1150 | $1,150 | $1.00 | 4d | 1 | 1.39mi |
Listing history 2 events
-
2026-06-17remarks 566-char remark
Show marketing remark (566 chars)
Amazing opportunity on this 2 bedroom, 1 full bath, 2 half baths brick residence combining classic Detroit character with fantastic upside. Boasting 1,346 square feet of comfortable living space, this home features a spacious layout, a spacious basement perfect for a recreation room or home office. Situated on a tree-lined street just blocks away from University District and the Avenue of Fashion, you are minutes from excellent local dining, shopping, and major commuter routes via the Lodge Freeway (M-10). Sold as is. Buyer and agent to verify all information.
-
2026-06-17$94,900 Active 1 DOM
Show marketing remark (566 chars)
Amazing opportunity on this 2 bedroom, 1 full bath, 2 half baths brick residence combining classic Detroit character with fantastic upside. Boasting 1,346 square feet of comfortable living space, this home features a spacious layout, a spacious basement perfect for a recreation room or home office. Situated on a tree-lined street just blocks away from University District and the Avenue of Fashion, you are minutes from excellent local dining, shopping, and major commuter routes via the Lodge Freeway (M-10). Sold as is. Buyer and agent to verify all information.
ⓘ Source: listings_history table (triggers on properties + properties_extension) + one-shot
backfill from property_details.listing_events for pre-trigger history.
Tax reassessment forecast MI · Partial reset (capped growth)
- Current annual tax
- $1,152 · $96/mo
- Projected year-2 tax
- $1,307 · $109/mo
- Expected delta
- +$154/yr (+$13/mo · 13.4%)
ⓘ Screening estimate from a state-policy table — verify with the county assessor before closing.
Climate risk First Street
- Flood 1/10 Low FEMA zone X (unshaded) · 0% chance over 30 yrs
- Wildfire 1/10 Low
- Heat 2/10 Low 7 d/yr ≥97°F today · 14 d/yr by 30 yrs out
- Wind 2/10 Low
- Air quality 4/10 Moderate 4 unhealthy d/yr today · 6 by 30 yrs out
Nearby sold comps map
Loading sold comps map…
Walkable amenities ~0.75 mi
Loading nearby amenities…
Taxation est. · year 1
- Rental income
- $16,146
- − Mortgage interest
- −$5,316
- − Property taxes
- −$1,152
- − Insurance
- −$474
- − Repairs & maintenance
- −$1,292
- − Management
- −$1,292
- − Depreciation
- −$2,761
- Taxable income
- $3,859
- Est. tax owed @ 24.0%
- −$926
- After-tax cash flow
- $4,230/yr
For passive investors: Depreciation is non-cash, so a rental often shows a tax loss while cash-flowing — sheltering income. Rental losses are passive: they offset passive income freely, and up to $25,000/yr can offset ordinary (W-2) income if you actively participate and your MAGI is under $100k (phasing out to $0 by $150k); unused losses carry forward. On sale, claimed depreciation is recaptured at up to 25%, and gains may owe capital-gains tax (a 1031 exchange can defer both). Figures are a year-1 estimate at your 24.0% rate — not tax advice; consult a CPA.
Schools (NCES district)
- District
- Detroit Public Schools Community District
- NCES district ID
- 2601103
- Math proficiency
- 10% ▼ -2.00%
- Reading proficiency
- 24% ▲ 6.00%
- Median HH income
- $25,815
- Composite
- 13.06/100
- National rank
- #9564
- State rank
- #499 of 540 in MI
Livability — Detroit
- Score
- 73/100
- State rank
- #218
- US rank
- #5427
Category grades
Schools grade is shown separately in the Schools card above.
Census & demographics
- Census place
- Detroit, MI
- County
- Wayne County · 1,562,939 people
- City population
- 572,865
- Metro
- Detroit-Warren-Dearborn, MI
- Population (ZIP)
- 41,392
- Household income
- $57,878
- Rent vs Own
- Severe rent burden
- 1646.0
Population outlook (Wayne County) Hauer SSP2
- Today (2025)
- 1,675,273 people
- By 2030
- 1,620,300 · -3.3%
- By 2040
- 1,502,341 · -10.3%
- By 2050
- 1,384,039 · -17.4%
- By 2075
- 1,124,592 · -32.9%
- By 2100
- 881,193 · -47.4%
Race, ethnicity, and origin ACS 2023
- Neighborhood character
- Predominantly Black (85%)
- Race & ethnicity
- Black 85% White 8% Two or more races 4% Asian 1%
- Common ancestry
- Romanian 1% Lithuanian 1%
- Foreign-born
- 2% · Canada
- Languages at home
- 97% English-only · Spanish 1% Other Indo-European 1%
Political lean MEDSL · Wayne
- 2024 margin
- Strong D (+29.0) · D 62.7% · R 33.7% · Other 3.6%
- 2008→2024 swing
- -20.5pp toward R · 2008: 49.5pp · 2024: 29.0pp
- All cycles
- 2024: D+29.0 2020: D+38.1 2016: D+37.3 2012: D+46.9 2008: D+49.5
Not yet ingested
- Civics
- —
Market trends
- HPI YoY
- ▼ -433.14%
- Current HPI
- 280.5434
- Rent YoY
- ▲ 3.44%
- Metro
- Detroit-Warren-Dearborn, MI
- State GDP YoY
- ▲ 1.37%
- F500 in state
- 28
Industry mix (Fortune 500 HQ in MI)
| Industry | F500 HQs | Revenue |
|---|---|---|
| Automotive Parts | 3 | $48B |
|
||
| Automotive | 2 | $372B |
|
||
| Chemicals | 1 | $45B |
|
||
| Automotive Retail | 1 | $29B |
|
||
| Healthcare / Medical Devices | 1 | $23B |
|
||
| Automotive Technology | 1 | $20B |
|
||
Price history
+0.0% since first listed2 events — show timeline
- 2026-06-17 Listed $94,900 REALCOMP
- 2026-06-17 Listed $94,900 MiRealSource-MiMLS
Property tax history
-5.5%/yrLatest (2025): $1,152 · -49.4% YoY. Source: county tax records.
Cash-flow waterfall
monthlySold comps — $/sqft
last 12 mo · ≤1 miLoading sold comps…