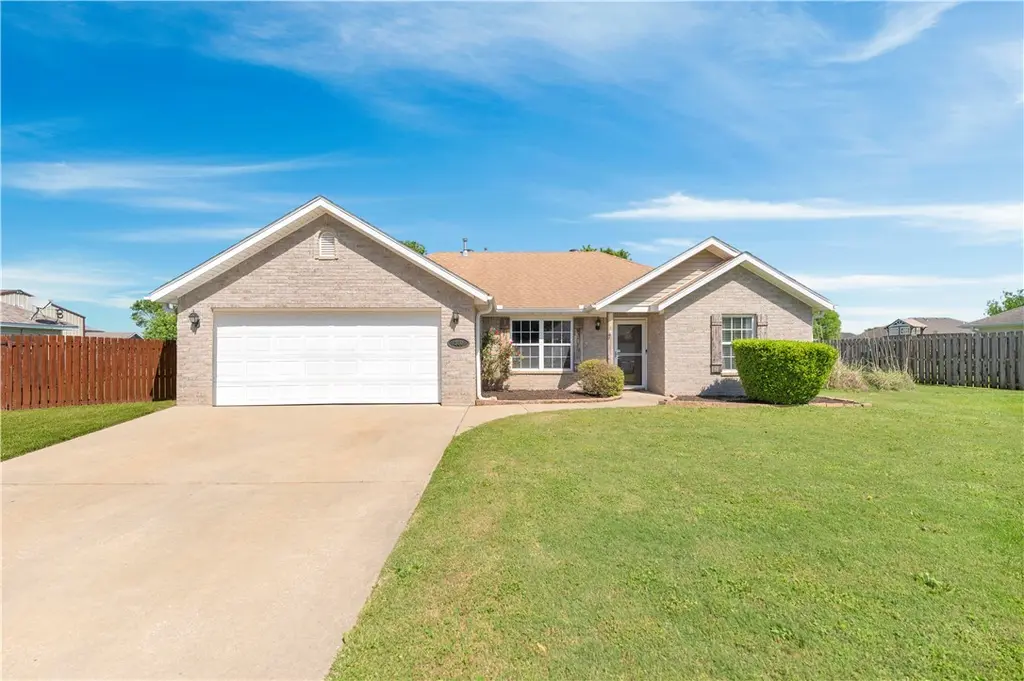
360 Benton Dr · Pea Ridge, AR
Flood risk 1/10 · Minimal
- FEMA flood zone
- X (unshaded)
- Chance of flooding over 30 yrs
- 0.0%
- Est. flood insurance / yr
- $507 – $1,088
Fire risk 5/10 · Moderate
- Est. fire insurance / yr
- $1,499 – $2,785
Heat risk 5/10 · Moderate
- Hot days now (above 105°F)
- 7 days/yr
- Hot days in 30 yrs
- 22 days/yr
Wind risk 2/10 · Minimal
- Chance of severe wind over 30 yrs
- 2.0%
Air-quality risk 2/10 · Minimal
- Unhealthy air days now
- 1 days/yr
- Unhealthy air days in 30 yrs
- 1 days/yr
Risk factors via First Street. Map © Google.
Why this score? — see what drove the D grade
The composite is a weighted blend of 9 inputs, each scored 0–100. Each bar is that input's sub-score; the figure is the points it added to the 100-point composite (weight × sub-score).
- Cash flow +9.0/30.0
- Appreciation +8.7/10.0
- ARV discount +8.0/15.0
- Schools +3.7/10.0
- Livability +3.4/5.0
- DSCR +2.5/10.0
- Rent growth +2.5/5.0
- Condition / age +2.5/5.0
- 1% rule +1.9/10.0
$265,000
🖨 Deal sheet (PDF) 📄 Offer letter ✓ Due diligence
Listing remarks MLS
A must see! Updated kitchen with new cabinets, granite and backsplash complete with new kitchen floor tile. This home has been improved, maintained and updated. Back yard has covered patio, raised gardens, storage shed and topped off with a new roof and gutters in 2018.
Key facts
- New water heater
- Updated flooring
- Fresh interior paint
Tags
Property features AI
Finance
- HOA & community: Monthly HOA/association fee; Nearby fire station; Sidewalks
Exterior
- Parking: Attached 2-car garage with garage door opener
- Utilities: Electricity available; Natural gas available; Public water; Public sewer
- Home design: Single-story home; Resale (less than 25 years old); Brick and vinyl siding exterior
- Construction: Architectural shingle roof; Slab foundation
- Exterior features: Concrete driveway; Patio; Cleared lot in a subdivision; Public road frontage
Interior
- Kitchen: Dishwasher; Electric oven; Microwave; Refrigerator; Plumbed for ice maker; Gas water heater
- Bedrooms: Three bedrooms on the main level (approx. 11 x 11, 11 x 10, 12 x 13)
- Flooring: Laminate; Simulated wood; Tile
- Bathrooms: Two full bathrooms on the main level
- Heating & cooling: Gas heating; Central air conditioning
- Interior features: Attic; Ceiling fans; Split bedroom layout; Storage; Double-pane windows
- Laundry & utility: Washer hookup; Dryer hookup
Neighborhood map
What this means for you Summary
Snapshot
- This is a 3-bed/2.0-bath single-family listed at $265k.
Deal economics
- At list price, monthly cash flow is $-207 ($-2k/yr) — negative.
- To cash-flow at today's rent, offer at most $228k (13.8% below list).
- To meet the 1% rule (rent ≥ 1% of price), the offer needs to be $184k (30.6% below list).
- Recommended offer: $184k (30.6% below list) — sets the bar for 1% rule.
- Cap rate 5.4% vs local median 3.5% in Pea Ridge — top-decile yield for the area; either an underpriced asset or a hidden risk that comps aren't pricing in. Stress-test before assuming the spread holds.
Location & tenants
- Location reads 67/100 on livability (#98 in AR) — a middle-class / working-renter tenant base. Strengths: employment A+, housing A+, cost of living A-; Watch: amenities F, commute F.
- Pea Ridge School District (suburban): math 43% / reading 42% proficiency, ranked #43 of 238 in AR (top 18%) — families likely to look elsewhere, expect single-tenant / working-renter base with shorter leases.
- Zoned schools: Pea Ridge Primary School (575 students, 36% FRL); Pea Ridge Middle School (math 47% / reading 42%, grade D, #61 of 201 statewide, top 32%, 395 students, 34% FRL); Pea Ridge High School (math 22% / reading 37%, grade F, #142 of 292 statewide, top 53%, 566 students, 24% FRL) — zoned schools at 31% FRL track the district average.
- Market conditions: 433 active listings in the ZIP; 26 comparable units currently listed for rent nearby; rentals at typical pace (median 23d on market — plan ~3-4 weeks tenant-placement turnaround); solid renter incomes; 4,359 units permitted in Benton County in 2024 (402 in 5+ unit buildings).
Forward outlook
- In year one you build about $22k of equity ($2k loan paydown + $20k appreciation (7.5% local appreciation)).
- Benton County population projected at +56% by 2050 — long-run rental-demand tailwind backs the buy-and-hold thesis.
- By year 2, paydown + projected appreciation supports a ~$35k cash-out refi (75% LTV) — recoverable capital for the next deal without selling this one.
Negotiation context
- Only 5 days on market — expect competitive offers; lowballing is unlikely to land.
- 2 sale attempts since 8y ago with the ask held roughly flat each time — persistent listings suggest the price (not the market) is what's stuck; bring a comps-based counter.
Risks & watch-outs
- Climate carrying-cost: moderate wildfire risk; extreme-heat days projected 7→22/yr by 2055 (HVAC capex compounding) — expect insurance premiums to compound above CPI over the hold.
Questions for the listing agent
- What do current leases actually rent for vs. the listed asking? Can we see a recent rent roll and the last 12 months of T-12 income?
- Is there a deadline driving the sale (1031 exchange, divorce, estate, relocation)? That informs how much negotiation room exists.
- The area grade is low — what's the realistic commute time and amenity access for the typical tenant pool here? Any planned neighborhood developments (good or bad) we should know about?
- What's the average days-on-market for RENTAL listings here right now (not sales)? A rising rental-DOM trend means longer vacancies and softer asking-rent achievability than the comps imply.
- What's the recent tenant-quality profile in this submarket — average credit score on applications, eviction rate, late-payment / NSF rate, and stable-employment percentage? A property-management company in the area should have these aggregated.
- How much new for-sale + rental construction is in the pipeline within 1–3 miles? Heavy new supply typically softens prices + rents 12–24 months out; constrained supply supports both.
Investment metrics
- 1% rule
- 0.69% ✗
- Cap rate
- 5.35%
- Cash-on-cash
- -3.35%
- DSCR
- 0.85
- GRM
- 12.0
CMA / ARV
- ARV (median comp)
- $268,095
- List price
- $265,000
- Delta
- -1.15%
- Verdict
- FAIR
- Comps
- 20 within 1.0 mi
Show comp detail 12 sales within ~0.75 mi
| Address | Dist | Beds/Ba | Sqft | Sold | Price | $/sf | Match |
|---|---|---|---|---|---|---|---|
| 360 Benton Dr | 0.00mi | 3/2.0 | 1,270 (+1%) | 1mo | $263,000 | $207 | 98 |
| 522 Lee Town Dr | 0.10mi | 2/1.5 (-1) | 1,284 (+2%) | 2mo | $246,900 | $192 | 83 |
| 940 Eagle Crest Dr | 0.36mi | 3/2.0 | 1,338 (+6%) | 1mo | $257,000 | $192 | 71 |
| 820 Eagle Crst | 0.29mi | 3/2.0 | 1,365 (+9%) | 7mo | $244,100 | $179 | 66 |
| 625 Eagle Crst | 0.16mi | 3/2.0 | 1,422 (+13%) | 8mo | $275,000 | $193 | 64 |
| 134 Mcculloch St | 0.67mi | 3/1.0 | 1,294 (+3%) | 1mo | $237,500 | $184 | 59 |
| 339 Davis St | 0.26mi | 4/1.5 (+1) | 1,431 (+14%) | 2mo | $220,000 | $154 | 56 |
| 173 Watie St | 0.52mi | 2/1.0 (-1) | 1,222 (-3%) | 9mo | $217,000 | $178 | 55 |
| 106 Henry Little Cir | 0.49mi | 3/1.5 | 1,410 (+12%) | 1mo | $275,000 | $195 | 54 |
| 311 S Curtis Ave | 0.54mi | 3/1.0 | 1,104 (-12%) | 0mo | $224,900 | $204 | 50 |
| 1051 Asboth St | 0.69mi | 2/1.5 (-1) | 1,392 (+11%) | 5mo | $215,000 | $154 | 38 |
| 296 Van Dorn St | 0.74mi | 3/2.0 | 1,432 (+14%) | 7mo | $242,500 | $169 | 37 |
Match score weights: distance 35% · size 25% · config 20% · recency 20%. Top-matched comps best support the ARV.
Projected returns pro-forma
7.48% appreciation · 3.0% rent growth · sell at horizon
- IRR
- 16.2%
- Equity multiple
- 2.17×
- Total profit
- $87,094
- Equity at exit
- $191,970
- IRR
- 15.8%
- Equity multiple
- 4.54×
- Total profit
- $262,318
- Equity at exit
- $372,465
Cash invested: $74,200 (down + closing). Projections, not guarantees.
Landlord ↔ Tenant lean methodology
- Overall (STATE)
- 92 Strongly Landlord-Friendly
- State Arkansas
- 92 Strongly Landlord-Friendly · R+14
- County
- — inherits STATE
- City
- — inherits STATE
ZIP-level market 72751
- Home prices YoY
- 2.2%
- Active inventory
- 433
- Price-to-rent
- 12.0×
Monthly cashflow live
- Estimated rent
- $1,839 high interval (Pro) →
- Mortgage (P&I)
- −$1,390
- Tax from tax record
- −$160 /mo · $1,920/yr
- Insurance
- −$110
- HOA
- −$0
- Vacancy / Maint / Mgmt
- −$386
- Net cashflow
- $-207
Break-even live
Sensitivity live
| Price | -10% $-57 | -5% $-132 | +0% $-207 | +5% $-282 | +10% $-357 |
|---|---|---|---|---|---|
| Rent | -10% $-353 | -5% $-280 | +0% $-207 | +5% $-135 | +10% $-62 |
| Rate | -1.0pp $-74 | -0.5pp $-140 | base $-207 | +0.5pp $-276 | +1.0pp $-346 |
UW: 25.0% down · 7.5% · 30yr · 1.5% tax · 5.0% vac · 8.0% maint · 8.0% mgmt
Financing live
Cash to close
- Down payment
- $66,250
- Closing costs
- $7,950
- Reserves months
- —
- Total cash needed
- —
Loan-product check · same deal, 3 products live
Conventional
25% down · 7.5% · 30yr
- Down + closing
- —
- Monthly P&I
- —
- Monthly cashflow
- —
- DSCR
- —
- Eligible?
- —
Personal DTI + credit; lowest rate.
DSCR
20% down · 8.5% · 30yr
- Down + closing
- —
- Monthly P&I
- —
- Monthly cashflow
- —
- DSCR
- —
- Eligible?
- —
No personal income docs; deal must DSCR.
Hard money
10% down · 12.0% · 12mo
- Down + closing
- —
- Monthly P&I
- —
- Monthly cashflow
- —
- DSCR
- —
- Eligible?
- —
Short-term bridge; refi at stabilization.
Rent comps 26 comps
| Address | Beds | Baths | Sqft | Rent | $/sqft | DOM | Units | Dist |
|---|---|---|---|---|---|---|---|---|
| 890 Choate Place Cir Pea Ridge, AR | 3.0 | 2.0 | 1820 | $1,900 | $1.04 | 45d | 1 | 0.15mi |
| 585 Lynn Dr Pea Ridge, AR | 3.0 | 2.0 | 1804 | $1,650 | $0.91 | 45d | 1 | 0.65mi |
| 200 Ryan Rd Pea Ridge, AR | 1.0–2.0 | 1.0–2.0 | 895 | $1,405 | $1.57 | 16d | 18 | 0.71mi |
| 1808 Edwards St Pea Ridge, AR | 4.0 | 2.0 | 1660 | $2,025 | $1.22 | 16d | 1 | 1.08mi |
| 521 W Pickens Rd Pea Ridge, AR | 3.0 | 2.5 | 1500 | $1,600 | $1.07 | 16d | 1 | 1.11mi |
| 533 W Pickens Rd Pea Ridge, AR | 3.0 | 2.5 | 1500 | $1,600 | $1.07 | 16d | 1 | 1.12mi |
| 547 W Pickens Rd Pea Ridge, AR | 3.0 | 2.5 | 1500 | $1,600 | $1.07 | 16d | 1 | 1.13mi |
| 1902 Edwards St Pea Ridge, AR | 3.0 | 2.0 | 1674 | $2,025 | $1.21 | 16d | 1 | 1.13mi |
| 575 W Pickens Rd Pea Ridge, AR | 3.0 | 2.5 | 1500 | $1,600 | $1.07 | 45d | 1 | 1.14mi |
| 581 W Pickens Rd Pea Ridge, AR | 3.0 | 2.5 | 1500 | $1,600 | $1.07 | 45d | 1 | 1.14mi |
| 112 Alder St Pea Ridge, AR | 3.0 | 2.0 | 1350 | $1,625 | $1.20 | 46d | 1 | 1.17mi |
| 308 Alder St Pea Ridge, AR | 3.0 | 2.0 | 1425 | $1,625 | $1.14 | 45d | 1 | 1.20mi |
| 308 Alder St Pea Ridge, AR | 3.0 | 2.0 | 1425 | $1,625 | $1.14 | 25d | 1 | 1.20mi |
| 1713 Cuppett Cir Pea Ridge, AR | 3.0 | 2.5 | 1503 | $1,650 | $1.10 | 25d | 1 | 1.27mi |
| 1711 Cuppett Cir Pea Ridge, AR | 3.0 | 2.5 | 1604 | $1,750 | $1.09 | 25d | 1 | 1.28mi |
| 536 Lewis St Pea Ridge, AR | 3.0 | 2.0 | 1649 | $1,995 | $1.21 | 23d | 1 | 1.30mi |
| 1703 Booker Cir Pea Ridge, AR | 3.0 | 2.0 | 1056 | $1,525 | $1.44 | 16d | 1 | 1.33mi |
| 1914 Booker Cir Pea Ridge, AR | 2.0 | 2.0 | 1052 | $1,525 | $1.45 | 23d | 1 | 1.35mi |
| 1400 Hickery St Pea Ridge, AR | 3.0 | 2.0 | 1400 | $1,700 | $1.21 | 23d | 1 | 1.35mi |
| 801 Lewis St Pea Ridge, AR | 3.0 | 2.0 | 1744 | $2,000 | $1.15 | 15d | 1 | 1.35mi |
| 1393 Hutchinson St Pea Ridge, AR | 3.0 | 2.0 | 1580 | $1,675 | $1.06 | 45d | 1 | 1.37mi |
| 1723 Booker Cir Pea Ridge, AR | 3.0 | 2.0 | 1056 | $1,650 | $1.56 | 25d | 1 | 1.39mi |
| 1803 Booker Cir Pea Ridge, AR | 3.0 | 2.0 | 1056 | $1,525 | $1.44 | 16d | 1 | 1.40mi |
| 1801 Booker Cir Pea Ridge, AR | 3.0 | 2.0 | 1056 | $1,525 | $1.44 | 45d | 1 | 1.40mi |
| 1735 Booker Cir Pea Ridge, AR | 3.0 | 2.0 | 1056 | $1,525 | $1.44 | 23d | 1 | 1.41mi |
| 645 Sugar Creek Rd Pea Ridge, AR | 3.0 | 2.5 | 1800 | $1,600 | $0.89 | 16d | 1 | 1.47mi |
Listing history 5 events
-
2026-05-16status Pending 491-char remark
-
2026-05-06$265,000 Active 491-char remark
-
2019-01-14soldstatus $146,000
-
2019-01-10soldstatus $146,000 270-char remark
Show marketing remark (270 chars)
A must see! Updated kitchen with new cabinets, granite and backsplash complete with new kitchen floor tile. This home has been improved, maintained and updated. Back yard has covered patio, raised gardens, storage shed and topped off with a new roof and gutters in 2018.
-
2018-09-10$146,000 270-char remark
Show marketing remark (270 chars)
A must see! Updated kitchen with new cabinets, granite and backsplash complete with new kitchen floor tile. This home has been improved, maintained and updated. Back yard has covered patio, raised gardens, storage shed and topped off with a new roof and gutters in 2018.
ⓘ Source: listings_history table (triggers on properties + properties_extension) + one-shot
backfill from property_details.listing_events for pre-trigger history.
Tax reassessment forecast AR · Resets to sale price
- Current annual tax
- $1,920 · $160/mo
- Projected year-2 tax
- $1,920 · $160/mo
- Expected delta
- $0/yr ($0/mo · 0.0%)
ⓘ Screening estimate from a state-policy table — verify with the county assessor before closing.
Climate risk First Street
- Flood 1/10 Low FEMA zone X (unshaded) · 0% chance over 30 yrs
- Wildfire 5/10 Major
- Heat 5/10 Major 7 d/yr ≥105°F today · 22 d/yr by 30 yrs out
- Wind 2/10 Low 2% chance of damaging wind over 30 yrs
- Air quality 2/10 Low 1 unhealthy d/yr today · 1 by 30 yrs out
Nearby sold comps map
Loading sold comps map…
Walkable amenities ~0.75 mi
Loading nearby amenities…
Taxation est. · year 1
- Rental income
- $22,069
- − Mortgage interest
- −$14,844
- − Property taxes
- −$1,920
- − Insurance
- −$1,325
- − Repairs & maintenance
- −$1,766
- − Management
- −$1,766
- − Depreciation
- −$7,709
- Taxable loss
- −$7,260
- Est. tax savings @ 24.0%
- +$1,742
- After-tax cash flow
- $-744/yr
For passive investors: Depreciation is non-cash, so a rental often shows a tax loss while cash-flowing — sheltering income. Rental losses are passive: they offset passive income freely, and up to $25,000/yr can offset ordinary (W-2) income if you actively participate and your MAGI is under $100k (phasing out to $0 by $150k); unused losses carry forward. On sale, claimed depreciation is recaptured at up to 25%, and gains may owe capital-gains tax (a 1031 exchange can defer both). Figures are a year-1 estimate at your 24.0% rate — not tax advice; consult a CPA.
Schools (NCES district)
- District
- Pea Ridge School District
- NCES district ID
- 0503030
- Math proficiency
- 43% ▼ -3.00%
- Reading proficiency
- 42% ▼ -8.00%
- Median HH income
- $53,156
- Composite
- 36.88/100
- National rank
- #4546
- State rank
- #43 of 238 in AR
Livability — Pea Ridge
- Score
- 67/100
- State rank
- #98
- US rank
- #10429
Category grades
Schools grade is shown separately in the Schools card above.
Census & demographics
- Census place
- Pea Ridge, AR
- County
- Benton County · 259,241 people
- City population
- 9,997
- Metro
- Fayetteville-Springdale-Rogers, AR
- Population (ZIP)
- 9,997
- Household income
- $95,299
- Rent vs Own
- Severe rent burden
- 83.0
Population outlook (Benton County) Hauer SSP2
- Today (2025)
- 318,683 people
- By 2030
- 353,481 · +10.9%
- By 2040
- 425,280 · +33.4%
- By 2050
- 497,239 · +56.0%
- By 2075
- 662,114 · +107.8%
- By 2100
- 776,431 · +143.6%
Race, ethnicity, and origin ACS 2023
- Neighborhood character
- Predominantly White (72%)
- Race & ethnicity
- White 72% Two or more races 17% Hispanic / Latino 7% Black 3%
- Hispanic origin (detail)
- Mexican 5%
- Common ancestry
- Slovak 4% Scottish 2% Lithuanian 2%
- Foreign-born
- 7% · Canada, Vietnam
- Languages at home
- 97% English-only · Spanish 2% Vietnamese 1%
Political lean MEDSL · Benton
- 2024 margin
- Strong R (+27.0) · D 35.2% · R 62.1% · Other 2.7%
- 2008→2024 swing
- +9.6pp toward D · 2008: -36.5pp · 2024: -27.0pp
- All cycles
- 2024: R+27.0 2020: R+26.4 2016: R+34.9 2012: R+40.4 2008: R+36.5
Not yet ingested
- Civics
- —
Market trends
- HPI YoY
- ▲ 7.48%
- Current HPI
- 352.7133
- Rent YoY
- —
- Metro
- Fayetteville-Springdale-Rogers, AR
- State GDP YoY
- ▲ 3.80%
- F500 in state
- 10
Industry mix (Fortune 500 HQ in AR)
| Industry | F500 HQs | Revenue |
|---|---|---|
| Retail | 1 | $681B |
|
||
| Food / Agriculture | 1 | $53B |
|
||
| Retail / Energy | 1 | $22B |
|
||
| Transportation / Logistics | 1 | $12B |
|
||
| Energy | 1 | $4B |
|
||
Price history
+80.1% since first listed6 events — show timeline
- 2026-06-05 Sold (MLS) $263,000 NWARMLS
- 2026-05-16 Pending — NWARMLS
- 2026-05-06 Listed $265,000 NWARMLS
- 2019-01-14 Sold (Public Records) $146,000 Public Records
- 2019-01-10 Sold (MLS) $146,000 NWARMLS
- 2018-09-10 Listed $146,000 NWARMLS
Property tax history
+9.9%/yrLatest (2025): $1,920 · +10.7% YoY. Source: county tax records.
Cash-flow waterfall
monthlySold comps — $/sqft
last 12 mo · ≤1 miLoading sold comps…