4026 Milano Rd · Panama City, FL
Flood risk 8/10 · Major
- FEMA flood zone
- X (unshaded)
- Chance of flooding over 30 yrs
- 0.99%
- Est. flood insurance / yr
- $507 – $1,088
Fire risk 1/10 · Minimal
- Est. fire insurance / yr
- $947 – $1,759
Heat risk 10/10 · Severe
- Hot days now (above 104°F)
- 7 days/yr
- Hot days in 30 yrs
- 22 days/yr
Wind risk 9/10 · Severe
- Chance of severe wind over 30 yrs
- 99.0%
Air-quality risk 1/10 · Minimal
- Unhealthy air days now
- 0 days/yr
- Unhealthy air days in 30 yrs
- 0 days/yr
Risk factors via First Street. Map © Google.
Why this score? — see what drove the D grade
The composite is a weighted blend of 9 inputs, each scored 0–100. Each bar is that input's sub-score; the figure is the points it added to the 100-point composite (weight × sub-score).
- ARV discount +15.0/15.0
- Cash flow +10.3/30.0
- Schools +4.3/10.0
- Livability +3.6/5.0
- DSCR +3.0/10.0
- Rent growth +2.8/5.0
- 1% rule +2.7/10.0
- Condition / age +2.5/5.0
- Appreciation +0.0/10.0
$279,000
🖨 Deal sheet (PDF) 📄 Offer letter ✓ Due diligence
Listing remarks MLS
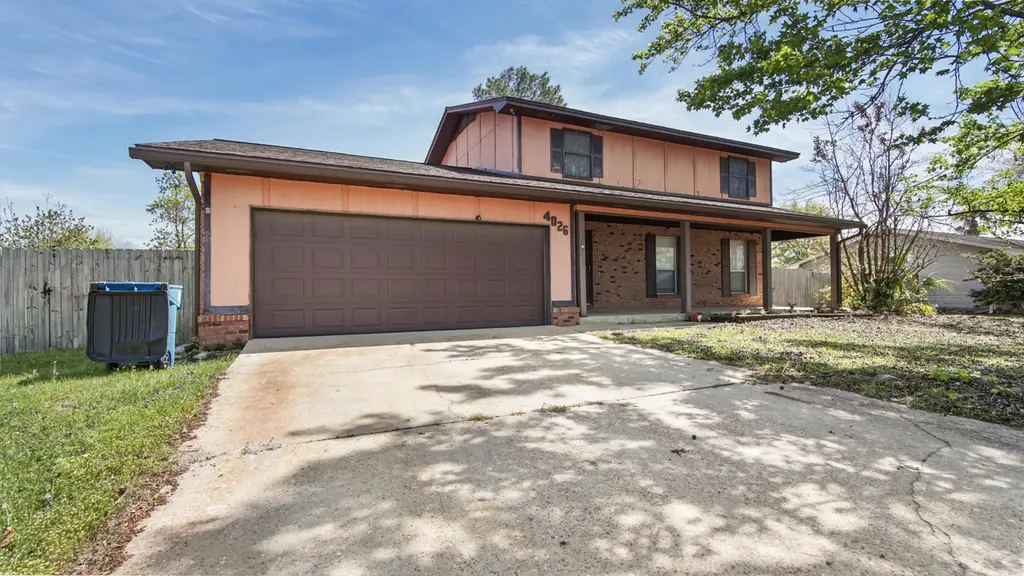
Spacious two-story home located in the established Venetian Villa neighborhood in central Panama City. This 4-bedroom, 2.5-bath home offers approximately 2,130 heated and cooled square feet with a functional floor plan that includes a sunken family room with fireplace, formal dining area, and multiple living spaces. The layout features the main living areas on the first floor and all bedrooms on the second floor, providing separation and flexibility for everyday living. The property sits on a generous residential lot with a fenced backyard and attached garage. Conveniently located near schools, shopping, restaurants, and major roadways, this home offers a great opportunity for buyers looking for space and the chance to personalize a property in a well-established neighborhood.
Key facts
- Sunken family room
- Two story home
- Fenced backyard
Tags
Neighborhood map
What this means for you Summary
Snapshot
- This is a 4-bed/3.0-bath single-family listed at $279k.
Deal economics
- At list price, monthly cash flow is $-220 ($-3k/yr) — negative.
- To cash-flow at today's rent, offer at most $240k (13.9% below list).
- To meet the 1% rule (rent ≥ 1% of price), the offer needs to be $214k (23.2% below list).
- Recommended offer: $214k (23.2% below list) — sets the bar for 1% rule.
Location & tenants
- Location reads 72/100 on livability (#350 in FL) — a middle-class / working-renter tenant base. Strengths: cost of living A+, housing A+, health & safety A+; Watch: crime F, amenities F, commute F.
- Bay (suburban): math 51% / reading 51% proficiency, ranked #29 of 73 in FL (top 40%) — acceptable for families but not a draw, mixed tenant base, ~2y average lease.
- Zoned schools: Northside Elementary School (math 49% / reading 45%, grade D-, #1,191 of 2,144 statewide, top 57%, 598 students, 59% FRL); Mowat Middle School (math 49% / reading 51%, grade C, #254 of 571 statewide, top 45%, 868 students, 49% FRL); A. Crawford Mosley High School (math 51% / reading 55%, grade C-, #148 of 667 statewide, top 23%, 1,901 students, 36% FRL) — zoned schools at 48% FRL track the district average.
- Market conditions: Rents rising (+1.2%/yr); 380 active listings in the ZIP; 5 comparable units currently listed for rent nearby; rentals at typical pace (median 16d on market — plan ~3-4 weeks tenant-placement turnaround); 2,473 units permitted in Bay County in 2024 (559 in 5+ unit buildings).
- This rent runs 35% of the median local income ($73k/yr) — at the standard rent-burdened threshold; future hikes will face affordability resistance.
Forward outlook
- Local home prices are declining (-3.0%/yr); year-one equity from $2k of loan paydown is wiped out by about $8k of value loss. Plan a longer hold.
- Bay County population projected at +24% by 2050 — long-run rental-demand tailwind backs the buy-and-hold thesis.
Negotiation context
- It's been on market 71 days — a 6% lower offer ($262k) is reasonable based on typical stale-listing flexibility.
- 3 sale attempts since 28y ago with the ask held roughly flat each time — persistent listings suggest the price (not the market) is what's stuck; bring a comps-based counter.
Risks & watch-outs
- Watch-outs: flood insurance adds $66/mo.
- Climate carrying-cost: severe flood risk; severe wind risk, 99% chance of damaging wind over 30y; extreme-heat days projected 7→22/yr by 2055 (HVAC capex compounding) — expect insurance premiums to compound above CPI over the hold.
Questions for the listing agent
- What do current leases actually rent for vs. the listed asking? Can we see a recent rent roll and the last 12 months of T-12 income?
- It's been on market 71 days. Have you received any prior offers? Is the seller open to a 23% concession, seller financing, or rate buy-down credit?
- Built in 1978 — when were the roof, HVAC, electrical panel, plumbing, and water heater last replaced?
- What's the actual annual flood-insurance premium (NFIP or private), and is the property in a SFHA with mandatory coverage?
- Why hasn't it sold? Are there any deal-killer items the seller is aware of (foundation, flood, title, zoning, code violations)?
- Is there a deadline driving the sale (1031 exchange, divorce, estate, relocation)? That informs how much negotiation room exists.
- Schools are B-rated — typically a magnet for longer-tenancy family renters. What's the average tenant stay here, and is there a school-zone premium baked into asking?
- Crime grade is F in this area — have there been break-ins, vandalism, or insurance claims at this property in the last 3 years? What carrier currently insures it and at what premium?
- The area grade is low — what's the realistic commute time and amenity access for the typical tenant pool here? Any planned neighborhood developments (good or bad) we should know about?
- What's the average days-on-market for RENTAL listings here right now (not sales)? A rising rental-DOM trend means longer vacancies and softer asking-rent achievability than the comps imply.
- What's the recent tenant-quality profile in this submarket — average credit score on applications, eviction rate, late-payment / NSF rate, and stable-employment percentage? A property-management company in the area should have these aggregated.
- How much new for-sale + rental construction is in the pipeline within 1–3 miles? Heavy new supply typically softens prices + rents 12–24 months out; constrained supply supports both.
Investment metrics
- 1% rule
- 0.77% ✗
- Cap rate
- 5.63%
- Cash-on-cash
- -2.36%
- DSCR
- 0.90
- GRM
- 10.9
CMA / ARV
- ARV (median comp)
- $364,790
- List price
- $279,000
- Delta
- -23.52%
- Verdict
- UNDERPRICED
- Comps
- 20 within 1.0 mi
Show comp detail 12 sales within ~0.75 mi
| Address | Dist | Beds/Ba | Sqft | Sold | Price | $/sf | Match |
|---|---|---|---|---|---|---|---|
| 3922 Milano Rd | 0.17mi | 4/3.0 | 2,330 (+5%) | 6mo | $290,000 | $124 | 78 |
| 4411 Baywood Dr | 0.46mi | 4/2.0 | 2,247 (+1%) | 2mo | $390,000 | $174 | 70 |
| 4326 Schooner Ln | 0.32mi | 4/2.5 | 2,016 (-9%) | 4mo | $505,000 | $250 | 65 |
| 4005 Leeann Cir | 0.26mi | 4/2.0 | 1,940 (-12%) | 2mo | $370,000 | $191 | 62 |
| 3906 Napoli Rd | 0.26mi | 5/3.0 (+1) | 2,472 (+12%) | 3mo | $280,000 | $113 | 61 |
| 4050 Mary Kathryn Circle Cir | 0.29mi | 4/2.5 | 2,538 (+15%) | 6mo | $450,000 | $177 | 55 |
| 903 Kristanna Dr | 0.18mi | 3/2.0 (-1) | 1,901 (-14%) | 7mo | $380,000 | $200 | 53 |
| 3903 Becora Ct | 0.29mi | 3/2.0 (-1) | 1,945 (-12%) | 8mo | $355,000 | $183 | 51 |
| 4617 Schooner Ln | 0.66mi | 4/2.5 | 2,386 (+8%) | 5mo | $850,000 | $356 | 50 |
| 4011 Mary Louise Dr | 0.50mi | 4/3.0 | 2,534 (+14%) | 6mo | $525,000 | $207 | 48 |
| 157 Candlewick Cir | 0.56mi | 4/2.5 | 2,533 (+14%) | 0mo | $510,000 | $201 | 47 |
| 502 Candlewick Dr | 0.69mi | 4/2.0 | 2,500 (+13%) | 1mo | $525,000 | $210 | 42 |
Match score weights: distance 35% · size 25% · config 20% · recency 20%. Top-matched comps best support the ARV.
Projected returns pro-forma
-3.0% appreciation · 1.24% rent growth · sell at horizon
- IRR
- -23.9%
- Equity multiple
- 0.19×
- Total profit
- $-62,921
- Equity at exit
- $41,600
- IRR
- -24.6%
- Equity multiple
- -0.12×
- Total profit
- $-87,501
- Equity at exit
- $24,123
Cash invested: $78,120 (down + closing). Projections, not guarantees.
Landlord ↔ Tenant lean methodology
- Overall (STATE)
- 87 Strongly Landlord-Friendly
- State Florida
- 87 Strongly Landlord-Friendly · R+3
- County
- — inherits STATE
- City
- — inherits STATE
ZIP-level market 32405
- Rents YoY
- 1.2%
- Active inventory
- 380
- Price-to-rent
- 10.9×
Monthly cashflow live
- Estimated rent
- $2,143 high interval (Pro) →
- Mortgage (P&I)
- −$1,463
- Tax from tax record
- −$267 /mo · $3,202/yr
- Insurance
- −$116
- Flood insurance flood zone
- −$66 /mo · $798/yr
- HOA
- −$0
- Lot rent
- −$0
- Vacancy / Maint / Mgmt
- −$450
- Net cashflow
- $-220
Break-even live
Sensitivity live
| Price | -10% $-62 | -5% $-141 | +0% $-220 | +5% $-299 | +10% $-378 |
|---|---|---|---|---|---|
| Rent | -10% $-389 | -5% $-305 | +0% $-220 | +5% $-135 | +10% $-51 |
| Rate | -1.0pp $-79 | -0.5pp $-149 | base $-220 | +0.5pp $-292 | +1.0pp $-366 |
UW: 25.0% down · 7.5% · 30yr · 1.5% tax · 5.0% vac · 8.0% maint · 8.0% mgmt
Financing live
Cash to close
- Down payment
- $69,750
- Closing costs
- $8,370
- Reserves months
- —
- Total cash needed
- —
Loan-product check · same deal, 3 products live
Conventional
25% down · 7.5% · 30yr
- Down + closing
- —
- Monthly P&I
- —
- Monthly cashflow
- —
- DSCR
- —
- Eligible?
- —
Personal DTI + credit; lowest rate.
DSCR
20% down · 8.5% · 30yr
- Down + closing
- —
- Monthly P&I
- —
- Monthly cashflow
- —
- DSCR
- —
- Eligible?
- —
No personal income docs; deal must DSCR.
Hard money
10% down · 12.0% · 12mo
- Down + closing
- —
- Monthly P&I
- —
- Monthly cashflow
- —
- DSCR
- —
- Eligible?
- —
Short-term bridge; refi at stabilization.
Rent comps 5 comps
| Address | Beds | Baths | Sqft | Rent | $/sqft | DOM | Units | Dist |
|---|---|---|---|---|---|---|---|---|
| 1345 Capri Dr Panama City, FL | 3.0 | 2.5 | 1572 | $1,925 | $1.22 | 15d | 1 | 0.17mi |
| 604 Mallory Dr Panama City, FL | 3.0 | 2.0 | 1799 | $2,500 | $1.39 | 15d | 1 | 0.46mi |
| 3938 Solano Rd Unit 3938 Panama City, FL | 3.0 | 2.5 | 1450 | $1,800 | $1.24 | 23d | 1 | 0.72mi |
| 3900 Arbor Trace Dr Lynn Haven, FL | 2.0–3.0 | 2.0 | 1520 | $1,854 | $1.22 | 15d | 34 | 0.88mi |
| 1117 Blazing Star St Panama City, FL | 3.0 | 2.0 | 1800 | $2,500 | $1.39 | 23d | 1 | 1.13mi |
Listing history 15 events
-
2026-06-21days on market $279,000 Active 71 DOM
-
2026-06-19days on market $279,000 Active 69 DOM
-
2026-06-18days on market $279,000 Active 68 DOM
-
2026-06-17days on market $279,000 Active 67 DOM
-
2026-06-16days on market $279,000 Active 66 DOM
-
2026-06-15days on market $279,000 Active 65 DOM
-
2026-06-14days on market $279,000 Active 63 DOM
-
2026-06-13days on market $279,000 Active 62 DOM
-
2026-06-10days on market $279,000 Active 60 DOM
-
2026-06-09days on market $279,000 Active 59 DOM
-
2026-06-09pricestatusdays on market $279,000 Active 58 DOM
-
2026-03-11$289,000 Active 787-char remark
Show marketing remark (787 chars)
Spacious two-story home located in the established Venetian Villa neighborhood in central Panama City. This 4-bedroom, 2.5-bath home offers approximately 2,130 heated and cooled square feet with a functional floor plan that includes a sunken family room with fireplace, formal dining area, and multiple living spaces. The layout features the main living areas on the first floor and all bedrooms on the second floor, providing separation and flexibility for everyday living. The property sits on a generous residential lot with a fenced backyard and attached garage. Conveniently located near schools, shopping, restaurants, and major roadways, this home offers a great opportunity for buyers looking for space and the chance to personalize a property in a well-established neighborhood.
-
2021-12-14historical
-
1998-09-15$116,900
ⓘ Source: listings_history table (triggers on properties + properties_extension) + one-shot
backfill from property_details.listing_events for pre-trigger history.
Tax reassessment forecast FL · Resets to sale price
- Current annual tax
- $3,202 · $267/mo
- Projected year-2 tax
- $3,202 · $267/mo
- Expected delta
- $0/yr ($0/mo · 0.0%)
ⓘ Screening estimate from a state-policy table — verify with the county assessor before closing.
Climate risk First Street
- Flood 8/10 Severe FEMA zone X (unshaded) · 99% chance over 30 yrs
- Wildfire 1/10 Low
- Heat 10/10 Extreme 7 d/yr ≥104°F today · 22 d/yr by 30 yrs out
- Wind 9/10 Extreme 99% chance of damaging wind over 30 yrs
- Air quality 1/10 Low 0 unhealthy d/yr today · 0 by 30 yrs out
Nearby sold comps map
Loading sold comps map…
Walkable amenities ~0.75 mi
Loading nearby amenities…
Taxation est. · year 1
- Rental income
- $25,713
- − Mortgage interest
- −$15,628
- − Property taxes
- −$3,202
- − Insurance
- −$2,192
- − Repairs & maintenance
- −$2,057
- − Management
- −$2,057
- − Depreciation
- −$8,116
- Taxable loss
- −$7,540
- Est. tax savings @ 24.0%
- +$1,810
- After-tax cash flow
- $-829/yr
For passive investors: Depreciation is non-cash, so a rental often shows a tax loss while cash-flowing — sheltering income. Rental losses are passive: they offset passive income freely, and up to $25,000/yr can offset ordinary (W-2) income if you actively participate and your MAGI is under $100k (phasing out to $0 by $150k); unused losses carry forward. On sale, claimed depreciation is recaptured at up to 25%, and gains may owe capital-gains tax (a 1031 exchange can defer both). Figures are a year-1 estimate at your 24.0% rate — not tax advice; consult a CPA.
Schools (NCES district)
- District
- Bay
- NCES district ID
- 1200090
- Math proficiency
- 51% ▼ -8.00%
- Reading proficiency
- 51% ▼ -7.00%
- Median HH income
- $47,740
- Composite
- 43.41/100
- National rank
- #3014
- State rank
- #29 of 73 in FL
Livability — Panama City
- Score
- 72/100
- State rank
- #350
- US rank
- #5823
Category grades
Schools grade is shown separately in the Schools card above.
Census & demographics
- Census place
- Panama City, FL
- County
- Bay County · 163,593 people
- City population
- 91,445
- Metro
- Panama City, FL
- Population (ZIP)
- 29,984
- Household income
- $73,373
- Rent vs Own
- Severe rent burden
- 1008.0
Population outlook (Bay County) Hauer SSP2
- Today (2025)
- 206,264 people
- By 2030
- 217,740 · +5.6%
- By 2040
- 238,738 · +15.7%
- By 2050
- 255,545 · +23.9%
- By 2075
- 288,295 · +39.8%
- By 2100
- 288,638 · +39.9%
Race, ethnicity, and origin ACS 2023
- Neighborhood character
- Predominantly White (67%)
- Race & ethnicity
- White 67% Black 17% Two or more races 8% Hispanic / Latino 7% Native American 1%
- Hispanic origin (detail)
- Mexican 2% Puerto Rican 3%
- Common ancestry
- Slovak 4% Lithuanian 2% Romanian 2%
- Foreign-born
- 7% · Canada
- Languages at home
- 89% English-only · Spanish 6% Arabic 1% French/Haitian/Cajun 1%
Political lean MEDSL · Bay
- 2024 margin
- Solid R (+47.4) · D 25.8% · R 73.1% · Other 1.1%
- 2008→2024 swing
- -6.6pp toward R · 2008: -40.7pp · 2024: -47.4pp
- All cycles
- 2024: R+47.4 2020: R+43.5 2016: R+46.3 2012: R+43.6 2008: R+40.7
Not yet ingested
- Civics
- —
Market trends
- HPI YoY
- ▼ -217.88%
- Current HPI
- 262.7854
- Rent YoY
- ▲ 1.24%
- Metro
- Panama City, FL
- State GDP YoY
- ▲ 3.28%
- F500 in state
- 36
Industry mix (Fortune 500 HQ in FL)
| Industry | F500 HQs | Revenue |
|---|---|---|
| Industrial Technology | 2 | $29B |
|
||
| Insurance | 2 | $17B |
|
||
| Retail | 1 | $60B |
|
||
| Technology Distribution | 1 | $58B |
|
||
| Homebuilding | 1 | $35B |
|
||
| Technology Manufacturing | 1 | $35B |
|
||
Price history
+147.2% since first listed4 events — show timeline
- 2026-03-11 Listed $289,000 ECAR
- 2026-03-11 Listed $289,000 CPARMLS
- 2021-12-14 Listing Removed — CPARMLS
- 1998-09-15 Listed $116,900 CPARMLS
Property tax history
+3.6%/yrLatest (2025): $3,202 · +7.0% YoY. Source: county tax records.
Cash-flow waterfall
monthlySold comps — $/sqft
last 12 mo · ≤1 miLoading sold comps…