 🔨 Auction
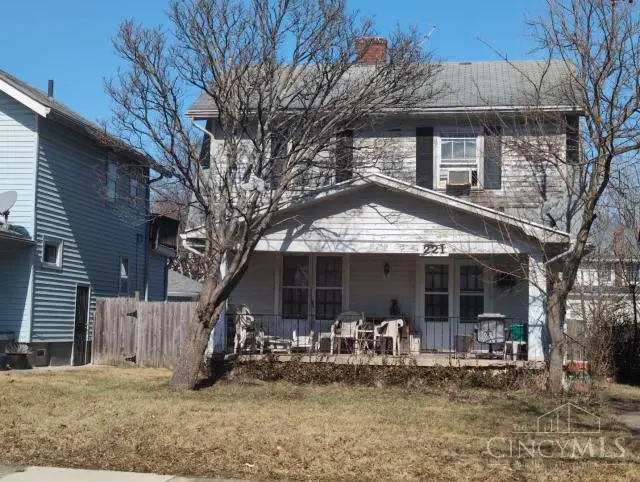
221 W Norman Ave · Dayton, OH
Flood risk 1/10 · Minimal
- FEMA flood zone
- X (unshaded)
- Chance of flooding over 30 yrs
- 0.0%
- Est. flood insurance / yr
- $473 – $860
Fire risk 1/10 · Minimal
- Est. fire insurance / yr
- $713 – $1,323
Heat risk 3/10 · Minor
- Hot days now (above 104°F)
- 7 days/yr
- Hot days in 30 yrs
- 17 days/yr
Wind risk 2/10 · Minimal
- Chance of severe wind over 30 yrs
- —
Air-quality risk 3/10 · Minor
- Unhealthy air days now
- 2 days/yr
- Unhealthy air days in 30 yrs
- 4 days/yr
Risk factors via First Street. Map © Google.
Why this score? — see what drove the C+ grade
The composite is a weighted blend of 9 inputs, each scored 0–100. Each bar is that input's sub-score; the figure is the points it added to the 100-point composite (weight × sub-score).
- Cash flow +27.1/30.0
- DSCR +9.4/10.0
- ARV discount +7.5/15.0
- 1% rule +7.4/10.0
- Rent growth +3.6/5.0
- Livability +3.2/5.0
- Condition / age +2.5/5.0
- Schools +1.3/10.0
- Appreciation +0.0/10.0
$1
🖨 Deal sheet 📄 Offer letter ✓ Due diligence
Listing remarks MLS
Court Ordered Sale by Private Selling Officer. Plaintiff postponed auction until April 30, 2026. All information we have on the property is included. We have no additional information, property condition is unknown. NO SHOWINGS, NO trespassing for any reason. Information is thought to be correct but not guaranteed. 10% Buyer Premium added to the high bid, $5,000 deposit is due within 24 hours of bidding end.
Key facts
- 4,609 sq ft lot
- Garage
- Built 1925
Neighborhood map
What this means for you Summary
Snapshot
- This is a 3-bed/1.0-bath single-family listed at $1.
Deal economics
- At list price, monthly cash flow is $262 ($3k/yr) — positive.
- The deal already cash-flows at list — no discount required.
- Meets the 1% rule at list price ($1k rent vs $1).
- Cap rate 9.7% vs local median 7.4% in Dayton — top-decile yield for the area; either an underpriced asset or a hidden risk that comps aren't pricing in. Stress-test before assuming the spread holds.
Location & tenants
- Location reads 65/100 on livability (#716 in OH) — a middle-class / working-renter tenant base. Strengths: cost of living A+, housing A+, health & safety A; Watch: schools C-, amenities C-, crime F.
- Dayton City (urban): math 12% / reading 21% proficiency, ranked #641 of 656 in OH (top 98%) — low school quality limits family demand, transient renter base, plan for 1-2y turnover; 74% free/reduced lunch — lower-income household profile, screen leases tightly.
- Market conditions: Rents rising fast (+4.3%/yr); 134 active listings in the ZIP; 40 comparable units currently listed for rent nearby; rentals lingering (median 44d on market — plan ~5-8 weeks vacancy on turnover, expect pricing pressure); 55% of comp listings sitting > 30 days — soft ceiling on asking rent; lower-income renter base — watch delinquency; 907 units permitted in Montgomery County in 2024 (416 in 5+ unit buildings).
- This rent runs 31% of the median local income ($44k/yr) — at the standard rent-burdened threshold; future hikes will face affordability resistance.
Forward outlook
- Local home prices are declining (-3.0%/yr); year-one equity from $637 of loan paydown is wiped out by about $3k of value loss. Plan a longer hold.
- Montgomery County population projected at -10% by 2050 — secular population decline; favor cash flow + early exit over multi-decade hold.
- At projected returns (-3.0% appreciation + 4.3% rent growth), your $26k cash investment doubles in ~9 years — after that, you're playing with house money.
Negotiation context
- It's been on market 57 days — a 3% lower offer ($0) is reasonable based on typical stale-listing flexibility.
Risks & watch-outs
- Watch-outs: property tax is 138159.2% of price; built in 1925 — expect roof / HVAC / electrical / plumbing capex.
Questions for the listing agent
- It's been on market 57 days. Have you received any prior offers? Is the seller open to a 5% concession, seller financing, or rate buy-down credit?
- Built in 1925 — when were the roof, HVAC, electrical panel, plumbing, and water heater last replaced?
- Property tax is high relative to price — has the assessment been appealed recently, and will the sale trigger a re-assessment?
- Is there a deadline driving the sale (1031 exchange, divorce, estate, relocation)? That informs how much negotiation room exists.
- Crime grade is F in this area — have there been break-ins, vandalism, or insurance claims at this property in the last 3 years? What carrier currently insures it and at what premium?
- What's the average days-on-market for RENTAL listings here right now (not sales)? A rising rental-DOM trend means longer vacancies and softer asking-rent achievability than the comps imply.
- What's the recent tenant-quality profile in this submarket — average credit score on applications, eviction rate, late-payment / NSF rate, and stable-employment percentage? A property-management company in the area should have these aggregated.
- How much new for-sale + rental construction is in the pipeline within 1–3 miles? Heavy new supply typically softens prices + rents 12–24 months out; constrained supply supports both.
Investment metrics
- 1% rule
- 1.24% ✓
- Cap rate
- 9.71%
- Cash-on-cash
- 12.20%
- DSCR
- 1.54
- GRM
- 6.7
CMA / ARV
- ARV (median comp)
- $92,106
- List price
- $1
- Delta
- -100.00%
- Verdict
- UNDERPRICED
- Comps
- 20 within 1.0 mi
Show comp detail 12 sales within ~0.75 mi
| Address | Dist | Beds/Ba | Sqft | Sold | Price | $/sf | Match |
|---|---|---|---|---|---|---|---|
| 117 Valleyview Dr | 0.22mi | 2/1.0 (-1) | 1,381 (+3%) | 1mo | $50,000 | $36 | 80 |
| 17 Marie Ave | 0.09mi | 4/1.5 (+1) | 1,424 (+6%) | 0mo | $70,000 | $49 | 79 |
| 2032 Rugby Rd | 0.37mi | 3/1.0 | 1,422 (+6%) | 0mo | $44,990 | $32 | 73 |
| 50 Woodcrest Ave | 0.21mi | 3/1.0 | 1,500 (+12%) | 2mo | $155,000 | $103 | 70 |
| 69 E Beechwood Ave | 0.55mi | 3/1.0 | 1,400 (+4%) | 1mo | $173,000 | $124 | 67 |
| 423 Sandalwood Dr | 0.45mi | 3/1.5 | 1,444 (+7%) | 0mo | $62,000 | $43 | 64 |
| 148 Valleyview Dr | 0.26mi | 3/1.0 | 1,163 (-14%) | 2mo | $125,000 | $107 | 64 |
| 121 E Hillcrest Ave | 0.62mi | 3/1.0 | 1,402 (+4%) | 1mo | $75,000 | $53 | 63 |
| 128 E Parkwood Dr | 0.52mi | 3/1.0 | 1,228 (-9%) | 1mo | $29,810 | $24 | 61 |
| 2331 Newport Ave | 0.46mi | 3/1.5 | 1,520 (+13%) | 1mo | $85,000 | $56 | 54 |
| 819 Princeton Dr | 0.62mi | 3/1.0 | 1,181 (-12%) | 1mo | $74,000 | $63 | 50 |
| 1516 Kumler Ave | 0.66mi | 3/1.5 | 1,516 (+13%) | 1mo | $100,000 | $66 | 46 |
Match score weights: distance 35% · size 25% · config 20% · recency 20%. Top-matched comps best support the ARV.
Projected returns pro-forma
-3.0% appreciation · 4.34% rent growth · sell at horizon
- IRR
- 3.3%
- Equity multiple
- 1.13×
- Total profit
- $3,346
- Equity at exit
- $13,733
- IRR
- 14.1%
- Equity multiple
- 2.20×
- Total profit
- $31,040
- Equity at exit
- $7,964
Cash invested: $25,790 (down + closing). Projections, not guarantees.
Landlord ↔ Tenant lean methodology
- Overall (STATE)
- 73 Landlord-Friendly
- State Ohio
- 73 Landlord-Friendly · R+6
- County
- — inherits STATE
- City
- — inherits STATE
ZIP-level market 45405
- Rents YoY
- 4.3%
- Active inventory
- 134
Monthly cashflow live
- Estimated rent
- $1,138 high interval (Pro) →
- Mortgage (P&I)
- −$483
- Tax est. 1.5%
- −$115 /mo · $1,382/yr
- Insurance
- −$38
- HOA
- −$0
- Vacancy / Maint / Mgmt
- −$239
- Net cashflow
- $262
Break-even live
UW: 25.0% down · 7.5% · 30yr · 1.5% tax · 5.0% vac · 8.0% maint · 8.0% mgmt
Financing live
Cash to close
- Down payment
- $23,027
- Closing costs
- $2,763
- Reserves months
- —
- Total cash needed
- —
Loan-product check · same deal, 3 products live
Conventional
25% down · 7.5% · 30yr
- Down + closing
- —
- Monthly P&I
- —
- Monthly cashflow
- —
- DSCR
- —
- Eligible?
- —
Personal DTI + credit; lowest rate.
DSCR
20% down · 8.5% · 30yr
- Down + closing
- —
- Monthly P&I
- —
- Monthly cashflow
- —
- DSCR
- —
- Eligible?
- —
No personal income docs; deal must DSCR.
Hard money
10% down · 12.0% · 12mo
- Down + closing
- —
- Monthly P&I
- —
- Monthly cashflow
- —
- DSCR
- —
- Eligible?
- —
Short-term bridge; refi at stabilization.
Rent comps 40 comps
| Address | Beds | Baths | Sqft | Rent | $/sqft | DOM | Units | Dist |
|---|---|---|---|---|---|---|---|---|
| 201 W Norman Ave Dayton, OH | 3.0 | 1.0 | 1424 | $1,200 | $0.84 | 43d | 1 | 0.02mi |
| 181 W Norman Ave Dayton, OH | 3.0 | 2.0 | 1228 | $1,150 | $0.94 | 43d | 1 | 0.05mi |
| 167 W Hudson Ave Dayton, OH | 3.0 | 1.5 | 1344 | $1,185 | $0.88 | 43d | 1 | 0.10mi |
| 412 W Parkwood Dr Unit 1 Dayton, OH | 2.0 | 1.0 | 900 | $875 | $0.97 | 23d | 1 | 0.19mi |
| 101 W Norman Ave Unit 101 Dayton, OH | 3.0 | 1.0 | 1600 | $945 | $0.59 | 43d | 1 | 0.20mi |
| 439 W Fairview Ave Dayton, OH | 3.0 | 1.0 | 1500 | $1,200 | $0.80 | 43d | 1 | 0.20mi |
| 234 Santa Clara Ave Dayton, OH | 3.0 | 1.0 | 1368 | $1,125 | $0.82 | 43d | 1 | 0.26mi |
| 41 W Fairview Ave Unit 2 Dayton, OH | 3.0 | 1.0 | 1452 | $1,200 | $0.83 | 14d | 1 | 0.28mi |
| 628 W Norman Ave Unit 628 Dayton, OH | 2.0 | 1.0 | 918 | $795 | $0.87 | 43d | 1 | 0.31mi |
| 2327 N Main St Unit 2 Dayton, OH | 2.0 | 1.0 | 900 | $1,200 | $1.33 | 23d | 1 | 0.33mi |
| 265 Victor Ave Dayton, OH | 3.0 | 1.0 | 1204 | $900 | $0.75 | 43d | 1 | 0.34mi |
| 26 W Beechwood Ave Dayton, OH | 3.0 | 1.5 | 1468 | $1,050 | $0.72 | 43d | 1 | 0.43mi |
| 31 E Norman Ave Dayton, OH | 3.0 | 1.0 | 1100 | $1,150 | $1.05 | 23d | 1 | 0.44mi |
| 2333 Rustic Rd Unit 4 Dayton, OH | 2.0 | 1.0 | 1000 | $840 | $0.84 | 2d | 1 | 0.47mi |
| 2333 Rustic Rd Dayton, OH | 2.0 | 1.0 | 1000 | $840 | $0.84 | 43d | 1 | 0.47mi |
| 1743 Radcliffe Rd Dayton, OH | 3.0 | 1.5 | 1729 | $1,200 | $0.69 | 43d | 1 | 0.48mi |
| 518 Delaware Ave Dayton, OH | 2.0 | 1.0 | 1500 | $750 | $0.50 | 43d | 1 | 0.50mi |
| 147 Laura Ave Dayton, OH | 2.0 | 1.0 | 1096 | $975 | $0.89 | 23d | 1 | 0.55mi |
| 152 Laura Ave Dayton, OH | 2.0 | 1.0 | 990 | $895 | $0.90 | 43d | 1 | 0.55mi |
| 1004 W Fairview Ave Dayton, OH | 2.0 | 1.0 | 1053 | $950 | $0.90 | 23d | 1 | 0.59mi |
| 39 E Maplewood Ave Dayton, OH | 4.0 | 1.5 | 1560 | $1,050 | $0.67 | 3d | 1 | 0.60mi |
| 1019 Cherry Dr Dayton, OH | 4.0 | 1.0 | 1057 | $1,125 | $1.06 | 43d | 1 | 0.60mi |
| 2232 Salem Ave Dayton, OH | 3.0 | 1.0 | 1250 | $1,200 | $0.96 | 3d | 1 | 0.61mi |
| 65 E Maplewood Ave Dayton, OH | 2.0 | 1.0 | 1064 | $723 | $0.68 | 43d | 1 | 0.62mi |
| 2247 Salem Ave Unit 2247 Dayton, OH | 3.0 | 1.5 | 1300 | $1,350 | $1.04 | 3d | 1 | 0.62mi |
| 2247 Salem Ave Unit 2249 Dayton, OH | 3.0 | 1.5 | 1300 | $1,400 | $1.08 | 43d | 1 | 0.62mi |
| 38 Pointview Ave Dayton, OH | 2.0 | 1.0 | 1140 | $900 | $0.79 | 14d | 1 | 0.63mi |
| 42 Pointview Ave Unit 42 Dayton, OH | 3.0 | 2.0 | 1240 | $1,200 | $0.97 | 3d | 1 | 0.63mi |
| 1067 Salem Ave Dayton, OH | 2.0 | 1.0 | 1100 | $900 | $0.82 | 43d | 1 | 0.64mi |
| 1067 Salem Ave Unit 3 Dayton, OH | 2.0 | 1.5 | 1100 | $900 | $0.82 | 43d | 1 | 0.64mi |
| 1067 Salem Ave Unit 2 Dayton, OH | 2.0 | 1.5 | 1100 | $900 | $0.82 | 43d | 1 | 0.64mi |
| 1225 Amherst Pl Dayton, OH | 3.0 | 1.0 | 1548 | $1,300 | $0.84 | 14d | 1 | 0.68mi |
| 1207 W Fairview Ave Dayton, OH | 2.0 | 1.0 | 1023 | $825 | $0.81 | 43d | 1 | 0.71mi |
| 1207 W Fairview Ave Dayton, OH | 2.0 | 1.0 | 1023 | $825 | $0.81 | 3d | 1 | 0.71mi |
| 338 Kenwood Ave Dayton, OH | 3.0 | 1.5 | 1512 | $1,195 | $0.79 | 43d | 1 | 0.74mi |
| 220 Fernwood Ave Dayton, OH | 2.0 | 1.0 | 884 | $900 | $1.02 | 3d | 1 | 0.78mi |
| 1927 Burroughs Dr Dayton, OH | 3.0 | 2.0 | 1409 | $1,245 | $0.88 | 14d | 1 | 0.79mi |
| 1378 Cory Dr Dayton, OH | 2.0 | 1.0 | 1300 | $975 | $0.75 | 43d | 1 | 0.79mi |
| 101 E Bruce Ave Dayton, OH | 3.0 | 1.0 | 1455 | $1,150 | $0.79 | 2d | 1 | 0.81mi |
| 942 Harvard Blvd Dayton, OH | 3.0 | 2.0 | 1596 | $1,200 | $0.75 | 3d | 1 | 0.82mi |
Listing history 20 events
-
2026-06-18days on market $1 Active 57 DOM
-
2026-06-17days on market $1 Active 56 DOM
-
2026-06-16days on market $1 Active 55 DOM
-
2026-06-15days on market $1 Active 54 DOM
-
2026-06-14days on market $1 Active 52 DOM
-
2026-06-13days on market $1 Active 51 DOM
-
2026-06-10days on market $1 Active 49 DOM
-
2026-06-09days on market $1 Active 48 DOM
-
2026-06-08days on market $1 Active 47 DOM
-
2026-06-07days on market $1 Active 46 DOM
-
2026-06-05days on market $1 Active 43 DOM
-
2026-06-03days on market $1 Active 42 DOM
-
2026-06-02days on market $1 Active 41 DOM
-
2026-06-01days on market $1 Active 40 DOM
-
2026-05-31days on market $1 Active 39 DOM
-
2026-04-22$1 Active 411-char remark
Show marketing remark (411 chars)
Court Ordered Sale by Private Selling Officer. Plaintiff postponed auction until April 30, 2026. All information we have on the property is included. We have no additional information, property condition is unknown. NO SHOWINGS, NO trespassing for any reason. Information is thought to be correct but not guaranteed. 10% Buyer Premium added to the high bid, $5,000 deposit is due within 24 hours of bidding end.
-
2004-04-26soldstatus $70,000
-
1999-05-25soldstatus $59,600
-
1988-09-12soldstatus $21,100
-
1985-03-04soldstatus $12,500
ⓘ Source: listings_history table (triggers on properties + properties_extension) + one-shot
backfill from property_details.listing_events for pre-trigger history.
Climate risk First Street
- Flood 1/10 Low FEMA zone X (unshaded) · 0% chance over 30 yrs
- Wildfire 1/10 Low
- Heat 3/10 Moderate 7 d/yr ≥104°F today · 17 d/yr by 30 yrs out
- Wind 2/10 Low
- Air quality 3/10 Moderate 2 unhealthy d/yr today · 4 by 30 yrs out
Nearby sold comps map
Loading sold comps map…
Walkable amenities ~0.75 mi
Loading nearby amenities…
Taxation est. · year 1
- Rental income
- $13,651
- − Mortgage interest
- −$5,159
- − Property taxes
- −$1,382
- − Insurance
- −$461
- − Repairs & maintenance
- −$1,092
- − Management
- −$1,092
- − Depreciation
- −$2,679
- Taxable income
- $1,786
- Est. tax owed @ 24.0%
- −$429
- After-tax cash flow
- $2,718/yr
For passive investors: Depreciation is non-cash, so a rental often shows a tax loss while cash-flowing — sheltering income. Rental losses are passive: they offset passive income freely, and up to $25,000/yr can offset ordinary (W-2) income if you actively participate and your MAGI is under $100k (phasing out to $0 by $150k); unused losses carry forward. On sale, claimed depreciation is recaptured at up to 25%, and gains may owe capital-gains tax (a 1031 exchange can defer both). Figures are a year-1 estimate at your 24.0% rate — not tax advice; consult a CPA.
Schools (NCES district)
- District
- Dayton City
- NCES district ID
- 3904384
- Math proficiency
- 12% ▼ -12.00%
- Reading proficiency
- 21% ▼ -11.00%
- Median HH income
- $28,688
- Composite
- 12.94/100
- National rank
- #9579
- State rank
- #641 of 656 in OH
Livability — Dayton
- Score
- 65/100
- State rank
- #716
- US rank
- #12895
Category grades
Schools grade is shown separately in the Schools card above.
Census & demographics
- Census place
- Dayton, OH
- County
- Montgomery County · 459,541 people
- City population
- 164,387
- Metro
- Dayton-Kettering, OH
- Population (ZIP)
- 18,955
- Household income
- $43,973
- Rent vs Own
- Severe rent burden
- 1475.0
Population outlook (Montgomery County) Hauer SSP2
- Today (2025)
- 523,241 people
- By 2030
- 514,948 · -1.6%
- By 2040
- 493,378 · -5.7%
- By 2050
- 469,639 · -10.2%
- By 2075
- 418,360 · -20.0%
- By 2100
- 353,315 · -32.5%
Race, ethnicity, and origin ACS 2023
- Neighborhood character
- Predominantly Black (68%)
- Race & ethnicity
- Black 68% White 23% Two or more races 7% Hispanic / Latino 3%
- Common ancestry
- Italian 1% Slovak 1%
- Foreign-born
- 3% · Canada
- Languages at home
- 95% English-only · Spanish 2% French/Haitian/Cajun 1%
Political lean MEDSL · Montgomery
- 2024 margin
- Toss-up / Even · D 49.8% · R 49.3%
- 2008→2024 swing
- -5.8pp toward R · 2008: 6.2pp · 2024: 0.5pp
- All cycles
- 2024: D+0.5 2020: D+2.2 2016: R+1.2 2012: D+3.1 2008: D+6.2
Not yet ingested
- Civics
- —
Market trends
- HPI YoY
- ▼ -125.58%
- Current HPI
- 173.4962
- Rent YoY
- ▲ 4.34%
- Metro
- Dayton-Kettering, OH
- State GDP YoY
- ▲ 1.98%
- F500 in state
- 48
Industry mix (Fortune 500 HQ in OH)
| Industry | F500 HQs | Revenue |
|---|---|---|
| Insurance | 3 | $145B |
|
||
| Industrial Machinery | 3 | $49B |
|
||
| Financial Services | 3 | $24B |
|
||
| Consumer Goods | 2 | $93B |
|
||
| Aerospace / Defense | 2 | $47B |
|
||
| Utilities | 2 | $33B |
|
||
Price history
+460.0% since first listed5 events — show timeline
- 2026-04-22 Listed $1 Cincy MLS
- 2004-04-26 Sold (Public Records) $70,000 Public Records
- 1999-05-25 Sold (Public Records) $59,600 Public Records
- 1988-09-12 Sold (Public Records) $21,100 Public Records
- 1985-03-04 Sold (Public Records) $12,500 Public Records
Property tax history
+1.9%/yrLatest (2025): $283 · -55.1% YoY. Source: county tax records.
Cash-flow waterfall
monthlySold comps — $/sqft
last 12 mo · ≤1 miLoading sold comps…