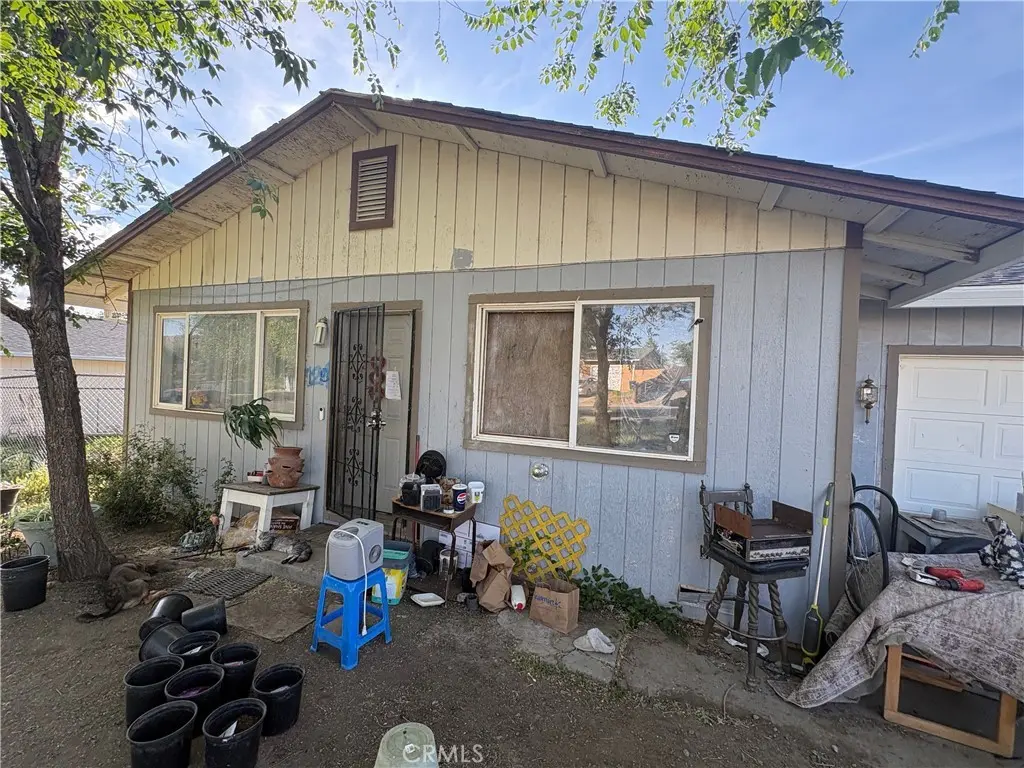
120 E Buel St · Montague, CA
Flood risk 1/10 · Minimal
- FEMA flood zone
- X (unshaded)
- Chance of flooding over 30 yrs
- 0.0%
- Est. flood insurance / yr
- $507 – $1,088
Fire risk 7/10 · Major
- Est. fire insurance / yr
- $659 – $1,223
Heat risk 6/10 · Moderate
- Hot days now (above 98°F)
- 7 days/yr
- Hot days in 30 yrs
- 15 days/yr
Wind risk 1/10 · Minimal
- Chance of severe wind over 30 yrs
- —
Air-quality risk 10/10 · Severe
- Unhealthy air days now
- 29 days/yr
- Unhealthy air days in 30 yrs
- 31 days/yr
Risk factors via First Street. Map © Google.
Why this score? — see what drove the C+ grade
The composite is a weighted blend of 9 inputs, each scored 0–100. Each bar is that input's sub-score; the figure is the points it added to the 100-point composite (weight × sub-score).
- Cash flow +22.4/30.0
- ARV discount +15.0/15.0
- DSCR +7.2/10.0
- 1% rule +5.2/10.0
- Schools +3.9/10.0
- Livability +3.0/5.0
- Rent growth +2.5/5.0
- Condition / age +2.5/5.0
- Appreciation +0.0/10.0
$126,000
🖨 Deal sheet (PDF) 📄 Offer letter ✓ Due diligence
Listing remarks MLS
Contractor’s special! Investor and flipper opportunity located in a quiet residential neighborhood with strong upside potential for renovation, resale, or long-term rental income. The home features an open floor plan with 3 bedrooms and 1.5 bathrooms, plus a monitor heater and wood stove for heating. Garage was converted into an additional bedroom; permit status is unknown. Property will require repairs and updating, making it ideal for investors, contractors, or buyers looking to build sweat equity. With the right vision and improvements, this property could become a charming residence or profitable investment. Established neighborhood, functional layout, and value-add potential make this a project worth considering. Buyer to verify all information including permits, square footage, and condition of property. NOTE: The accuracy of this information is deemed reliable but is not guaranteed and should be independently verified.
Key facts
- Open floor plan
- Wood stove
- Converted garage
Tags
Property features AI
Finance
- Other: Property condition listed as fixer/major repairs needed; Single unit residence; No ADU
- HOA & community: Community offers biking, hiking, and urban amenities
Exterior
- Parking: Garage with front entry and single door; Driveway (gravel and paved access via city streets)
- Utilities: Public/district water; Public sewer (connected); Standard electric (connected); Telephone in street
- Home design: House (single family); Single-story; Entry at main floor; R-1 zoning
- Construction: Wood construction; Composition roof; Concrete perimeter foundation; Built year per public records
- Exterior features: Back yard with lawn; Lot is level/flat; Partial wood and wire fencing; Patio (none specified); Has view
Interior
- Kitchen: Laminate countertops; Water heater unit
- Bedrooms: Three main-level bedrooms; All bedrooms on main floor; Main floor primary bedroom
- Flooring: See remarks
- Bathrooms: Two main-level bathrooms; One full bath with bathtub; One quarter bath with shower-in-tub
- Heating & cooling: Wood-burning fireplace; Free-standing fireplace in family room; Wall/window cooling
- Interior features: Laminate counters; Insulated doors; Casement windows; One-level home; Main-floor entry
- Laundry & utility: Dedicated laundry room; Washer hookup; Electric dryer hookup
Neighborhood map
What this means for you Summary
Snapshot
- This is a 3-bed/1.5-bath single-family listed at $126k.
Deal economics
- At list price, monthly cash flow is $210 ($3k/yr) — positive.
- The deal already cash-flows at list — no discount required.
- Meets the 1% rule at list price ($1k rent vs $126k).
- Recommended offer: $124k (1.5% below list) — sets the bar for market timing.
Location & tenants
- Location reads 60/100 on livability (#577 in CA) — a middle-class / working-renter tenant base. Strengths: housing A+, cost of living B; Watch: crime D+, schools D, employment D.
- Yreka Union High (town): math 25% / reading 65% proficiency, ranked #630 of 1,400 in CA (top 45%) — families likely to look elsewhere, expect single-tenant / working-renter base with shorter leases.
- Market conditions: 136 active listings in the ZIP; 50 units permitted in Siskiyou County in 2024 (0 in 5+ unit buildings).
Forward outlook
- Local home prices are declining (-3.0%/yr); year-one equity from $871 of loan paydown is wiped out by about $4k of value loss. Plan a longer hold.
- Siskiyou County population projected at -26% by 2050 — secular population decline; favor cash flow + early exit over multi-decade hold.
Negotiation context
- It's been on market 29 days — a 2% lower offer ($124k) is reasonable based on typical stale-listing flexibility.
- 2 sale attempts with the ask held roughly flat each time — persistent listings suggest the price (not the market) is what's stuck; bring a comps-based counter.
Risks & watch-outs
- Climate carrying-cost: major wildfire risk; extreme-heat days projected 7→15/yr by 2055 (HVAC capex compounding) — expect insurance premiums to compound above CPI over the hold.
Questions for the listing agent
- Is there a deadline driving the sale (1031 exchange, divorce, estate, relocation)? That informs how much negotiation room exists.
- Schools are D-rated, which usually means shorter tenancies and higher turnover. Who's the typical renter profile here, and what's been the actual vacancy rate?
- Crime grade is D in this area — have there been break-ins, vandalism, or insurance claims at this property in the last 3 years? What carrier currently insures it and at what premium?
- What's the average days-on-market for RENTAL listings here right now (not sales)? A rising rental-DOM trend means longer vacancies and softer asking-rent achievability than the comps imply.
- What's the recent tenant-quality profile in this submarket — average credit score on applications, eviction rate, late-payment / NSF rate, and stable-employment percentage? A property-management company in the area should have these aggregated.
- How much new for-sale + rental construction is in the pipeline within 1–3 miles? Heavy new supply typically softens prices + rents 12–24 months out; constrained supply supports both.
Investment metrics
- 1% rule
- 1.02% ✓
- Cap rate
- 8.29%
- Cash-on-cash
- 7.15%
- DSCR
- 1.32
- GRM
- 8.2
CMA / ARV
- ARV (on-the-fly)
- $188,760
- Comps found
- 8
Show comp detail 8 sales within ~0.75 mi
| Address | Dist | Beds/Ba | Sqft | Sold | Price | $/sf | Match |
|---|---|---|---|---|---|---|---|
| 714 E Prather St | 0.04mi | 3/1.5 | 1,100 (-4%) | 13mo | $235,000 | $214 | 81 |
| 755 E Spiers St | 0.07mi | 3/2.0 | 1,178 (+3%) | 22mo | $193,000 | $164 | 72 |
| 760 E Spiers St | 0.10mi | 3/2.0 | 1,288 (+13%) | 2mo | $265,000 | $206 | 71 |
| 320 S 9th St | 0.52mi | 3/1.0 | 1,167 (+2%) | 10mo | $175,000 | $150 | 62 |
| 651 N 9th St | 0.53mi | 3/2.0 | 1,208 (+6%) | 4mo | $194,500 | $161 | 60 |
| 246 Ridgeview Dr | 0.25mi | 3/2.0 | 1,310 (+14%) | 8mo | $315,000 | $240 | 56 |
| 151 S 12th St | 0.64mi | 3/2.0 | 1,152 (+1%) | 16mo | $190,000 | $165 | 53 |
| 120 S 12th St | 0.67mi | 3/1.0 | 1,200 (+5%) | 7mo | $148,000 | $123 | 53 |
Match score weights: distance 35% · size 25% · config 20% · recency 20%. Top-matched comps best support the ARV.
Projected returns pro-forma
-3.0% appreciation · 3.0% rent growth · sell at horizon
- IRR
- -5.4%
- Equity multiple
- 0.80×
- Total profit
- $-7,054
- Equity at exit
- $18,787
- IRR
- 4.3%
- Equity multiple
- 1.31×
- Total profit
- $11,005
- Equity at exit
- $10,894
Cash invested: $35,280 (down + closing). Projections, not guarantees.
Landlord ↔ Tenant lean methodology
- Overall (STATE)
- 18 Strongly Tenant-Friendly
- State California
- 18 Strongly Tenant-Friendly · D+13
- County
- — inherits STATE
- City
- — inherits STATE
ZIP-level market 96064
- Active inventory
- 136
- Price-to-rent
- 8.2×
Monthly cashflow live
- Estimated rent
- $1,284 medium interval (Pro) →
- Mortgage (P&I)
- −$661
- Tax from tax record
- −$91 /mo · $1,094/yr
- Insurance
- −$52
- HOA
- −$0
- Vacancy / Maint / Mgmt
- −$270
- Net cashflow
- $210
Break-even live
Sensitivity live
| Price | -10% $281 | -5% $246 | +0% $210 | +5% $174 | +10% $139 |
|---|---|---|---|---|---|
| Rent | -10% $109 | -5% $159 | +0% $210 | +5% $261 | +10% $312 |
| Rate | -1.0pp $274 | -0.5pp $242 | base $210 | +0.5pp $177 | +1.0pp $144 |
UW: 25.0% down · 7.5% · 30yr · 1.5% tax · 5.0% vac · 8.0% maint · 8.0% mgmt
Financing live
Cash to close
- Down payment
- $31,500
- Closing costs
- $3,780
- Reserves months
- —
- Total cash needed
- —
Loan-product check · same deal, 3 products live
Conventional
25% down · 7.5% · 30yr
- Down + closing
- —
- Monthly P&I
- —
- Monthly cashflow
- —
- DSCR
- —
- Eligible?
- —
Personal DTI + credit; lowest rate.
DSCR
20% down · 8.5% · 30yr
- Down + closing
- —
- Monthly P&I
- —
- Monthly cashflow
- —
- DSCR
- —
- Eligible?
- —
No personal income docs; deal must DSCR.
Hard money
10% down · 12.0% · 12mo
- Down + closing
- —
- Monthly P&I
- —
- Monthly cashflow
- —
- DSCR
- —
- Eligible?
- —
Short-term bridge; refi at stabilization.
Listing history 17 events
-
2026-06-19days on market $126,000 Active 29 DOM
-
2026-06-18days on market $126,000 Active 28 DOM
-
2026-06-17days on market $126,000 Active 27 DOM
-
2026-06-16days on market $126,000 Active 26 DOM
-
2026-06-15days on market $126,000 Active 25 DOM
-
2026-06-14days on market $126,000 Active 23 DOM
-
2026-06-12days on market $126,000 Active 22 DOM
-
2026-06-09days on market $126,000 Active 19 DOM
-
2026-06-08days on market $126,000 Active 18 DOM
-
2026-06-07days on market $126,000 Active 17 DOM
-
2026-06-04days on market $126,000 Active 13 DOM
-
2026-06-02days on market $126,000 Active 12 DOM
-
2026-06-01days on market $126,000 Active 11 DOM
-
2026-05-31days on market $126,000 Active 10 DOM
-
2026-05-31days on market $126,000 Active 9 DOM
-
2026-05-21$126,000 Active
-
2026-05-20$126,000 Active 945-char remark
Show marketing remark (945 chars)
Contractor’s special! Investor and flipper opportunity located in a quiet residential neighborhood with strong upside potential for renovation, resale, or long-term rental income. The home features an open floor plan with 3 bedrooms and 1.5 bathrooms, plus a monitor heater and wood stove for heating. Garage was converted into an additional bedroom; permit status is unknown. Property will require repairs and updating, making it ideal for investors, contractors, or buyers looking to build sweat equity. With the right vision and improvements, this property could become a charming residence or profitable investment. Established neighborhood, functional layout, and value-add potential make this a project worth considering. Buyer to verify all information including permits, square footage, and condition of property. NOTE: The accuracy of this information is deemed reliable but is not guaranteed and should be independently verified.
ⓘ Source: listings_history table (triggers on properties + properties_extension) + one-shot
backfill from property_details.listing_events for pre-trigger history.
Tax reassessment forecast CA · Resets to sale price
- Current annual tax
- $1,094 · $91/mo
- Projected year-2 tax
- $1,094 · $91/mo
- Expected delta
- $0/yr ($0/mo · 0.0%)
ⓘ Screening estimate from a state-policy table — verify with the county assessor before closing.
Climate risk First Street
- Flood 1/10 Low FEMA zone X (unshaded) · 0% chance over 30 yrs
- Wildfire 7/10 Severe
- Heat 6/10 Major 7 d/yr ≥98°F today · 15 d/yr by 30 yrs out
- Wind 1/10 Low
- Air quality 10/10 Extreme 29 unhealthy d/yr today · 31 by 30 yrs out
Nearby sold comps map
Loading sold comps map…
Walkable amenities ~0.75 mi
Loading nearby amenities…
Taxation est. · year 1
- Rental income
- $15,412
- − Mortgage interest
- −$7,058
- − Property taxes
- −$1,094
- − Insurance
- −$630
- − Repairs & maintenance
- −$1,233
- − Management
- −$1,233
- − Depreciation
- −$3,665
- Taxable income
- $498
- Est. tax owed @ 24.0%
- −$120
- After-tax cash flow
- $2,402/yr
For passive investors: Depreciation is non-cash, so a rental often shows a tax loss while cash-flowing — sheltering income. Rental losses are passive: they offset passive income freely, and up to $25,000/yr can offset ordinary (W-2) income if you actively participate and your MAGI is under $100k (phasing out to $0 by $150k); unused losses carry forward. On sale, claimed depreciation is recaptured at up to 25%, and gains may owe capital-gains tax (a 1031 exchange can defer both). Figures are a year-1 estimate at your 24.0% rate — not tax advice; consult a CPA.
Schools (NCES district)
- District
- Yreka Union High
- NCES district ID
- 0643410
- Math proficiency
- 25% ▼ -15.00%
- Reading proficiency
- 65% ▬ 0.00%
- Median HH income
- $34,206
- Composite
- 39.28/100
- National rank
- #8184
- State rank
- #630 of 1400 in CA
Livability — Montague
- Score
- 60/100
- State rank
- #577
- US rank
- #18799
Category grades
Schools grade is shown separately in the Schools card above.
Census & demographics
- Census place
- Montague, CA
- Population (ZIP)
- 4,696
Population outlook (Siskiyou County) Hauer SSP2
- Today (2025)
- 39,337 people
- By 2030
- 36,930 · -6.1%
- By 2040
- 32,367 · -17.7%
- By 2050
- 29,030 · -26.2%
- By 2075
- 23,534 · -40.2%
- By 2100
- 19,312 · -50.9%
Race, ethnicity, and origin ACS 2023
- Neighborhood character
- Predominantly White (74%)
- Race & ethnicity
- White 74% Two or more races 11% Hispanic / Latino 10% Native American 4% Black 2% Asian 1%
- Hispanic origin (detail)
- Mexican 8%
- Common ancestry
- Slovak 4% Russian 3% Iranian 2%
- Foreign-born
- 4% · Canada, Vietnam
- Languages at home
- 92% English-only · Spanish 4% German/W. Germanic 1% Other Asian/Pacific 1%
Political lean MEDSL · Siskiyou
- 2024 margin
- R (+19.2) · D 38.8% · R 58.0% · Other 3.2%
- 2008→2024 swing
- -8.8pp toward R · 2008: -10.4pp · 2024: -19.2pp
- All cycles
- 2024: R+19.2 2020: R+15.8 2016: R+20.7 2012: R+15.6 2008: R+10.4
Not yet ingested
- Civics
- —
Market trends
- HPI YoY
- ▼ -107.26%
- Current HPI
- 140.7129
- Rent YoY
- —
- Metro
- —
- State GDP YoY
- ▲ 3.21%
- F500 in state
- 116
Industry mix (Fortune 500 HQ in CA)
| Industry | F500 HQs | Revenue |
|---|---|---|
| Technology | 27 | $1,492B |
|
||
| Financial Services | 3 | $174B |
|
||
| Retail | 3 | $44B |
|
||
| Insurance | 3 | $26B |
|
||
| Media / Entertainment | 2 | $115B |
|
||
| Pharmaceuticals / Biotech | 2 | $62B |
|
||
Price history
+0.0% since first listed2 events — show timeline
- 2026-05-21 Listed $126,000 CRMLS
- 2026-05-20 Listed $126,000 SMLS
Property tax history
+2.1%/yrLatest (2025): $1,094 · +1.5% YoY. Source: county tax records.
Cash-flow waterfall
monthlySold comps — $/sqft
last 12 mo · ≤1 miLoading sold comps…