254 Phillips Bluff Ave · Panama City Beach, FL
Flood risk No data
- FEMA flood zone
- —
- Chance of flooding over 30 yrs
- —
- Est. flood insurance / yr
- —
Fire risk No data
- Est. fire insurance / yr
- —
Heat risk No data
- Hot days now (above threshold)
- —
- Hot days in 30 yrs
- —
Wind risk No data
- Chance of severe wind over 30 yrs
- —
Air-quality risk No data
- Unhealthy air days now
- —
- Unhealthy air days in 30 yrs
- —
Risk factors via First Street. Map © Google.
Why this score? — see what drove the D- grade
The composite is a weighted blend of 9 inputs, each scored 0–100. Each bar is that input's sub-score; the figure is the points it added to the 100-point composite (weight × sub-score).
- ARV discount +12.7/15.0
- Cash flow +8.1/30.0
- Schools +4.3/10.0
- Livability +3.9/5.0
- 1% rule +2.5/10.0
- Condition / age +2.5/5.0
- Rent growth +2.4/5.0
- DSCR +2.1/10.0
- Appreciation +0.0/10.0
$269,781
🖨 Deal sheet 📄 Offer letter ✓ Due diligence
Listing remarks
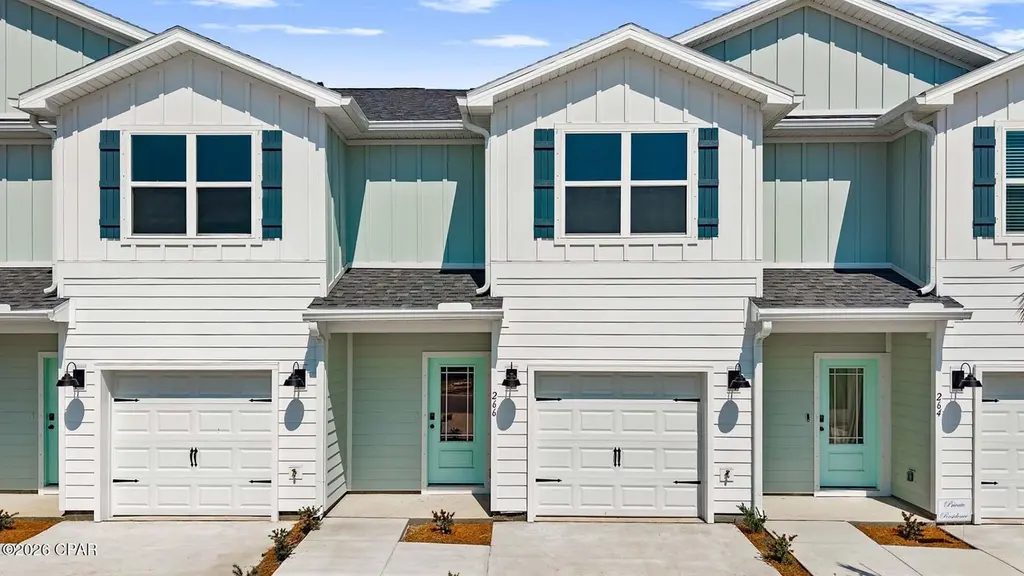
Welcome to 254 Phillips Bluff Avenue, a new home at Colonial East Townhomes in Panama City Beach. This townhome is an interior unit of a six-unit building that is ready for move in. This floor plan has 3 bedrooms, 2.5 bathrooms with a bright foyer leading to the expansive open-concept kitchen, living, and dining area, designed for entertaining and everyday living. The kitchen is open and spacious with a center island and overlooks the main living area. Interior features include quartz countertops, EVP throughout the main level, EVP treads on the stairs and carpet in bedrooms and upstairs hallway. The first floor is heart of this home, while the privacy of the second level holds all bedrooms
Key facts
- Quartz countertops
- Open concept kitchen
- Garage
Tags
Property features AI
Finance
- HOA & community: Homeowners association present; Short-term rentals allowed in the community
Exterior
- Parking: Detached or attached garage with 1 parking space
- Utilities: Electricity available; Public sewer
- Home design: Two-story residence; New construction; HardiPlank-type siding; Shingle roof; Slab foundation; Zoned for multi-family residential
- Construction: Built with HardiPlank-type exterior; Shingle roof; Slab foundation
- Exterior features: Covered patio
Interior
- Kitchen: Electric oven; Electric range
- Bedrooms: Three bedrooms on the second floor
- Bathrooms: Two full bathrooms; One half bathroom
- Heating & cooling: Central heating (electric); Central air conditioning
- Interior features: Smart technology
- Laundry & utility: Electric water heater
Neighborhood map
What this means for you Summary
Snapshot
- This is a 3-bed/2.5-bath townhouse listed at $270k.
Deal economics
- At list price, monthly cash flow is $-267 ($-3k/yr) — negative.
- To cash-flow at today's rent, offer at most $231k (14.3% below list).
- To meet the 1% rule (rent ≥ 1% of price), the offer needs to be $202k (25.1% below list).
- Recommended offer: $202k (25.1% below list) — sets the bar for 1% rule.
- Cap rate 5.1% vs local median 2.6% in Panama City Beach — top-decile yield for the area; either an underpriced asset or a hidden risk that comps aren't pricing in. Stress-test before assuming the spread holds.
Location & tenants
- Location reads 78/100 on livability (#172 in FL, #2,624 nationally) — a middle-class / working-renter tenant base. Strengths: crime A+, housing A+, health & safety A+; Watch: amenities D-, commute F.
- Bay (suburban): math 51% / reading 51% proficiency, ranked #29 of 73 in FL (top 40%) — acceptable for families but not a draw, mixed tenant base, ~2y average lease.
- Market conditions: Rents soft (-0.2%/yr); 702 active listings in the ZIP; 12 comparable units currently listed for rent nearby; rentals at typical pace (median 21d on market — plan ~3-4 weeks tenant-placement turnaround); solid renter incomes; 2,473 units permitted in Bay County in 2024 (559 in 5+ unit buildings).
- This rent runs 30% of the median local income ($81k/yr) — at the standard rent-burdened threshold; future hikes will face affordability resistance.
Forward outlook
- Local home prices are declining (-3.0%/yr); year-one equity from $2k of loan paydown is wiped out by about $8k of value loss. Plan a longer hold.
- Bay County population projected at +24% by 2050 — long-run rental-demand tailwind backs the buy-and-hold thesis.
Negotiation context
- It's been on market 19 days — a 2% lower offer ($266k) is reasonable based on typical stale-listing flexibility.
Questions for the listing agent
- What do current leases actually rent for vs. the listed asking? Can we see a recent rent roll and the last 12 months of T-12 income?
- Is there a deadline driving the sale (1031 exchange, divorce, estate, relocation)? That informs how much negotiation room exists.
- Schools are B-rated — typically a magnet for longer-tenancy family renters. What's the average tenant stay here, and is there a school-zone premium baked into asking?
- The area grade is low — what's the realistic commute time and amenity access for the typical tenant pool here? Any planned neighborhood developments (good or bad) we should know about?
- What's the average days-on-market for RENTAL listings here right now (not sales)? A rising rental-DOM trend means longer vacancies and softer asking-rent achievability than the comps imply.
- What's the recent tenant-quality profile in this submarket — average credit score on applications, eviction rate, late-payment / NSF rate, and stable-employment percentage? A property-management company in the area should have these aggregated.
- How much new for-sale + rental construction is in the pipeline within 1–3 miles? Heavy new supply typically softens prices + rents 12–24 months out; constrained supply supports both.
Investment metrics
- 1% rule
- 0.75% ✗
- Cap rate
- 5.10%
- Cash-on-cash
- -4.25%
- DSCR
- 0.81
- GRM
- 11.1
CMA / ARV
- ARV (median comp)
- $305,246
- List price
- $269,781
- Delta
- -11.62%
- Verdict
- UNDERPRICED
- Comps
- 20 within 1.0 mi
Show comp detail 10 sales within ~0.75 mi
| Address | Dist | Beds/Ba | Sqft | Sold | Price | $/sf | Match |
|---|---|---|---|---|---|---|---|
| 308 Cyan Ln #84 | 0.21mi | 3/2.5 | 1,513 (+4%) | 4mo | $349,900 | $231 | 81 |
| 301 Cyan Ln #25 | 0.23mi | 3/2.5 | 1,513 (+4%) | 3mo | $370,000 | $245 | 81 |
| 312 Cyan Ln #82 | 0.22mi | 3/2.5 | 1,513 (+4%) | 4mo | $343,385 | $227 | 80 |
| 245 Skylah Ln #23 | 0.19mi | 3/2.5 | 1,513 (+4%) | 10mo | $328,000 | $217 | 77 |
| 237 Skylah Ln #19 | 0.20mi | 3/2.5 | 1,513 (+4%) | 10mo | $332,500 | $220 | 77 |
| 247 Skylah Ln #24 | 0.17mi | 3/2.5 | 1,513 (+4%) | 12mo | $350,000 | $231 | 75 |
| 243 Skylah Ln #22 | 0.22mi | 3/2.5 | 1,513 (+4%) | 12mo | $340,000 | $225 | 73 |
| 235 Skylah Ln #18 | 0.26mi | 3/2.5 | 1,513 (+4%) | 12mo | $333,400 | $220 | 72 |
| 233 Skylah Ln #17 | 0.26mi | 3/2.5 | 1,513 (+4%) | 12mo | $354,000 | $234 | 72 |
| 239 Skylah Ln #20 | 0.35mi | 3/2.5 | 1,513 (+4%) | 10mo | $324,900 | $215 | 69 |
Match score weights: distance 35% · size 25% · config 20% · recency 20%. Top-matched comps best support the ARV.
Projected returns pro-forma
-3.0% appreciation · 0.0% rent growth · sell at horizon
- IRR
- -26.9%
- Equity multiple
- 0.12×
- Total profit
- $-66,640
- Equity at exit
- $40,225
- IRR
- -39.4%
- Equity multiple
- -0.36×
- Total profit
- $-102,730
- Equity at exit
- $23,326
Cash invested: $75,539 (down + closing). Projections, not guarantees.
Landlord ↔ Tenant lean methodology
- Overall (STATE)
- 87 Strongly Landlord-Friendly
- State Florida
- 87 Strongly Landlord-Friendly · R+3
- County
- — inherits STATE
- City
- — inherits STATE
ZIP-level market 32407
- Home prices YoY
- -29.5%
- Rents YoY
- -0.2%
- Active inventory
- 702
- Price-to-rent
- 11.1×
Monthly cashflow live
- Estimated rent
- $2,022 high interval (Pro) →
- Mortgage (P&I)
- −$1,415
- Tax est. 1.5%
- −$337 /mo · $4,047/yr
- Insurance
- −$112
- HOA
- −$0
- Vacancy / Maint / Mgmt
- −$425
- Net cashflow
- $-267
Break-even live
UW: 25.0% down · 7.5% · 30yr · 1.5% tax · 5.0% vac · 8.0% maint · 8.0% mgmt
Financing live
Cash to close
- Down payment
- $67,445
- Closing costs
- $8,093
- Reserves months
- —
- Total cash needed
- —
Loan-product check · same deal, 3 products live
Conventional
25% down · 7.5% · 30yr
- Down + closing
- —
- Monthly P&I
- —
- Monthly cashflow
- —
- DSCR
- —
- Eligible?
- —
Personal DTI + credit; lowest rate.
DSCR
20% down · 8.5% · 30yr
- Down + closing
- —
- Monthly P&I
- —
- Monthly cashflow
- —
- DSCR
- —
- Eligible?
- —
No personal income docs; deal must DSCR.
Hard money
10% down · 12.0% · 12mo
- Down + closing
- —
- Monthly P&I
- —
- Monthly cashflow
- —
- DSCR
- —
- Eligible?
- —
Short-term bridge; refi at stabilization.
Rent comps 12 comps
| Address | Beds | Baths | Sqft | Rent | $/sqft | DOM | Units | Dist |
|---|---|---|---|---|---|---|---|---|
| 1105 Clara Ave Panama City Beach, FL | 3.0 | 1.0–2.0 | 938 | $2,099 | $2.24 | 13d | 14 | 0.16mi |
| 900 Clara Ave Panama City Beach, FL | 1.0–3.0 | 1.0–2.0 | 1134 | $2,175 | $1.92 | 13d | 15 | 0.34mi |
| 901 Pelican Pl Panama City Beach, FL | 2.0 | 2.0 | 1746 | $1,650 | $0.95 | 20d | 1 | 0.51mi |
| 509 Lighthouse Rd Panama City Beach, FL | 2.0 | 2.0 | 965 | $1,500 | $1.55 | 20d | 1 | 0.75mi |
| 303 Lighthouse Rd Panama City Beach, FL | 4.0 | 3.0 | 1400 | $1,900 | $1.36 | 20d | 1 | 0.76mi |
| 201 Cape Cod Dr Panama City Beach, FL | 3.0 | 2.0 | 1195 | $1,700 | $1.42 | 20d | 1 | 0.79mi |
| 314 Evergreen St Panama City Beach, FL | 3.0 | 2.0 | 960 | $1,800 | $1.88 | 20d | 1 | 0.82mi |
| 302 Cabana Blvd Panama City Beach, FL | 1.0–3.0 | 1.0–2.0 | 1184 | $1,806 | $1.53 | 13d | 15 | 1.09mi |
| 335 Madison Cir Panama City Beach, FL | 3.0 | 3.0 | 1682 | $2,599 | $1.55 | 20d | 1 | 1.11mi |
| 14108 Pelican St Panama City Beach, FL | 4.0 | 3.0 | 1832 | $2,700 | $1.47 | 13d | 1 | 1.11mi |
| 505 Anemone St Unit 1511627P Panama City Beach, FL | 2.0 | 2.0 | 990 | $3,929 | $3.97 | 20d | 1 | 1.24mi |
| 11709 Seashore Ln Panama City Beach, FL | 3.0 | 2.0 | 1269 | $2,300 | $1.81 | 13d | 1 | 1.49mi |
Listing history 6 events
-
2026-06-01status $269,781 Pending 19 DOM
-
2026-05-31days on market $269,781 Active 19 DOM
-
2026-05-30days on market $269,781 Active 18 DOM
-
2026-05-15price $282,009 1373-char remark
-
2026-05-12$288,207 Active 1373-char remark
-
2025-03-24soldstatus $5,814,000
ⓘ Source: listings_history table (triggers on properties + properties_extension) + one-shot
backfill from property_details.listing_events for pre-trigger history.
Nearby sold comps map
Loading sold comps map…
Walkable amenities ~0.75 mi
Loading nearby amenities…
Taxation est. · year 1
- Rental income
- $24,258
- − Mortgage interest
- −$15,112
- − Property taxes
- −$4,047
- − Insurance
- −$1,349
- − Repairs & maintenance
- −$1,941
- − Management
- −$1,941
- − Depreciation
- −$7,848
- Taxable loss
- −$7,979
- Est. tax savings @ 24.0%
- +$1,915
- After-tax cash flow
- $-1,294/yr
For passive investors: Depreciation is non-cash, so a rental often shows a tax loss while cash-flowing — sheltering income. Rental losses are passive: they offset passive income freely, and up to $25,000/yr can offset ordinary (W-2) income if you actively participate and your MAGI is under $100k (phasing out to $0 by $150k); unused losses carry forward. On sale, claimed depreciation is recaptured at up to 25%, and gains may owe capital-gains tax (a 1031 exchange can defer both). Figures are a year-1 estimate at your 24.0% rate — not tax advice; consult a CPA.
Schools (NCES district)
- District
- Bay
- NCES district ID
- 1200090
- Math proficiency
- 51% ▼ -8.00%
- Reading proficiency
- 51% ▼ -7.00%
- Median HH income
- $47,740
- Composite
- 43.41/100
- National rank
- #3014
- State rank
- #29 of 73 in FL
Livability — Panama City Beach
- Score
- 78/100
- State rank
- #172
- US rank
- #2624
Category grades
Schools grade is shown separately in the Schools card above.
Census & demographics
- County
- Bay County · 163,593 people
- City population
- 50,689
- Metro
- Panama City, FL
- Population (ZIP)
- 16,404
- Household income
- $80,831
- Rent vs Own
- Severe rent burden
- 939.0
Population outlook (Bay County) Hauer SSP2
- Today (2025)
- 206,264 people
- By 2030
- 217,740 · +5.6%
- By 2040
- 238,738 · +15.7%
- By 2050
- 255,545 · +23.9%
- By 2075
- 288,295 · +39.8%
- By 2100
- 288,638 · +39.9%
Race, ethnicity, and origin ACS 2023
- Neighborhood character
- Predominantly White (73%)
- Race & ethnicity
- White 73% Black 10% Two or more races 9% Hispanic / Latino 8% Asian 2%
- Hispanic origin (detail)
- Mexican 2% Puerto Rican 2%
- Common ancestry
- Lithuanian 4% Italian 3% Portuguese 2%
- Foreign-born
- 12% · Canada, Jamaica, South Korea
- Languages at home
- 89% English-only · Spanish 6% Other Indo-European 1% Russian/Polish/Slavic 1%
Political lean MEDSL · Bay
- 2024 margin
- Solid R (+47.4) · D 25.8% · R 73.1% · Other 1.1%
- 2008→2024 swing
- -6.6pp toward R · 2008: -40.7pp · 2024: -47.4pp
- All cycles
- 2024: R+47.4 2020: R+43.5 2016: R+46.3 2012: R+43.6 2008: R+40.7
Not yet ingested
- Civics
- —
Market trends
- HPI YoY
- ▼ -116.39%
- Current HPI
- 277.8875
- Rent YoY
- ▼ -0.25%
- Metro
- Panama City, FL
- State GDP YoY
- ▲ 3.28%
- F500 in state
- 36
Industry mix (Fortune 500 HQ in FL)
| Industry | F500 HQs | Revenue |
|---|---|---|
| Industrial Technology | 2 | $29B |
|
||
| Insurance | 2 | $17B |
|
||
| Retail | 1 | $60B |
|
||
| Technology Distribution | 1 | $58B |
|
||
| Homebuilding | 1 | $35B |
|
||
| Technology Manufacturing | 1 | $35B |
|
||
Price history
-95.4% since first listed6 events — show timeline
- 2026-05-31 Pending — CPARMLS
- 2026-05-26 Price Changed $269,781 CPARMLS
- 2026-05-21 Price Changed $271,081 CPARMLS
- 2026-05-15 Price Changed $282,009 CPARMLS
- 2026-05-12 Listed $288,207 CPARMLS
- 2025-03-24 Sold (Public Records) $5,814,000 Public Records
Cash-flow waterfall
monthlySold comps — $/sqft
last 12 mo · ≤1 miLoading sold comps…