 🏷️ Likely Rental
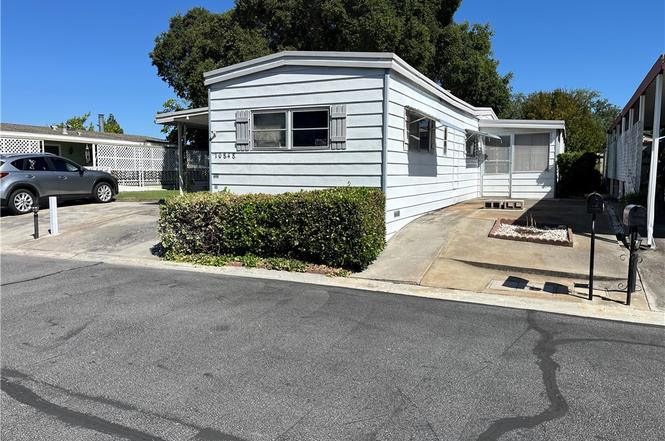
10848 Los Pueblos · Atascadero, CA
Flood risk 1/10 · Minimal
- FEMA flood zone
- X (unshaded)
- Chance of flooding over 30 yrs
- 0.0%
- Est. flood insurance / yr
- $507 – $1,088
Fire risk 8/10 · Major
- Est. fire insurance / yr
- $659 – $1,223
Heat risk 4/10 · Minor
- Hot days now (above 94°F)
- 6 days/yr
- Hot days in 30 yrs
- 15 days/yr
Wind risk 1/10 · Minimal
- Chance of severe wind over 30 yrs
- —
Air-quality risk 7/10 · Major
- Unhealthy air days now
- 12 days/yr
- Unhealthy air days in 30 yrs
- 14 days/yr
Risk factors via First Street. Map © Google.
Why this score? — see what drove the B+ grade
The composite is a weighted blend of 9 inputs, each scored 0–100. Each bar is that input's sub-score; the figure is the points it added to the 100-point composite (weight × sub-score).
- Cash flow +30.0/30.0
- ARV discount +15.0/15.0
- 1% rule +10.0/10.0
- DSCR +10.0/10.0
- Schools +4.3/10.0
- Livability +3.2/5.0
- Rent growth +3.1/5.0
- Condition / age +1.0/5.0
- Appreciation +0.0/10.0
$95,000
🖨 Deal sheet (PDF) 📄 Offer letter ✓ Due diligence
Listing remarks
Welcome to Villa Margarita Mobile Home Park in Beautiful Atascadero! This home is located in a nice mobile home park in South Atascadero. It is a 2 bedroom, 1 bath mobile home. The home does need a lot of tender loving care but it is price to sell at $95,000 considering it does need work. This mobile home is located next to a green belt and if has a very deep carport that can accomodate at least two cars. It is an affordable home with low space rent under $700.00 per month. The mobile home lot is large enough to accomodate a 20' by 60' new manufactured home.
Key facts
- Green belt
- Deep carport
- Large lot
Tags
Property features AI
Finance
- Other: Pets allowed: dogs and cats; Lot density indicated as 6–10 units per acre
- Financial info: Monthly land lease of $650 (park)
- HOA & community: Senior community; Rural community setting; Located in Villa Margarita Mobile Home Park
Exterior
- Parking: Carport with space for 2 vehicles
- Utilities: Public/district water; Public sewer; Natural gas connected; Electricity connected; Cable available; Telephone service available in street
- Home design: Single-wide mobile home (Champion model); Single story; Mobile home remains on site
- Construction: Metal roof; Pier jacks foundation; Mobile dimensions approximately 12 ft by 60 ft; Year built per public records
- Exterior features: Community pool access; Aluminum skirting; One storage shed; North-facing
Interior
- Kitchen: Gas range; Gas oven; Formica counters; Gas water heater
- Bedrooms: Primary bedroom
- Flooring: Vinyl flooring; Carpet
- Bathrooms: 1 full bathroom
- Heating & cooling: Forced air heating
- Interior features: Formica counters; Screens on windows; One-level home; Entry at carport side door; 36-inch (or wider) halls and multiple access exits for accessibility
- Laundry & utility: Washer hookup; Gas dryer hookup
Neighborhood map
What this means for you Summary
Snapshot
- This is a 2-bed/1.0-bath manufactured listed at $95k. Condition is rated poor.
Deal economics
- At list price, monthly cash flow is $964 ($12k/yr) — positive.
- The deal already cash-flows at list — no discount required.
- Meets the 1% rule at list price ($2k rent vs $95k).
- Cap rate 18.5% vs local median 2.1% in Atascadero — top-decile yield for the area; either an underpriced asset or a hidden risk that comps aren't pricing in. Stress-test before assuming the spread holds.
Location & tenants
- Location reads 65/100 on livability (#369 in CA) — a middle-class / working-renter tenant base. Strengths: employment A+, crime A-; Watch: schools C-, commute C-, amenities F.
- Atascadero Unified (suburban): math 40% / reading 51% proficiency, ranked #508 of 1,400 in CA (top 36%) — families likely to look elsewhere, expect single-tenant / working-renter base with shorter leases.
- Market conditions: Rents rising (+2.3%/yr); 93 active listings in the ZIP; 5 comparable units currently listed for rent nearby; rentals at typical pace (median 23d on market — plan ~3-4 weeks tenant-placement turnaround); 40% of comp listings sitting > 30 days — soft ceiling on asking rent; solid renter incomes; 1,104 units permitted in San Luis Obispo County in 2024 (273 in 5+ unit buildings).
Forward outlook
- Local home prices are declining (-3.0%/yr); year-one equity from $657 of loan paydown is wiped out by about $3k of value loss. Plan a longer hold.
- San Luis Obispo County population projected at +20% by 2050 — long-run rental-demand tailwind backs the buy-and-hold thesis.
- At projected returns (-3.0% appreciation + 2.3% rent growth), your $27k cash investment doubles in ~3 years — after that, you're playing with house money.
Negotiation context
- Only 6 days on market — expect competitive offers; lowballing is unlikely to land.
Risks & watch-outs
- Climate carrying-cost: severe wildfire risk — expect insurance premiums to compound above CPI over the hold.
Questions for the listing agent
- Have any recent inspections been done? Can we get a copy of the seller's disclosures and any deferred-maintenance estimates?
- Built in 1973 — when were the roof, HVAC, electrical panel, plumbing, and water heater last replaced?
- Is there a deadline driving the sale (1031 exchange, divorce, estate, relocation)? That informs how much negotiation room exists.
- What's the average days-on-market for RENTAL listings here right now (not sales)? A rising rental-DOM trend means longer vacancies and softer asking-rent achievability than the comps imply.
- What's the recent tenant-quality profile in this submarket — average credit score on applications, eviction rate, late-payment / NSF rate, and stable-employment percentage? A property-management company in the area should have these aggregated.
- How much new for-sale + rental construction is in the pipeline within 1–3 miles? Heavy new supply typically softens prices + rents 12–24 months out; constrained supply supports both.
Investment metrics
- 1% rule
- 2.16% ✓
- Cap rate
- 18.46%
- Cash-on-cash
- 43.47%
- DSCR
- 2.93
- GRM
- 3.9
CMA / ARV
- ARV (on-the-fly)
- $125,280
- Comps found
- 1
Show comp detail 1 sale within ~0.75 mi
| Address | Dist | Beds/Ba | Sqft | Sold | Price | $/sf | Match |
|---|---|---|---|---|---|---|---|
| 10025 El Camino Real #111 | 0.63mi | 2/1.5 | 804 (+12%) | 19mo | $140,000 | $174 | 33 |
Match score weights: distance 35% · size 25% · config 20% · recency 20%. Top-matched comps best support the ARV.
Projected returns pro-forma
-3.0% appreciation · 2.26% rent growth · sell at horizon
- IRR
- 39.5%
- Equity multiple
- 2.67×
- Total profit
- $44,487
- Equity at exit
- $14,165
- IRR
- 45.5%
- Equity multiple
- 5.20×
- Total profit
- $111,756
- Equity at exit
- $8,214
Cash invested: $26,600 (down + closing). Projections, not guarantees.
Landlord ↔ Tenant lean methodology
- Overall (STATE)
- 18 Strongly Tenant-Friendly
- State California
- 18 Strongly Tenant-Friendly · D+13
- County
- — inherits STATE
- City
- — inherits STATE
ZIP-level market 93422
- Rents YoY
- 2.3%
- Active inventory
- 93
- Price-to-rent
- 3.9×
Monthly cashflow live
- Estimated rent
- $2,051 high interval (Pro) →
- Mortgage (P&I)
- −$498
- Tax est. 1.5%
- −$119 /mo · $1,425/yr
- Insurance
- −$40
- HOA
- −$0
- Vacancy / Maint / Mgmt
- −$431
- Net cashflow
- $964
Break-even live
Sensitivity live
| Price | -10% $1,029 | -5% $996 | +0% $964 | +5% $931 | +10% $898 |
|---|---|---|---|---|---|
| Rent | -10% $802 | -5% $883 | +0% $964 | +5% $1,045 | +10% $1,126 |
| Rate | -1.0pp $1,011 | -0.5pp $988 | base $964 | +0.5pp $939 | +1.0pp $914 |
UW: 25.0% down · 7.5% · 30yr · 1.5% tax · 5.0% vac · 8.0% maint · 8.0% mgmt
Financing live
Cash to close
- Down payment
- $23,750
- Closing costs
- $2,850
- Reserves months
- —
- Total cash needed
- —
Loan-product check · same deal, 3 products live
Conventional
25% down · 7.5% · 30yr
- Down + closing
- —
- Monthly P&I
- —
- Monthly cashflow
- —
- DSCR
- —
- Eligible?
- —
Personal DTI + credit; lowest rate.
DSCR
20% down · 8.5% · 30yr
- Down + closing
- —
- Monthly P&I
- —
- Monthly cashflow
- —
- DSCR
- —
- Eligible?
- —
No personal income docs; deal must DSCR.
Hard money
10% down · 12.0% · 12mo
- Down + closing
- —
- Monthly P&I
- —
- Monthly cashflow
- —
- DSCR
- —
- Eligible?
- —
Short-term bridge; refi at stabilization.
Rent comps 5 comps
| Address | Beds | Baths | Sqft | Rent | $/sqft | DOM | Units | Dist |
|---|---|---|---|---|---|---|---|---|
| 9405 Avenida Maria Unit 201 Atascadero, CA | 1.0 | 1.0 | 477 | $1,900 | $3.98 | 45d | 1 | 0.13mi |
| 9405 Avenida Maria Unit 108 Atascadero, CA | 1.0 | 1.0 | 594 | $1,900 | $3.20 | 22d | 1 | 0.13mi |
| 941 Buena Fortuna Cir Unit 843 Atascadero, CA | 1.0 | 1.0 | 600 | $1,945 | $3.24 | 45d | 1 | 0.17mi |
| 941 Buena Fortuna Cir Unit 730 Atascadero, CA | 1.0 | 1.0 | 600 | $1,945 | $3.24 | 22d | 1 | 0.17mi |
| 941 Buena Fortuna Cir Unit 607 Atascadero, CA | 1.0 | 1.0 | 600 | $1,945 | $3.24 | 15d | 1 | 0.17mi |
Listing history 5 events
-
2026-06-21days on market $95,000 Active 6 DOM
-
2026-06-18days on market $95,000 Active 3 DOM
-
2026-06-17days on market $95,000 Active 2 DOM
-
2026-06-16remarks 565-char remark
-
2026-06-16$95,000 Active 1 DOM
ⓘ Source: listings_history table (triggers on properties + properties_extension) + one-shot
backfill from property_details.listing_events for pre-trigger history.
Climate risk First Street
- Flood 1/10 Low FEMA zone X (unshaded) · 0% chance over 30 yrs
- Wildfire 8/10 Severe
- Heat 4/10 Moderate 6 d/yr ≥94°F today · 15 d/yr by 30 yrs out
- Wind 1/10 Low
- Air quality 7/10 Severe 12 unhealthy d/yr today · 14 by 30 yrs out
Nearby sold comps map
Loading sold comps map…
Walkable amenities ~0.75 mi
Loading nearby amenities…
Taxation est. · year 1
- Rental income
- $24,608
- − Mortgage interest
- −$5,321
- − Property taxes
- −$1,425
- − Insurance
- −$475
- − Repairs & maintenance
- −$1,969
- − Management
- −$1,969
- − Depreciation
- −$2,764
- Taxable income
- $10,686
- Est. tax owed @ 24.0%
- −$2,565
- After-tax cash flow
- $8,998/yr
For passive investors: Depreciation is non-cash, so a rental often shows a tax loss while cash-flowing — sheltering income. Rental losses are passive: they offset passive income freely, and up to $25,000/yr can offset ordinary (W-2) income if you actively participate and your MAGI is under $100k (phasing out to $0 by $150k); unused losses carry forward. On sale, claimed depreciation is recaptured at up to 25%, and gains may owe capital-gains tax (a 1031 exchange can defer both). Figures are a year-1 estimate at your 24.0% rate — not tax advice; consult a CPA.
Condition & rehab AI · 2 photos
This mobile home requires extensive repairs and updates to bring it up to a livable condition. Significant investment is needed to improve its exterior, interior, and systems.
Repairs flagged
- Major exterior siding — Significant wear and tear
- Major roof — No visible damage, but not inspected
- Major interior walls/paint — No visible interior, but not inspected
- Major bathrooms — No visible bathrooms, but not inspected
- Major kitchen — No visible kitchen, but not inspected
- Major windows — No visible windows, but not inspected
- Major HVAC/mechanicals — No visible HVAC/mechanicals, but not inspected
- Major landscaping — Overgrown bushes, general lack of maintenance
Value-add opportunities
- Both exterior paint — Fresh paint can significantly improve curb appeal and value
- Both roof repair — A new roof will increase the home's value and reduce maintenance costs
- Both window replacement — New windows will improve energy efficiency and aesthetics
- Both HVAC upgrade — A modern HVAC system will improve comfort and energy efficiency
Renovation cost estimate screening
| Repair item | Severity | Est. cost |
|---|---|---|
| exterior siding · Significant wear and tear | Major | $15,000–50,000 |
| roof · No visible damage, but not inspected | Major | $15,000–50,000 |
| interior walls/paint · No visible interior, but not inspected | Major | $15,000–50,000 |
| bathrooms · No visible bathrooms, but not inspected | Major | $15,000–50,000 |
| kitchen · No visible kitchen, but not inspected | Major | $15,000–50,000 |
| windows · No visible windows, but not inspected | Major | $15,000–50,000 |
| HVAC/mechanicals · No visible HVAC/mechanicals, but not inspected | Major | $15,000–50,000 |
| landscaping · Overgrown bushes, general lack of maintenance | Major | $15,000–50,000 |
| Total estimated repair cost · 8 items | $120,000–400,000 |
Value-add ROI direction
- Both exterior paint — Fresh paint can significantly improve curb appeal and value ↑
- Both roof repair — A new roof will increase the home's value and reduce maintenance costs ↑
- Both window replacement — New windows will improve energy efficiency and aesthetics ↑
- Both HVAC upgrade — A modern HVAC system will improve comfort and energy efficiency ↑
ⓘ Cost ranges are severity-bucket heuristics (US national rule-of-thumb). Get contractor quotes + a written scope before underwriting a rehab budget.
Schools (NCES district)
- District
- Atascadero Unified
- NCES district ID
- 0603300
- Math proficiency
- 40% ▲ 1.00%
- Reading proficiency
- 51% ▬ 0.00%
- Median HH income
- $66,562
- Composite
- 42.81/100
- National rank
- #6748
- State rank
- #508 of 1400 in CA
Livability — Atascadero
- Score
- 65/100
- State rank
- #369
- US rank
- #12594
Category grades
Schools grade is shown separately in the Schools card above.
Census & demographics
- Census place
- Atascadero, CA
- County
- San Luis Obispo County · 224,651 people
- City population
- 33,002
- Metro
- San Luis Obispo-Paso Robles, CA
- Population (ZIP)
- 33,002
- Household income
- $91,780
- Rent vs Own
- Severe rent burden
- 858.0
Population outlook (San Luis Obispo County) Hauer SSP2
- Today (2025)
- 306,977 people
- By 2030
- 320,378 · +4.4%
- By 2040
- 343,933 · +12.0%
- By 2050
- 366,853 · +19.5%
- By 2075
- 428,329 · +39.5%
- By 2100
- 460,687 · +50.1%
Race, ethnicity, and origin ACS 2023
- Neighborhood character
- Predominantly White (69%)
- Race & ethnicity
- White 69% Hispanic / Latino 22% Two or more races 13% Asian 2%
- Hispanic origin (detail)
- Mexican 19%
- Common ancestry
- Italian 4% Slovak 3% Lithuanian 3%
- Foreign-born
- 7% · Canada, South Korea
- Languages at home
- 88% English-only · Spanish 9% Arabic 1% Other Indo-European 1%
Political lean MEDSL · San Luis Obispo
- 2024 margin
- D (+10.9) · D 53.9% · R 43.1% · Other 3.0%
- 2008→2024 swing
- +5.5pp toward D · 2008: 5.4pp · 2024: 10.9pp
- All cycles
- 2024: D+10.9 2020: D+13.1 2016: D+8.3 2012: D+1.0 2008: D+5.4
Not yet ingested
- Civics
- —
Market trends
- HPI YoY
- ▼ -632.04%
- Current HPI
- 380.1972
- Rent YoY
- ▲ 2.26%
- Metro
- San Luis Obispo-Paso Robles, CA
- State GDP YoY
- ▲ 3.21%
- F500 in state
- 116
Industry mix (Fortune 500 HQ in CA)
| Industry | F500 HQs | Revenue |
|---|---|---|
| Technology | 27 | $1,492B |
|
||
| Financial Services | 3 | $174B |
|
||
| Retail | 3 | $44B |
|
||
| Insurance | 3 | $26B |
|
||
| Media / Entertainment | 2 | $115B |
|
||
| Pharmaceuticals / Biotech | 2 | $62B |
|
||
Price history
1 event — show timeline
- 2026-06-15 Listed $95,000 CRMLS
Cash-flow waterfall
monthlySold comps — $/sqft
last 12 mo · ≤1 miLoading sold comps…