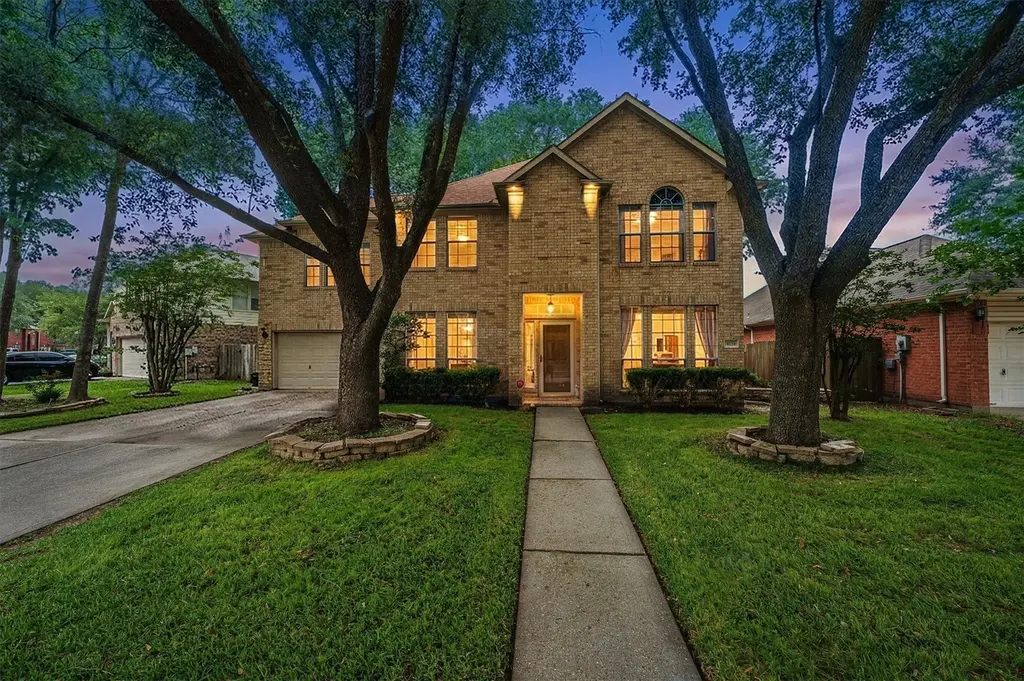
4134 Surreydon Dr · Houston, TX
Flood risk 5/10 · Moderate
- FEMA flood zone
- X (unshaded)
- Chance of flooding over 30 yrs
- 0.67%
- Est. flood insurance / yr
- $507 – $1,088
Fire risk 3/10 · Minor
- Est. fire insurance / yr
- $1,222 – $2,270
Heat risk 9/10 · Severe
- Hot days now (above 110°F)
- 7 days/yr
- Hot days in 30 yrs
- 23 days/yr
Wind risk 9/10 · Severe
- Chance of severe wind over 30 yrs
- 99.0%
Air-quality risk 3/10 · Minor
- Unhealthy air days now
- 3 days/yr
- Unhealthy air days in 30 yrs
- 3 days/yr
Risk factors via First Street. Map © Google.
Why this score? — see what drove the D grade
The composite is a weighted blend of 9 inputs, each scored 0–100. Each bar is that input's sub-score; the figure is the points it added to the 100-point composite (weight × sub-score).
- ARV discount +15.0/15.0
- Cash flow +6.5/30.0
- Appreciation +4.3/10.0
- 1% rule +3.9/10.0
- Livability +3.7/5.0
- Condition / age +2.5/5.0
- Rent growth +2.0/5.0
- Schools +2.0/10.0
- DSCR +0.8/10.0
$210,000
🖨 Deal sheet (PDF) 📄 Offer letter ✓ Due diligence
Listing remarks
STOP scrolling—you won’t want to miss this beautifully maintained home in Hambledon! Ideally located near the neighborhood pool and park, this property has been lovingly cared for by the same owner for many years. Situated on an oversized lot, the backyard features mature trees and a private wooden deck, perfect for relaxing or entertaining. Inside, the foyer is flanked by a formal dining room and a formal living room or study. The main living area opens to the kitchen, complete with a large breakfast bar and breakfast area. Upstairs offers a spacious game room and four bedrooms. The primary suite includes an ensuite bath with a soaking tub and separate shower.
Key facts
- Formal dining room
- Formal living room
- Neighborhood pool
Tags
Property features AI
Finance
- Other: Full ownership
- HOA & community: Community pool; Association Hambledon/SBB; Association amenities include clubhouse and basketball court; Annual association fee of $490 (includes clubhouse)
Exterior
- Parking: Attached garage with 2 garage spaces
- Utilities: Public water; Public sewer
- Home design: Residential property; Faces south; Built in 1996; Slab foundation
- Construction: Brick construction; Composition roof
- Exterior features: Private yard; Backs to greenbelt/park; Located in a subdivision
Interior
- Kitchen: Dishwasher; Garbage disposal; Microwave; Pantry; Breakfast bar
- Bedrooms: Primary bedroom on second level (16x14); Second-level bedroom (12x12); Second-level bedroom (12x12); Second-level bedroom (12x11); First-level office (11x11) — counted among the 5 total rooms
- Flooring: Tile
- Bathrooms: 2 full bathrooms; 1 half bathroom
- Heating & cooling: Central heating (gas); Central air conditioning (gas)
- Interior features: Gas log fireplace; Breakfast bar; Kitchen/family room combo; Laminate counters; Primary bathroom with separate shower and soaking tub; Pantry; Tub/shower; Window treatments; Ceiling fans
- Laundry & utility: Washer hookup
Neighborhood map
What this means for you Summary
Snapshot
- This is a 4-bed/2.5-bath single-family listed at $210k.
Deal economics
- At list price, monthly cash flow is $-352 ($-4k/yr) — negative.
- To cash-flow at today's rent, offer at most $148k (29.6% below list).
- To meet the 1% rule (rent ≥ 1% of price), the offer needs to be $188k (10.6% below list).
- Recommended offer: $148k (29.6% below list) — sets the bar for cash-flow.
- Cap rate 4.3% vs local median 3.2% in Houston — top-decile yield for the area; either an underpriced asset or a hidden risk that comps aren't pricing in. Stress-test before assuming the spread holds.
Location & tenants
- Location reads 74/100 on livability (#184 in TX, #4,771 nationally) — a middle-class / working-renter tenant base. Strengths: amenities A+, cost of living A+, housing A+; Watch: crime F.
- Spring ISD (suburban): math 19% / reading 26% proficiency, ranked #730 of 826 in TX (top 88%) — low school quality limits family demand, transient renter base, plan for 1-2y turnover; 66% free/reduced lunch — lower-income household profile, screen leases tightly.
- Zoned schools: Beneke El (math 27% / reading 34%, grade F, #2,464 of 4,322 statewide, top 58%, 637 students, 87% FRL); Edwin M Wells Middle (math 8% / reading 17%, grade F, #1,616 of 1,662 statewide, top 97%, 907 students, 89% FRL); Spring H S (math 12% / reading 21%, grade F, #1,497 of 1,632 statewide, top 92%, 2,760 students, 72% FRL) — zoned schools average 83% FRL vs 66% district-wide (16 pts higher); higher-poverty schools than district average — tighter screening recommended.
- Market conditions: Rents soft (-2.1%/yr); 109 active listings in the ZIP; 3 comparable units currently listed for rent nearby; rentals lingering (median 46d on market — plan ~5-8 weeks vacancy on turnover, expect pricing pressure); 67% of comp listings sitting > 30 days — soft ceiling on asking rent; 29,883 units permitted in Harris County in 2024 (8,621 in 5+ unit buildings).
- This rent runs 41% of the median local income ($56k/yr) — at the standard rent-burdened threshold; future hikes will face affordability resistance.
Forward outlook
- Local home prices are declining (-1.4%/yr); year-one equity from $1k of loan paydown is wiped out by about $3k of value loss. Plan a longer hold.
- Harris County population projected at +47% by 2050 — long-run rental-demand tailwind backs the buy-and-hold thesis.
Negotiation context
- Only 6 days on market — expect competitive offers; lowballing is unlikely to land.
Risks & watch-outs
- Watch-outs: property tax is 3.5% of price.
- Climate carrying-cost: moderate flood risk; severe wind risk, 99% chance of damaging wind over 30y; extreme-heat days projected 7→23/yr by 2055 (HVAC capex compounding) — expect insurance premiums to compound above CPI over the hold.
Questions for the listing agent
- What do current leases actually rent for vs. the listed asking? Can we see a recent rent roll and the last 12 months of T-12 income?
- Property tax is high relative to price — has the assessment been appealed recently, and will the sale trigger a re-assessment?
- What does the HOA fee cover, when was the last increase, and are there any pending special assessments or reserve-fund shortfalls?
- Is there a deadline driving the sale (1031 exchange, divorce, estate, relocation)? That informs how much negotiation room exists.
- Schools are D-rated, which usually means shorter tenancies and higher turnover. Who's the typical renter profile here, and what's been the actual vacancy rate?
- Crime grade is F in this area — have there been break-ins, vandalism, or insurance claims at this property in the last 3 years? What carrier currently insures it and at what premium?
- The area grade is low — what's the realistic commute time and amenity access for the typical tenant pool here? Any planned neighborhood developments (good or bad) we should know about?
- What's the average days-on-market for RENTAL listings here right now (not sales)? A rising rental-DOM trend means longer vacancies and softer asking-rent achievability than the comps imply.
- What's the recent tenant-quality profile in this submarket — average credit score on applications, eviction rate, late-payment / NSF rate, and stable-employment percentage? A property-management company in the area should have these aggregated.
- How much new for-sale + rental construction is in the pipeline within 1–3 miles? Heavy new supply typically softens prices + rents 12–24 months out; constrained supply supports both.
Investment metrics
- 1% rule
- 0.89% ✗
- Cap rate
- 4.28%
- Cash-on-cash
- -7.19%
- DSCR
- 0.68
- GRM
- 9.3
CMA / ARV
- ARV (median comp)
- $268,374
- List price
- $210,000
- Delta
- -21.75%
- Verdict
- UNDERPRICED
- Comps
- 20 within 1.0 mi
Show comp detail 12 sales within ~0.75 mi
| Address | Dist | Beds/Ba | Sqft | Sold | Price | $/sf | Match |
|---|---|---|---|---|---|---|---|
| 4134 Surreydon Dr | 0.00mi | 4/2.5 | 2,464 (0%) | 1mo | $210,000 | $85 | 99 |
| 4219 Tasselwood Ln | 0.16mi | 4/2.5 | 2,434 (-1%) | 4mo | $279,910 | $115 | 87 |
| 4118 Tasselwood Ln | 0.06mi | 3/3.0 (-1) | 2,565 (+4%) | 1mo | $180,000 | $70 | 82 |
| 4119 Hambledon Village Dr | 0.20mi | 3/2.5 (-1) | 2,384 (-3%) | 2mo | $240,000 | $101 | 78 |
| 13911 Elmpark Ct | 0.40mi | 4/2.5 | 2,534 (+3%) | 2mo | $299,000 | $118 | 75 |
| 14311 Pheasant Hill Dr | 0.35mi | 4/2.5 | 2,345 (-5%) | 1mo | $249,900 | $107 | 75 |
| 13706 Sablesprings Ln | 0.19mi | 4/2.5 | 2,230 (-10%) | 2mo | $279,770 | $125 | 74 |
| 14031 Valechase Ln | 0.22mi | 3/2.5 (-1) | 2,135 (-13%) | 5mo | $269,900 | $126 | 58 |
| 4711 Charade Dr | 0.68mi | 5/2.0 (+1) | 2,400 (-3%) | 3mo | $235,000 | $98 | 54 |
| 4907 Sabrina Dr | 0.70mi | 4/2.5 | 2,337 (-5%) | 7mo | $265,000 | $113 | 53 |
| 12211 Sarti St | 0.57mi | 4/2.5 | 2,188 (-11%) | 3mo | $250,000 | $114 | 52 |
| 4807 Wind Chimes Dr | 0.69mi | 3/2.5 (-1) | 2,411 (-2%) | 9mo | $259,900 | $108 | 52 |
Match score weights: distance 35% · size 25% · config 20% · recency 20%. Top-matched comps best support the ARV.
Projected returns pro-forma
-1.41% appreciation · 0.0% rent growth · sell at horizon
- IRR
- -20.4%
- Equity multiple
- 0.19×
- Total profit
- $-47,397
- Equity at exit
- $46,544
- IRR
- -18.4%
- Equity multiple
- -0.31×
- Total profit
- $-77,210
- Equity at exit
- $45,422
Cash invested: $58,800 (down + closing). Projections, not guarantees.
Landlord ↔ Tenant lean methodology
- Overall (STATE)
- 87 Strongly Landlord-Friendly
- State Texas
- 87 Strongly Landlord-Friendly · R+5
- County
- — inherits STATE
- City
- — inherits STATE
ZIP-level market 77014
- Home prices YoY
- -0.6%
- Rents YoY
- -2.1%
- Active inventory
- 109
- Price-to-rent
- 9.3×
Monthly cashflow live
- Estimated rent
- $1,878 medium interval (Pro) →
- Mortgage (P&I)
- −$1,101
- Tax from tax record
- −$606 /mo · $7,275/yr
- Insurance
- −$88
- HOA
- −$41
- Vacancy / Maint / Mgmt
- −$394
- Net cashflow
- $-352
Break-even live
Sensitivity live
| Price | -10% $-234 | -5% $-293 | +0% $-352 | +5% $-412 | +10% $-471 |
|---|---|---|---|---|---|
| Rent | -10% $-501 | -5% $-427 | +0% $-352 | +5% $-278 | +10% $-204 |
| Rate | -1.0pp $-247 | -0.5pp $-299 | base $-352 | +0.5pp $-407 | +1.0pp $-462 |
UW: 25.0% down · 7.5% · 30yr · 1.5% tax · 5.0% vac · 8.0% maint · 8.0% mgmt
Financing live
Cash to close
- Down payment
- $52,500
- Closing costs
- $6,300
- Reserves months
- —
- Total cash needed
- —
Loan-product check · same deal, 3 products live
Conventional
25% down · 7.5% · 30yr
- Down + closing
- —
- Monthly P&I
- —
- Monthly cashflow
- —
- DSCR
- —
- Eligible?
- —
Personal DTI + credit; lowest rate.
DSCR
20% down · 8.5% · 30yr
- Down + closing
- —
- Monthly P&I
- —
- Monthly cashflow
- —
- DSCR
- —
- Eligible?
- —
No personal income docs; deal must DSCR.
Hard money
10% down · 12.0% · 12mo
- Down + closing
- —
- Monthly P&I
- —
- Monthly cashflow
- —
- DSCR
- —
- Eligible?
- —
Short-term bridge; refi at stabilization.
Rent comps 3 comps
| Address | Beds | Baths | Sqft | Rent | $/sqft | DOM | Units | Dist |
|---|---|---|---|---|---|---|---|---|
| 4202 Brandemere Way St Houston, TX | 3.0 | 2.0 | 1586 | $1,695 | $1.07 | 45d | 1 | 0.68mi |
| 4703 Cashel Cir Unit A Houston, TX | 3.0 | 2.5 | 1722 | $1,950 | $1.13 | 20d | 1 | 1.20mi |
| 4710 Tracemeadow Dr Houston, TX | 4.0 | 2.5 | 2123 | $2,300 | $1.08 | 45d | 1 | 1.22mi |
HOA detail
- Monthly dues
- $41 · $492/yr
- Likely covers
- pool
Listing history 3 events
-
2026-05-07status Pending 681-char remark
-
2026-04-30$210,000 Active 681-char remark
-
1996-05-31soldstatus
ⓘ Source: listings_history table (triggers on properties + properties_extension) + one-shot
backfill from property_details.listing_events for pre-trigger history.
Tax reassessment forecast TX · Resets to sale price
- Current annual tax
- $7,275 · $606/mo
- Projected year-2 tax
- $7,275 · $606/mo
- Expected delta
- $0/yr ($0/mo · 0.0%)
ⓘ Screening estimate from a state-policy table — verify with the county assessor before closing.
Climate risk First Street
- Flood 5/10 Major FEMA zone X (unshaded) · 67% chance over 30 yrs
- Wildfire 3/10 Moderate
- Heat 9/10 Extreme 7 d/yr ≥110°F today · 23 d/yr by 30 yrs out
- Wind 9/10 Extreme 99% chance of damaging wind over 30 yrs
- Air quality 3/10 Moderate 3 unhealthy d/yr today · 3 by 30 yrs out
Nearby sold comps map
Loading sold comps map…
Walkable amenities ~0.75 mi
Loading nearby amenities…
Taxation est. · year 1
- Rental income
- $22,536
- − Mortgage interest
- −$11,763
- − Property taxes
- −$7,275
- − Insurance
- −$1,050
- − Repairs & maintenance
- −$1,803
- − Management
- −$1,803
- − HOA
- −$492
- − Depreciation
- −$6,109
- Taxable loss
- −$7,760
- Est. tax savings @ 24.0%
- +$1,862
- After-tax cash flow
- $-2,367/yr
For passive investors: Depreciation is non-cash, so a rental often shows a tax loss while cash-flowing — sheltering income. Rental losses are passive: they offset passive income freely, and up to $25,000/yr can offset ordinary (W-2) income if you actively participate and your MAGI is under $100k (phasing out to $0 by $150k); unused losses carry forward. On sale, claimed depreciation is recaptured at up to 25%, and gains may owe capital-gains tax (a 1031 exchange can defer both). Figures are a year-1 estimate at your 24.0% rate — not tax advice; consult a CPA.
Schools (NCES district)
- District
- Spring ISD
- NCES district ID
- 4841220
- Math proficiency
- 19% ▼ -13.00%
- Reading proficiency
- 26% ▼ -6.00%
- Median HH income
- $51,584
- Composite
- 20.12/100
- National rank
- #8643
- State rank
- #730 of 826 in TX
Livability — Houston
- Score
- 74/100
- State rank
- #184
- US rank
- #4771
Category grades
Schools grade is shown separately in the Schools card above.
Census & demographics
- County
- Harris County · 4,702,590 people
- City population
- 3,226,434
- Metro
- Houston-The Woodlands-Sugar Land, TX
- Population (ZIP)
- 36,119
- Household income
- $55,589
- Rent vs Own
- Severe rent burden
- 2147.0
Population outlook (Harris County) Hauer SSP2
- Today (2025)
- 5,571,493 people
- By 2030
- 6,089,821 · +9.3%
- By 2040
- 7,142,806 · +28.2%
- By 2050
- 8,185,864 · +46.9%
- By 2075
- 10,574,329 · +89.8%
- By 2100
- 12,109,958 · +117.4%
Race, ethnicity, and origin ACS 2023
- Neighborhood character
- Diverse neighborhood (Simpson 0.64)
- Race & ethnicity
- Black 42% Hispanic / Latino 41% Two or more races 21% Asian 9% White 4% Native American 1%
- Hispanic origin (detail)
- Mexican 23% Cuban 1%
- Common ancestry
- Lithuanian 1% Hispanic 1%
- Foreign-born
- 29% · Canada, Vietnam, China
- Languages at home
- 52% English-only · Spanish 37% Vietnamese 6% Other Indo-European 2%
Political lean MEDSL · Harris
- 2024 margin
- Lean D (+5.5) · D 52.0% · R 46.4% · Other 1.6%
- 2008→2024 swing
- +3.9pp toward D · 2008: 1.6pp · 2024: 5.5pp
- All cycles
- 2024: D+5.5 2020: D+13.3 2016: D+12.4 2012: D+0.1 2008: D+1.6
Not yet ingested
- Civics
- —
Market trends
- HPI YoY
- ▼ -1.41%
- Current HPI
- 228.5469
- Rent YoY
- ▼ -2.15%
- Metro
- Houston-The Woodlands-Sugar Land, TX
- State GDP YoY
- ▲ 3.95%
- F500 in state
- 110
Industry mix (Fortune 500 HQ in TX)
| Industry | F500 HQs | Revenue |
|---|---|---|
| Energy | 16 | $1,198B |
|
||
| Technology | 5 | $198B |
|
||
| Engineering / Construction | 4 | $72B |
|
||
| Energy Services | 3 | $60B |
|
||
| Utilities | 3 | $41B |
|
||
| Healthcare | 2 | $330B |
|
||
Price history
6 events — show timeline
- 2026-05-28 Sold (Public Records) — Public Records
- 2026-05-27 Sold (MLS) — HARMLS
- 2026-05-13 Sold (Public Records) — Public Records
- 2026-05-07 Pending — HARMLS
- 2026-04-30 Listed $210,000 HARMLS
- 1996-05-31 Sold (Public Records) — Public Records
Property tax history
+7.1%/yrLatest (2025): $7,275 · +11.1% YoY. Source: county tax records.
Cash-flow waterfall
monthlySold comps — $/sqft
last 12 mo · ≤1 miLoading sold comps…