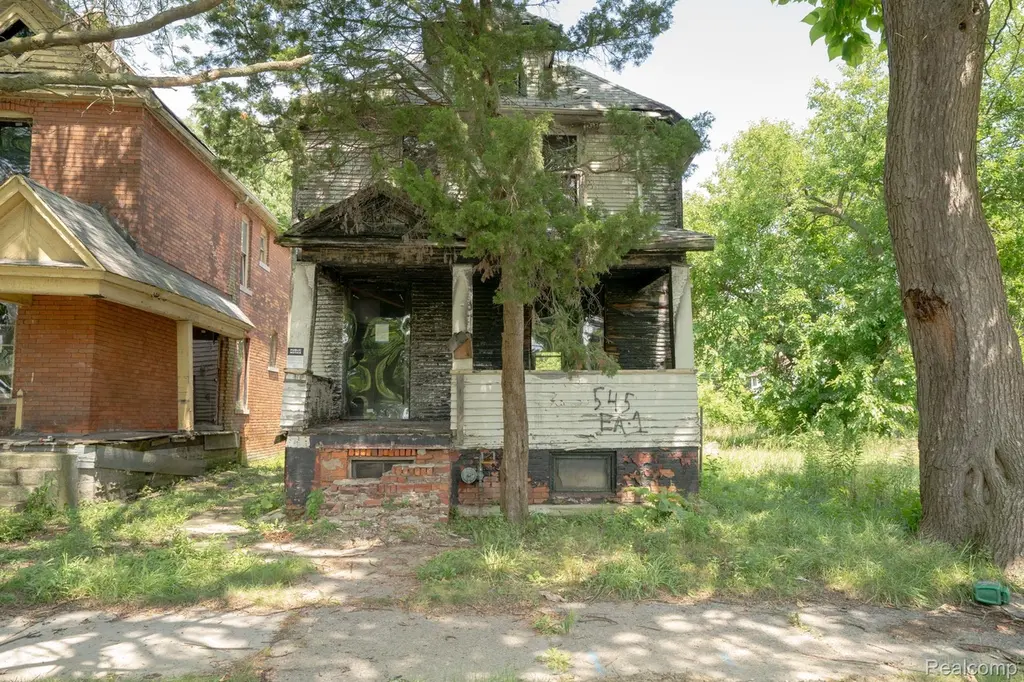
545 Rosedale Ct · Detroit, MI
Flood risk 1/10 · Minimal
- FEMA flood zone
- X (unshaded)
- Chance of flooding over 30 yrs
- 0.0%
- Est. flood insurance / yr
- $473 – $860
Fire risk 1/10 · Minimal
- Est. fire insurance / yr
- $784 – $1,456
Heat risk 3/10 · Minor
- Hot days now (above 96°F)
- 7 days/yr
- Hot days in 30 yrs
- 14 days/yr
Wind risk 2/10 · Minimal
- Chance of severe wind over 30 yrs
- —
Air-quality risk 4/10 · Minor
- Unhealthy air days now
- 4 days/yr
- Unhealthy air days in 30 yrs
- 6 days/yr
Risk factors via First Street. Map © Google.
Why this score? — see what drove the B- grade
The composite is a weighted blend of 9 inputs, each scored 0–100. Each bar is that input's sub-score; the figure is the points it added to the 100-point composite (weight × sub-score).
- Cash flow +30.0/30.0
- 1% rule +10.0/10.0
- DSCR +10.0/10.0
- ARV discount +7.5/15.0
- Livability +3.7/5.0
- Condition / age +2.5/5.0
- Schools +1.3/10.0
- Rent growth +1.2/5.0
- Appreciation +0.0/10.0
$50,000
🖨 Deal sheet 📄 Offer letter ✓ Due diligence
Listing remarks MLS
Detroit Land Bank Opportunity – Gateway Community Neighborhood This Colonial offers 1,236 square feet of potential in the heart of the Gateway Community. Featuring 3 bedrooms and 1 bathroom, this home is ready for an investor or homeowner with a vision. Located in a neighborhood with ongoing revitalization, this property is a great opportunity to build equity and restore a classic Detroit home. This property is being sold as is. Please note that the DLBA is entitled to a tax capture for the 5 tax years subsequent to transferring ownership of the property. The tax capture may be incompatible with tax abatement that are otherwise available to the selected purchaser. DLBA will review requests to waive its tax capture rights and may require a payment in lieu of taxes to approve such requests. THIS IS A BUNDLED LISTING THAT INCLUDES PROPERTY ADDRESS 537 ROSEDALE COURT.
Key facts
- 5,227 sq ft lot
- 2 garage spots
- Built 1909
Neighborhood map
What this means for you Summary
Snapshot
- This is a 3-bed/1.0-bath single-family listed at $50k.
Deal economics
- At list price, monthly cash flow is $900 ($11k/yr) — positive.
- The deal already cash-flows at list — no discount required.
- Meets the 1% rule at list price ($2k rent vs $50k).
- Recommended offer: $44k (12.0% below list) — sets the bar for market timing.
- Cap rate 27.9% vs local median 10.2% in Detroit — top-decile yield for the area; either an underpriced asset or a hidden risk that comps aren't pricing in. Stress-test before assuming the spread holds.
Location & tenants
- Location reads 73/100 on livability (#218 in MI) — a middle-class / working-renter tenant base. Strengths: amenities A+, commute A+, cost of living A+; Watch: schools F, crime F, employment F.
- Detroit Public Schools Community District (urban): math 10% / reading 24% proficiency, ranked #499 of 540 in MI (top 92%) — low school quality limits family demand, transient renter base, plan for 1-2y turnover; 90% free/reduced lunch — lower-income household profile, screen leases tightly.
- Market conditions: Rents falling (-5.1%/yr); 257 active listings in the ZIP; 31 comparable units currently listed for rent nearby; rentals at typical pace (median 20d on market — plan ~3-4 weeks tenant-placement turnaround); lower-income renter base — watch delinquency; 2,639 units permitted in Wayne County in 2024 (1,216 in 5+ unit buildings).
- This rent runs 45% of the median local income ($44k/yr) — at the standard rent-burdened threshold; future hikes will face affordability resistance.
Forward outlook
- Local home prices are declining (-3.0%/yr); year-one equity from $346 of loan paydown is wiped out by about $2k of value loss. Plan a longer hold.
- Wayne County population projected at -17% by 2050 — secular population decline; favor cash flow + early exit over multi-decade hold.
- At projected returns (-3.0% appreciation + 0.0% rent growth), your $14k cash investment doubles in ~2 years — after that, you're playing with house money.
Negotiation context
- It's been on market 311 days — a 12% lower offer ($44k) is reasonable based on typical stale-listing flexibility.
- 3 sale attempts since 22y ago with the ask held roughly flat each time — persistent listings suggest the price (not the market) is what's stuck; bring a comps-based counter.
- Current owner paid $12k; list at $50k implies a 317% gain — meaningful room to come down on a strong offer.
Risks & watch-outs
- Watch-outs: property tax is 2.5% of price; built in 1909 — expect roof / HVAC / electrical / plumbing capex.
Questions for the listing agent
- It's been on market 311 days. Have you received any prior offers? Is the seller open to a 12% concession, seller financing, or rate buy-down credit?
- Built in 1909 — when were the roof, HVAC, electrical panel, plumbing, and water heater last replaced?
- Property tax is high relative to price — has the assessment been appealed recently, and will the sale trigger a re-assessment?
- Why hasn't it sold? Are there any deal-killer items the seller is aware of (foundation, flood, title, zoning, code violations)?
- Is there a deadline driving the sale (1031 exchange, divorce, estate, relocation)? That informs how much negotiation room exists.
- Schools are F-rated, which usually means shorter tenancies and higher turnover. Who's the typical renter profile here, and what's been the actual vacancy rate?
- Crime grade is F in this area — have there been break-ins, vandalism, or insurance claims at this property in the last 3 years? What carrier currently insures it and at what premium?
- What's the average days-on-market for RENTAL listings here right now (not sales)? A rising rental-DOM trend means longer vacancies and softer asking-rent achievability than the comps imply.
- What's the recent tenant-quality profile in this submarket — average credit score on applications, eviction rate, late-payment / NSF rate, and stable-employment percentage? A property-management company in the area should have these aggregated.
- How much new for-sale + rental construction is in the pipeline within 1–3 miles? Heavy new supply typically softens prices + rents 12–24 months out; constrained supply supports both.
Investment metrics
- 1% rule
- 3.26% ✓
- Cap rate
- 27.89%
- Cash-on-cash
- 77.15%
- DSCR
- 4.43
- GRM
- 2.6
CMA / ARV
- ARV (median comp)
- $145,033
- List price
- $50,000
- Delta
- -65.53%
- Verdict
- UNDERPRICED
- Comps
- 20 within 1.0 mi
Show comp detail 12 sales within ~0.75 mi
| Address | Dist | Beds/Ba | Sqft | Sold | Price | $/sf | Match |
|---|---|---|---|---|---|---|---|
| 600 Harmon St | 0.10mi | 4/1.0 (+1) | 1,375 (+8%) | 6mo | $57,000 | $41 | 72 |
| 530 Kenilworth St | 0.55mi | 3/1.0 | 1,323 (+4%) | 4mo | $68,000 | $51 | 65 |
| 11609 Saint Aubin St | 0.75mi | 3/1.0 | 1,249 (-2%) | 6mo | $200,000 | $160 | 57 |
| 254 Colorado St | 0.53mi | 3/1.0 | 1,149 (-10%) | 10mo | $125,000 | $109 | 50 |
| 11591 Saint Aubin St | 0.74mi | 2/1.0 (-1) | 1,240 (-3%) | 8mo | $128,000 | $103 | 49 |
| 137 Rhode Island St | 0.49mi | 3/2.0 | 1,405 (+10%) | 12mo | $47,000 | $33 | 47 |
| 1956 Belmont St | 0.73mi | 3/1.5 | 1,261 (-1%) | 19mo | $179,000 | $142 | 46 |
| 11680 Nagel St | 0.74mi | 3/2.0 | 1,300 (+2%) | 16mo | $152,500 | $117 | 45 |
| 11581 Saint Aubin St | 0.74mi | 2/1.0 (-1) | 1,326 (+4%) | 12mo | $200,000 | $151 | 44 |
| 225 Farrand Park | 0.70mi | 3/1.0 | 1,458 (+14%) | 2mo | $20,000 | $14 | 42 |
| 633 Owen St | 0.65mi | 3/1.0 | 1,461 (+14%) | 12mo | $40,000 | $27 | 36 |
| 11396 Nagel St | 0.70mi | 2/1.0 (-1) | 1,440 (+13%) | 19mo | $118,000 | $82 | 26 |
Match score weights: distance 35% · size 25% · config 20% · recency 20%. Top-matched comps best support the ARV.
Projected returns pro-forma
-3.0% appreciation · 0.0% rent growth · sell at horizon
- IRR
- 73.6%
- Equity multiple
- 4.18×
- Total profit
- $44,492
- Equity at exit
- $7,455
- IRR
- 76.6%
- Equity multiple
- 7.73×
- Total profit
- $94,287
- Equity at exit
- $4,323
Cash invested: $14,000 (down + closing). Projections, not guarantees.
Landlord ↔ Tenant lean methodology
- Overall (STATE)
- 62 Landlord-Friendly
- State Michigan
- 62 Landlord-Friendly · EVEN
- County
- — inherits STATE
- City
- — inherits STATE
ZIP-level market 48202
- Rents YoY
- -5.1%
- Active inventory
- 257
- Price-to-rent
- 2.6×
Monthly cashflow live
- Estimated rent
- $1,632 high interval (Pro) →
- Mortgage (P&I)
- −$262
- Tax from tax record
- −$106 /mo · $1,272/yr
- Insurance
- −$21
- HOA
- −$0
- Vacancy / Maint / Mgmt
- −$343
- Net cashflow
- $900
Break-even live
UW: 25.0% down · 7.5% · 30yr · 1.5% tax · 5.0% vac · 8.0% maint · 8.0% mgmt
Financing live
Cash to close
- Down payment
- $12,500
- Closing costs
- $1,500
- Reserves months
- —
- Total cash needed
- —
Loan-product check · same deal, 3 products live
Conventional
25% down · 7.5% · 30yr
- Down + closing
- —
- Monthly P&I
- —
- Monthly cashflow
- —
- DSCR
- —
- Eligible?
- —
Personal DTI + credit; lowest rate.
DSCR
20% down · 8.5% · 30yr
- Down + closing
- —
- Monthly P&I
- —
- Monthly cashflow
- —
- DSCR
- —
- Eligible?
- —
No personal income docs; deal must DSCR.
Hard money
10% down · 12.0% · 12mo
- Down + closing
- —
- Monthly P&I
- —
- Monthly cashflow
- —
- DSCR
- —
- Eligible?
- —
Short-term bridge; refi at stabilization.
Rent comps 31 comps
| Address | Beds | Baths | Sqft | Rent | $/sqft | DOM | Units | Dist |
|---|---|---|---|---|---|---|---|---|
| 520 Englewood St Detroit, MI | 4.0 | 1.5 | 1086 | $1,725 | $1.59 | 24d | 1 | 0.02mi |
| 613 Belmont St Detroit, MI | 3.0 | 1.0 | 1100 | $1,350 | $1.23 | 17d | 1 | 0.23mi |
| 165 Rhode Island St Highland Park, MI | 4.0 | 1.5 | 1639 | $1,200 | $0.73 | 17d | 1 | 0.46mi |
| 505 Westminster St Detroit, MI | 3.0 | 1.0 | 1700 | $1,400 | $0.82 | 17d | 1 | 0.47mi |
| 9429 Brush St Unit 1B Detroit, MI | 2.0 | 1.0 | 1500 | $1,523 | $1.02 | 43d | 1 | 0.52mi |
| 101 Colorado St Unit NA Highland Park, MI | 4.0 | 1.5 | 1695 | $1,500 | $0.88 | 24d | 1 | 0.55mi |
| 156 Leicester Ct Apt 2 Detroit, MI | 3.0 | 1.0 | 1000 | $1,250 | $1.25 | 43d | 1 | 0.67mi |
| 70 Clairmount Ave Unit 2B Detroit, MI | 2.0 | 1.0 | 955 | $1,400 | $1.47 | 2d | 1 | 0.79mi |
| 64 Glendale St Highland Park, MI | 4.0 | 1.0 | 1464 | $1,500 | $1.02 | 10d | 1 | 0.80mi |
| 168 Beresford St Highland Park, MI | 4.0 | 1.0 | 1541 | $1,475 | $0.96 | 17d | 1 | 0.84mi |
| 419 King St Detroit, MI | 3.0 | 1.0 | 1668 | $2,300 | $1.38 | 10d | 1 | 0.85mi |
| 2315 Yemans St Hamtramck, MI | 2.0 | 2.5 | 1328 | $1,600 | $1.20 | 17d | 1 | 0.96mi |
| 557 Hague St Detroit, MI | 2.0 | 1.0 | 1250 | $1,400 | $1.12 | 43d | 1 | 0.97mi |
| 2297 Florian St Unit 2297 Hamtramck, MI | 2.0 | 1.0 | 1500 | $1,250 | $0.83 | 24d | 1 | 1.05mi |
| 528 E Philadelphia St Detroit, MI | 3.0 | 1.0 | 1625 | $2,400 | $1.48 | 1d | 1 | 1.06mi |
| 8416 Brush St Detroit, MI | 3.0 | 1.5 | 1200 | $2,200 | $1.83 | 1d | 1 | 1.09mi |
| 8410 Brush St Detroit, MI | 3.0 | 2.5 | 1300 | $2,200 | $1.69 | 1d | 1 | 1.10mi |
| 719 Gladstone Ave Detroit, MI | 2.0 | 1.0 | 1200 | $1,750 | $1.46 | 20d | 1 | 1.11mi |
| 1427 Calvert Ave Detroit, MI | 3.0 | 1.0 | 1100 | $1,750 | $1.59 | 43d | 1 | 1.11mi |
| 1427 Calvert Ave Detroit, MI | 3.0 | 1.0 | 1100 | $1,850 | $1.68 | 24d | 1 | 1.11mi |
| 715 Gladstone Ave Detroit, MI | 2.0 | 1.0 | 1200 | $1,750 | $1.46 | 20d | 1 | 1.11mi |
| 68 E Philadelphia St Detroit, MI | 3.0 | 2.0 | 1000 | $1,750 | $1.75 | 43d | 1 | 1.11mi |
| 27 Pasadena St Highland Park, MI | 2.0 | 1.0 | 900 | $825 | $0.92 | 43d | 1 | 1.12mi |
| 2716 Belmont St Unit B Hamtramck, MI | 2.0 | 1.0 | 965 | $775 | $0.80 | 20d | 1 | 1.12mi |
| 9844 Woodrow Wilson St Detroit, MI | 3.0 | 1.0 | 1187 | $1,300 | $1.10 | 12d | 1 | 1.24mi |
| 100 Seward Ave Detroit, MI | 2.0 | 1.0–2.0 | 905 | $1,575 | $1.74 | 21d | 1 | 1.34mi |
| 59 Seward St Detroit, MI | 1.0–2.0 | 1.0 | 976 | $1,363 | $1.40 | 43d | 1 | 1.36mi |
| 700 Seward Ave Detroit, MI | 2.0 | 1.0 | 988 | $1,845 | $1.87 | 1d | 2 | 1.42mi |
| 1929 Calvert Ave Unit 2 Detroit, MI | 3.0 | 1.0 | 1414 | $1,199 | $0.85 | 15d | 1 | 1.44mi |
| 3191 Belmont St Hamtramck, MI | 2.0 | 1.0 | 900 | $1,350 | $1.50 | 24d | 1 | 1.45mi |
| 7645 Woodward Ave #70 Detroit, MI | 2.0 | 2.5 | 1547 | $2,600 | $1.68 | 5d | 1 | 1.47mi |
Listing history 17 events
-
2026-06-18days on market $50,000 Active 311 DOM
-
2026-06-17days on market $50,000 Active 310 DOM
-
2026-06-15days on market $50,000 Active 308 DOM
-
2026-06-13days on market $50,000 Active 306 DOM
-
2026-06-13days on market $50,000 Active 305 DOM
-
2026-06-09days on market $50,000 Active 302 DOM
-
2026-06-08days on market $50,000 Active 301 DOM
-
2026-06-07days on market $50,000 Active 300 DOM
-
2026-06-04days on market $50,000 Active 297 DOM
-
2026-06-03days on market $50,000 Active 296 DOM
-
2026-06-01days on market $50,000 Active 294 DOM
-
2026-05-31days on market $50,000 Active 293 DOM
-
2025-08-11$50,000 Active 882-char remark
Show marketing remark (895 chars)
Detroit Land Bank Opportunity – Gateway Community Neighborhood This Colonial offers 1,236 square feet of potential in the heart of the Gateway Community. Featuring 3 bedrooms and 1 bathroom, this home is ready for an investor or homeowner with a vision. Located in a neighborhood with ongoing revitalization, this property is a great opportunity to build equity and restore a classic Detroit home. This property is being sold as is. Please note that the DLBA is entitled to a tax capture for the 5 tax years subsequent to transferring ownership of the property. The tax capture may be incompatible with tax abatement that are otherwise available to the selected purchaser. DLBA will review requests to waive its tax capture rights and may require a payment in lieu of taxes to approve such requests. THIS IS A BUNDLED LISTING THAT INCLUDES PROPERTY ADDRESS 537 ROSEDALE COURT.
-
2025-08-11$50,000 Active 895-char remark
Show marketing remark (895 chars)
Detroit Land Bank Opportunity – Gateway Community Neighborhood This Colonial offers 1,236 square feet of potential in the heart of the Gateway Community. Featuring 3 bedrooms and 1 bathroom, this home is ready for an investor or homeowner with a vision. Located in a neighborhood with ongoing revitalization, this property is a great opportunity to build equity and restore a classic Detroit home. This property is being sold as is. Please note that the DLBA is entitled to a tax capture for the 5 tax years subsequent to transferring ownership of the property. The tax capture may be incompatible with tax abatement that are otherwise available to the selected purchaser. DLBA will review requests to waive its tax capture rights and may require a payment in lieu of taxes to approve such requests. THIS IS A BUNDLED LISTING THAT INCLUDES PROPERTY ADDRESS 537 ROSEDALE COURT.
-
2005-04-11soldstatus $12,000
-
2004-10-19$16,800
-
1991-06-03soldstatus $8,000
ⓘ Source: listings_history table (triggers on properties + properties_extension) + one-shot
backfill from property_details.listing_events for pre-trigger history.
Tax reassessment forecast MI · Partial reset (capped growth)
- Current annual tax
- $1,272 · $106/mo
- Projected year-2 tax
- $1,272 · $106/mo
- Expected delta
- $0/yr ($0/mo · 0.0%)
ⓘ Screening estimate from a state-policy table — verify with the county assessor before closing.
Climate risk First Street
- Flood 1/10 Low FEMA zone X (unshaded) · 0% chance over 30 yrs
- Wildfire 1/10 Low
- Heat 3/10 Moderate 7 d/yr ≥96°F today · 14 d/yr by 30 yrs out
- Wind 2/10 Low
- Air quality 4/10 Moderate 4 unhealthy d/yr today · 6 by 30 yrs out
Nearby sold comps map
Loading sold comps map…
Walkable amenities ~0.75 mi
Loading nearby amenities…
Taxation est. · year 1
- Rental income
- $19,581
- − Mortgage interest
- −$2,801
- − Property taxes
- −$1,272
- − Insurance
- −$250
- − Repairs & maintenance
- −$1,566
- − Management
- −$1,566
- − Depreciation
- −$1,455
- Taxable income
- $10,671
- Est. tax owed @ 24.0%
- −$2,561
- After-tax cash flow
- $8,240/yr
For passive investors: Depreciation is non-cash, so a rental often shows a tax loss while cash-flowing — sheltering income. Rental losses are passive: they offset passive income freely, and up to $25,000/yr can offset ordinary (W-2) income if you actively participate and your MAGI is under $100k (phasing out to $0 by $150k); unused losses carry forward. On sale, claimed depreciation is recaptured at up to 25%, and gains may owe capital-gains tax (a 1031 exchange can defer both). Figures are a year-1 estimate at your 24.0% rate — not tax advice; consult a CPA.
Schools (NCES district)
- District
- Detroit Public Schools Community District
- NCES district ID
- 2601103
- Math proficiency
- 10% ▼ -2.00%
- Reading proficiency
- 24% ▲ 6.00%
- Median HH income
- $25,815
- Composite
- 13.06/100
- National rank
- #9564
- State rank
- #499 of 540 in MI
Livability — Detroit
- Score
- 73/100
- State rank
- #218
- US rank
- #5427
Category grades
Schools grade is shown separately in the Schools card above.
Census & demographics
- Census place
- Detroit, MI
- County
- Wayne County · 1,562,939 people
- City population
- 572,865
- Metro
- Detroit-Warren-Dearborn, MI
- Population (ZIP)
- 15,780
- Household income
- $43,627
- Rent vs Own
- Severe rent burden
- 1258.0
Population outlook (Wayne County) Hauer SSP2
- Today (2025)
- 1,675,273 people
- By 2030
- 1,620,300 · -3.3%
- By 2040
- 1,502,341 · -10.3%
- By 2050
- 1,384,039 · -17.4%
- By 2075
- 1,124,592 · -32.9%
- By 2100
- 881,193 · -47.4%
Race, ethnicity, and origin ACS 2023
- Neighborhood character
- Diverse neighborhood (Simpson 0.57)
- Race & ethnicity
- Black 60% White 26% Asian 6% Two or more races 4% Hispanic / Latino 3%
- Common ancestry
- Romanian 3% Slovak 1% Lithuanian 1%
- Foreign-born
- 8% · Canada, Vietnam
- Languages at home
- 90% English-only · Other Indo-European 3% Arabic 2% Spanish 2%
Political lean MEDSL · Wayne
- 2024 margin
- Strong D (+29.0) · D 62.7% · R 33.7% · Other 3.6%
- 2008→2024 swing
- -20.5pp toward R · 2008: 49.5pp · 2024: 29.0pp
- All cycles
- 2024: D+29.0 2020: D+38.1 2016: D+37.3 2012: D+46.9 2008: D+49.5
Not yet ingested
- Civics
- —
Market trends
- HPI YoY
- ▼ -239.24%
- Current HPI
- 145.5509
- Rent YoY
- ▼ -5.13%
- Metro
- Detroit-Warren-Dearborn, MI
- State GDP YoY
- ▲ 1.37%
- F500 in state
- 28
Industry mix (Fortune 500 HQ in MI)
| Industry | F500 HQs | Revenue |
|---|---|---|
| Automotive Parts | 3 | $48B |
|
||
| Automotive | 2 | $372B |
|
||
| Chemicals | 1 | $45B |
|
||
| Automotive Retail | 1 | $29B |
|
||
| Healthcare / Medical Devices | 1 | $23B |
|
||
| Automotive Technology | 1 | $20B |
|
||
Price history
+525.0% since first listed5 events — show timeline
- 2025-08-11 Listed $50,000 REALCOMP
- 2025-08-11 Listed $50,000 MiRealSource-MiMLS
- 2005-04-11 Sold (MLS) $12,000 REALCOMP
- 2004-10-19 Listed $16,800 REALCOMP
- 1991-06-03 Sold (Public Records) $8,000 Public Records
Property tax history
+4.5%/yrLatest (2025): $1,272 · +0.0% YoY. Source: county tax records.
Cash-flow waterfall
monthlySold comps — $/sqft
last 12 mo · ≤1 miLoading sold comps…