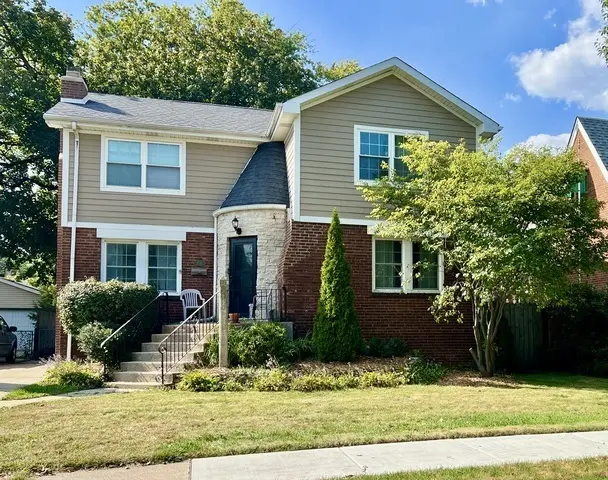
9210 S Trumbull Ave · Evergreen Park, IL
Flood risk 1/10 · Minimal
- FEMA flood zone
- X (unshaded)
- Chance of flooding over 30 yrs
- 0.0%
- Est. flood insurance / yr
- $473 – $860
Fire risk 1/10 · Minimal
- Est. fire insurance / yr
- $804 – $1,492
Heat risk 3/10 · Minor
- Hot days now (above 102°F)
- 7 days/yr
- Hot days in 30 yrs
- 15 days/yr
Wind risk 2/10 · Minimal
- Chance of severe wind over 30 yrs
- —
Air-quality risk 4/10 · Minor
- Unhealthy air days now
- 4 days/yr
- Unhealthy air days in 30 yrs
- 6 days/yr
Risk factors via First Street. Map © Google.
Why this score? — see what drove the F grade
The composite is a weighted blend of 9 inputs, each scored 0–100. Each bar is that input's sub-score; the figure is the points it added to the 100-point composite (weight × sub-score).
- Cash flow +5.7/30.0
- Livability +4.4/5.0
- Rent growth +2.5/5.0
- Condition / age +2.5/5.0
- Schools +2.3/10.0
- 1% rule +0.8/10.0
- DSCR +0.1/10.0
- ARV discount +0.0/15.0
- Appreciation +0.0/10.0
$389,000
🖨 Deal sheet 📄 Offer letter ✓ Due diligence
Listing remarks
RARE FIND! A 4-BEDROOM HOME WITH ALL 4 BEDROOMS UPSTAIRS! This spacious 2,083 SF home has a newer 2nd level addition (2013). The main level spaces have been opened up with focus on maintaining the original character. Spacious living room w/ woodburning fireplace and built-in bench seating (w/ storage) overlooking the backyard. The dining room has 2 original built in corner cabinets and 2 windows letting in amazing natural light. The dining room is adjacent to the kitchen which was remodeled around the time of the 2013 addition. For those who want a more open feeling to the dining room, removing the door and expanding the opening into the dining room would accomplish this! Don't miss
Key facts
- Remodeled kitchen
- 6,250 sq ft lot
- Garage
Tags
Property features AI
Finance
- HOA & community: No master association fee required; Community features include nearby park and tennis courts, curbs, sidewalks, street lights, and paved streets
Exterior
- Parking: Detached garage with garage door opener (garage owned); Concrete side driveway; Approximately 1.5 garage/parking spaces
- Utilities: Water source: Lake Michigan; Public sewer; Electric service with circuit breakers
- Home design: Detached single-family home; Queen Anne model; 2 stories; Fee simple ownership; Rehab completed in 2013; Originally built approximately 81–90 years ago; Built before 1978
- Construction: Brick construction
- Exterior features: Deck; Fenced yard; Lot dimensions approximately 50 x 125
Interior
- Kitchen: Eating-area kitchen; Range; Microwave; Dishwasher; Refrigerator; Stainless steel appliances
- Bedrooms: 4 bedrooms (master and three additional bedrooms on the second floor); Second-floor walk-in closet
- Flooring: Hardwood flooring throughout main living areas; Engineered hardwood on second-floor bedrooms and master; Wood laminate in the finished basement family room
- Bathrooms: 1 full bathroom; 1 half bathroom
- Heating & cooling: Forced air heating (natural gas); Central air conditioning
- Interior features: Built-in features; Walk-in closet(s); Finished full basement; Wood-burning fireplace in the living room; Nine total rooms
- Laundry & utility: In-unit laundry (washer and dryer); Basement laundry room
Neighborhood map
What this means for you Summary
Snapshot
- This is a 2-bed/1.5-bath single-family listed at $389k.
Deal economics
- At list price, monthly cash flow is $-789 ($-9k/yr) — negative.
- To cash-flow at today's rent, offer at most $250k (35.8% below list).
- To meet the 1% rule (rent ≥ 1% of price), the offer needs to be $224k (42.4% below list).
- Recommended offer: $224k (42.4% below list) — sets the bar for 1% rule.
- Cap rate 3.9% vs local median 5.9% in Evergreen Park — below-typical yield; the buyer is paying a premium for something (appreciation thesis, condition, location) that the cap rate doesn't capture.
Location & tenants
- Location reads 87/100 on livability (#14 in IL, #327 nationally) — a professional / high-income tenant draw. Strengths: commute A+, employment A+, housing A+; Watch: crime D+.
- Evergreen Park Chsd 231 (suburban): math 25% / reading 23% proficiency, ranked #303 of 620 in IL (top 49%) — low school quality limits family demand, transient renter base, plan for 1-2y turnover.
- Zoned schools: Evergreen Park High School (math 25% / reading 23%, grade F, #304 of 693 statewide, top 44%, 931 students, 0% FRL).
- Market conditions: 37 active listings in the ZIP; 5 comparable units currently listed for rent nearby; rentals at typical pace (median 17d on market — plan ~3-4 weeks tenant-placement turnaround); 6,272 units permitted in Cook County in 2024 (4,658 in 5+ unit buildings).
Forward outlook
- Local home prices are declining (-3.0%/yr); year-one equity from $3k of loan paydown is wiped out by about $12k of value loss. Plan a longer hold.
Negotiation context
- It's been on market 21 days — a 2% lower offer ($383k) is reasonable based on typical stale-listing flexibility.
- 7 sale attempts since 15y ago; this cycle's ask has dropped $28k (7%) from the opening price — seller is motivated, your offer sets the floor, not the list.
- Current owner paid $276k; 41% above their basis — modest negotiation headroom, anchor on the comps not their cost.
Risks & watch-outs
- Watch-outs: built in 1939 — expect roof / HVAC / electrical / plumbing capex.
Questions for the listing agent
- What do current leases actually rent for vs. the listed asking? Can we see a recent rent roll and the last 12 months of T-12 income?
- Built in 1939 — when were the roof, HVAC, electrical panel, plumbing, and water heater last replaced?
- Is there a deadline driving the sale (1031 exchange, divorce, estate, relocation)? That informs how much negotiation room exists.
- Schools are B-rated — typically a magnet for longer-tenancy family renters. What's the average tenant stay here, and is there a school-zone premium baked into asking?
- Crime grade is D in this area — have there been break-ins, vandalism, or insurance claims at this property in the last 3 years? What carrier currently insures it and at what premium?
- The area grade is low — what's the realistic commute time and amenity access for the typical tenant pool here? Any planned neighborhood developments (good or bad) we should know about?
- What's the average days-on-market for RENTAL listings here right now (not sales)? A rising rental-DOM trend means longer vacancies and softer asking-rent achievability than the comps imply.
- What's the recent tenant-quality profile in this submarket — average credit score on applications, eviction rate, late-payment / NSF rate, and stable-employment percentage? A property-management company in the area should have these aggregated.
- How much new for-sale + rental construction is in the pipeline within 1–3 miles? Heavy new supply typically softens prices + rents 12–24 months out; constrained supply supports both.
Investment metrics
- 1% rule
- 0.58% ✗
- Cap rate
- 3.86%
- Cash-on-cash
- -8.69%
- DSCR
- 0.61
- GRM
- 14.5
CMA / ARV
- ARV (on-the-fly)
- $306,614
- Comps found
- 12
Show comp detail 12 sales within ~0.75 mi
| Address | Dist | Beds/Ba | Sqft | Sold | Price | $/sf | Match |
|---|---|---|---|---|---|---|---|
| 9247 S Ridgeway Ave | 0.35mi | 3/1.5 (+1) | 1,258 (-1%) | 0mo | $375,000 | $298 | 77 |
| 9240 S Trumbull Ave | 0.07mi | 3/2.0 (+1) | 1,137 (-10%) | 5mo | $275,000 | $242 | 69 |
| 9258 S Albany Ave | 0.45mi | 3/1.0 (+1) | 1,250 (-1%) | 4mo | $295,000 | $236 | 66 |
| 9219 S Spaulding Ave | 0.22mi | 3/1.0 (+1) | 1,156 (-9%) | 4mo | $285,000 | $247 | 64 |
| 9100 S Saint Louis Ave | 0.16mi | 3/1.5 (+1) | 1,417 (+12%) | 6mo | $247,000 | $174 | 63 |
| 9117 S Saint Louis Ave | 0.12mi | 3/1.0 (+1) | 1,099 (-13%) | 5mo | $203,000 | $185 | 61 |
| 9602 S Troy Ave | 0.62mi | 3/2.0 (+1) | 1,256 (-1%) | 3mo | $380,000 | $303 | 60 |
| 9308 Utica Ave S | 0.52mi | 2/1.5 | 1,400 (+10%) | 6mo | $248,000 | $177 | 53 |
| 9252 S Sacramento Ave | 0.58mi | 3/2.0 (+1) | 1,198 (-5%) | 6mo | $325,000 | $271 | 52 |
| 9534 S Sacramento Ave | 0.71mi | 3/2.0 (+1) | 1,190 (-6%) | 1mo | $270,000 | $227 | 49 |
| 8759 S Troy Ave | 0.67mi | 3/3.0 (+1) | 1,400 (+10%) | 6mo | $280,000 | $200 | 35 |
| 8738 S Troy Ave | 0.69mi | 3/3.0 (+1) | 1,424 (+12%) | 2mo | $372,999 | $262 | 34 |
Match score weights: distance 35% · size 25% · config 20% · recency 20%. Top-matched comps best support the ARV.
Projected returns pro-forma
-3.0% appreciation · 3.0% rent growth · sell at horizon
- IRR
- -31.7%
- Equity multiple
- -0.04×
- Total profit
- $-113,313
- Equity at exit
- $58,001
- IRR
- -36.0%
- Equity multiple
- -0.50×
- Total profit
- $-163,541
- Equity at exit
- $33,634
Cash invested: $108,920 (down + closing). Projections, not guarantees.
Landlord ↔ Tenant lean methodology
- Overall (STATE)
- 43 Moderately Tenant-Leaning
- State Illinois
- 43 Moderately Tenant-Leaning · D+7
- County
- — inherits STATE
- City
- — inherits STATE
ZIP-level market 60805
- Home prices YoY
- -34.0%
- Active inventory
- 37
- Price-to-rent
- 14.5×
Monthly cashflow live
- Estimated rent
- $2,239 high interval (Pro) →
- Mortgage (P&I)
- −$2,040
- Tax from tax record
- −$355 /mo · $4,266/yr
- Insurance
- −$162
- HOA
- −$0
- Vacancy / Maint / Mgmt
- −$470
- Net cashflow
- $-789
Break-even live
UW: 25.0% down · 7.5% · 30yr · 1.5% tax · 5.0% vac · 8.0% maint · 8.0% mgmt
Financing live
Cash to close
- Down payment
- $97,250
- Closing costs
- $11,670
- Reserves months
- —
- Total cash needed
- —
Loan-product check · same deal, 3 products live
Conventional
25% down · 7.5% · 30yr
- Down + closing
- —
- Monthly P&I
- —
- Monthly cashflow
- —
- DSCR
- —
- Eligible?
- —
Personal DTI + credit; lowest rate.
DSCR
20% down · 8.5% · 30yr
- Down + closing
- —
- Monthly P&I
- —
- Monthly cashflow
- —
- DSCR
- —
- Eligible?
- —
No personal income docs; deal must DSCR.
Hard money
10% down · 12.0% · 12mo
- Down + closing
- —
- Monthly P&I
- —
- Monthly cashflow
- —
- DSCR
- —
- Eligible?
- —
Short-term bridge; refi at stabilization.
Rent comps 5 comps
| Address | Beds | Baths | Sqft | Rent | $/sqft | DOM | Units | Dist |
|---|---|---|---|---|---|---|---|---|
| 9305 S Homan Ave Unit 1 Evergreen Park, IL | 3.0 | 1.0 | 893 | $2,195 | $2.46 | 16d | 1 | 0.15mi |
| 9600 S Komensky Ave Oak Lawn, IL | 2.0 | 2.0 | 900 | $1,800 | $2.00 | 24d | 1 | 0.93mi |
| 8755 S Fairfield Ave Evergreen Park, IL | 3.0 | 1.5 | 1463 | $2,900 | $1.98 | 4d | 1 | 1.04mi |
| 9515 S Kildare Ave Oak Lawn, IL | 1.0 | 1.0 | 950 | $1,275 | $1.34 | 24d | 1 | 1.14mi |
| 8138 S Kedzie Ave Unit 1546084P Chicago, IL | 2.0 | 1.0 | 1399 | $3,161 | $2.26 | 7d | 1 | 1.34mi |
Listing history 40 events
-
2026-06-18days on market $389,000 Active 21 DOM
-
2026-06-17days on market $389,000 Active 20 DOM
-
2026-06-16days on market $389,000 Active 19 DOM
-
2026-06-15days on market $389,000 Active 18 DOM
-
2026-06-13days on market $389,000 Active 16 DOM
-
2026-06-13days on market $389,000 Active 15 DOM
-
2026-06-09days on market $389,000 Active 12 DOM
-
2026-06-08days on market $389,000 Active 11 DOM
-
2026-06-07days on market $389,000 Active 10 DOM
-
2026-06-04days on market $389,000 Active 7 DOM
-
2026-06-03days on market $389,000 Active 6 DOM
-
2026-06-02days on market $389,000 Active 5 DOM
-
2026-06-01days on market $389,000 Active 4 DOM
-
2026-05-31days on market $389,000 Active 3 DOM
-
2026-05-23price $389,000
-
2026-04-12price $399,999
-
2026-01-06historical
-
2026-01-05$416,500 Active
-
2025-11-04Active
-
2025-11-04historical
-
2025-10-10Active
-
2018-09-19soldstatus $276,000
-
2018-08-31soldstatus $276,000 Closed Sale
-
2018-08-20status Pending
-
2018-07-12status Contingent (Do Not Show)
-
2018-07-09$265,000 New
-
2014-12-08soldstatus $236,000
-
2014-11-03soldstatus $236,000 Closed Sale
-
2014-10-31status Pending
-
2014-09-11historical Contingent
-
2014-08-16price $239,900 Price Change
-
2014-06-25price $249,900 Price Change
-
2014-05-22$259,900 New
-
2012-04-02historical
-
2011-12-31New
-
2011-12-31historical
-
2011-10-03price Price Change
-
2011-03-02New
-
2007-08-03soldstatus $248,000
-
1987-08-03soldstatus $82,000
ⓘ Source: listings_history table (triggers on properties + properties_extension) + one-shot
backfill from property_details.listing_events for pre-trigger history.
Tax reassessment forecast IL · Partial reset (capped growth)
- Current annual tax
- $4,266 · $355/mo
- Projected year-2 tax
- $6,548 · $546/mo
- Expected delta
- +$2,282/yr (+$190/mo · 53.5%)
ⓘ Screening estimate from a state-policy table — verify with the county assessor before closing.
Climate risk First Street
- Flood 1/10 Low FEMA zone X (unshaded) · 0% chance over 30 yrs
- Wildfire 1/10 Low
- Heat 3/10 Moderate 7 d/yr ≥102°F today · 15 d/yr by 30 yrs out
- Wind 2/10 Low
- Air quality 4/10 Moderate 4 unhealthy d/yr today · 6 by 30 yrs out
Nearby sold comps map
Loading sold comps map…
Walkable amenities ~0.75 mi
Loading nearby amenities…
Taxation est. · year 1
- Rental income
- $26,869
- − Mortgage interest
- −$21,790
- − Property taxes
- −$4,266
- − Insurance
- −$1,945
- − Repairs & maintenance
- −$2,149
- − Management
- −$2,149
- − Depreciation
- −$11,316
- Taxable loss
- −$16,748
- Est. tax savings @ 24.0%
- +$4,019
- After-tax cash flow
- $-5,445/yr
For passive investors: Depreciation is non-cash, so a rental often shows a tax loss while cash-flowing — sheltering income. Rental losses are passive: they offset passive income freely, and up to $25,000/yr can offset ordinary (W-2) income if you actively participate and your MAGI is under $100k (phasing out to $0 by $150k); unused losses carry forward. On sale, claimed depreciation is recaptured at up to 25%, and gains may owe capital-gains tax (a 1031 exchange can defer both). Figures are a year-1 estimate at your 24.0% rate — not tax advice; consult a CPA.
Schools (NCES district)
- District
- Evergreen Park Chsd 231
- NCES district ID
- 1714580
- Math proficiency
- 25% ▼ -10.00%
- Reading proficiency
- 23% ▼ -12.00%
- Median HH income
- $64,735
- Composite
- 22.65/100
- National rank
- #8054
- State rank
- #303 of 620 in IL
Livability — Evergreen Park
- Score
- 87/100
- State rank
- #14
- US rank
- #327
Category grades
Schools grade is shown separately in the Schools card above.
Census & demographics
- Census place
- Evergreen Park, IL
- City population
- 19,498
- Population (ZIP)
- 19,498
Population outlook (Cook County) Hauer SSP2
- Today (2025)
- 5,347,519 people
- By 2030
- 5,357,703 · +0.2%
- By 2040
- 5,324,924 · -0.4%
- By 2050
- 5,230,762 · -2.2%
- By 2075
- 4,785,735 · -10.5%
- By 2100
- 4,188,836 · -21.7%
Race, ethnicity, and origin ACS 2023
- Neighborhood character
- Diverse neighborhood (Simpson 0.63)
- Race & ethnicity
- White 53% Black 22% Hispanic / Latino 18% Two or more races 10% Asian 3%
- Hispanic origin (detail)
- Mexican 16% Cuban 1%
- Common ancestry
- Romanian 8% Iranian 1% Lithuanian 1%
- Foreign-born
- 10% · Canada, Jamaica
- Languages at home
- 83% English-only · Spanish 12% Other Indo-European 1% Tagalog/Filipino 1%
Political lean MEDSL · Cook
- 2024 margin
- Solid D (+42.0) · D 70.4% · R 28.4% · Other 1.2%
- 2008→2024 swing
- -11.4pp toward R · 2008: 53.4pp · 2024: 42.0pp
- All cycles
- 2024: D+42.0 2020: D+50.3 2016: D+53.0 2012: D+49.4 2008: D+53.4
Not yet ingested
- Civics
- —
Market trends
- HPI YoY
- ▼ -118.60%
- Current HPI
- 229.8185
- Rent YoY
- —
- Metro
- —
- State GDP YoY
- ▲ 1.59%
- F500 in state
- 60
Industry mix (Fortune 500 HQ in IL)
| Industry | F500 HQs | Revenue |
|---|---|---|
| Insurance | 4 | $201B |
|
||
| Consumer Goods | 4 | $87B |
|
||
| Industrial Machinery | 3 | $64B |
|
||
| Healthcare | 2 | $55B |
|
||
| Retail / Pharmacy | 1 | $148B |
|
||
| Agriculture / Food | 1 | $86B |
|
||
Price history
+374.4% since first listed26 events — show timeline
- 2026-05-23 Price Changed $389,000 MRED as Distributed by MLS Grid
- 2026-04-12 Price Changed $399,999 MRED as Distributed by MLS Grid
- 2026-01-06 Listing Removed — MRED as Distributed by MLS Grid
- 2026-01-05 Listed $416,500 MRED as Distributed by MLS Grid
- 2025-11-04 Listing Removed — MRED as Distributed by MLS Grid
- 2025-11-04 Listed — MRED as Distributed by MLS Grid
- 2025-10-10 Listed — MRED as Distributed by MLS Grid
- 2018-09-19 Sold (Public Records) $276,000 Public Records
- 2018-08-31 Sold (MLS) $276,000 MRED as Distributed by MLS Grid
- 2018-08-20 Pending — MRED as Distributed by MLS Grid
- 2018-07-12 Pending — MRED as Distributed by MLS Grid
- 2018-07-09 Listed $265,000 MRED as Distributed by MLS Grid
- 2014-12-08 Sold (Public Records) $236,000 Public Records
- 2014-11-03 Sold (MLS) $236,000 MRED as Distributed by MLS Grid
- 2014-10-31 Pending — MRED as Distributed by MLS Grid
- 2014-09-11 Contingent — MRED as Distributed by MLS Grid
- 2014-08-16 Price Changed $239,900 MRED as Distributed by MLS Grid
- 2014-06-25 Price Changed $249,900 MRED as Distributed by MLS Grid
- 2014-05-22 Listed $259,900 MRED as Distributed by MLS Grid
- 2012-04-02 Listing Removed — MRED as Distributed by MLS Grid
- 2011-12-31 Listed — MRED as Distributed by MLS Grid
- 2011-12-31 Listing Removed — MRED as Distributed by MLS Grid
- 2011-10-03 Price Changed — MRED as Distributed by MLS Grid
- 2011-03-02 Listed — MRED as Distributed by MLS Grid
- 2007-08-03 Sold (Public Records) $248,000 Public Records
- 1987-08-03 Sold (Public Records) $82,000 Public Records
Property tax history
+6.1%/yrLatest (2023): $4,266 · -12.6% YoY. Source: county tax records.
Cash-flow waterfall
monthlySold comps — $/sqft
last 12 mo · ≤1 miLoading sold comps…