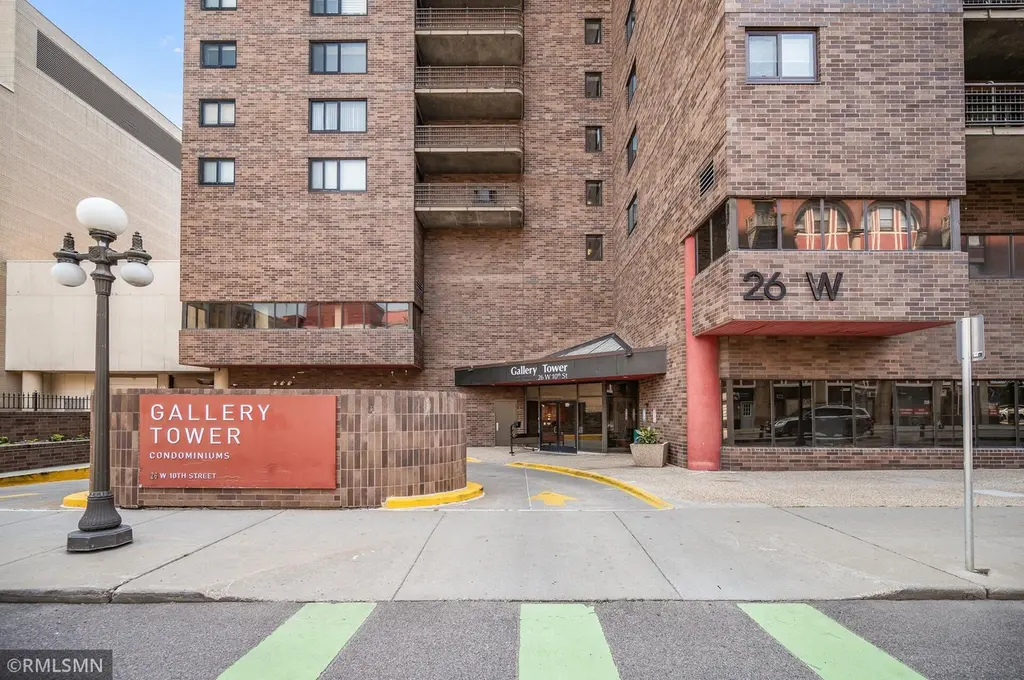
26 10th St W #803 · St. Paul, MN
Flood risk 1/10 · Minimal
- FEMA flood zone
- X (unshaded)
- Chance of flooding over 30 yrs
- 0.0%
- Est. flood insurance / yr
- $473 – $860
Fire risk 1/10 · Minimal
- Est. fire insurance / yr
- $888 – $1,650
Heat risk 2/10 · Minimal
- Hot days now (above 99°F)
- 7 days/yr
- Hot days in 30 yrs
- 14 days/yr
Wind risk 2/10 · Minimal
- Chance of severe wind over 30 yrs
- —
Air-quality risk 2/10 · Minimal
- Unhealthy air days now
- 1 days/yr
- Unhealthy air days in 30 yrs
- 1 days/yr
Risk factors via First Street. Map © Google.
Why this score? — see what drove the B- grade
The composite is a weighted blend of 9 inputs, each scored 0–100. Each bar is that input's sub-score; the figure is the points it added to the 100-point composite (weight × sub-score).
- Cash flow +28.3/30.0
- 1% rule +10.0/10.0
- DSCR +10.0/10.0
- ARV discount +7.5/15.0
- Rent growth +2.9/5.0
- Livability +2.5/5.0
- Condition / age +2.5/5.0
- Schools +2.4/10.0
- Appreciation +0.0/10.0
$79,900
🖨 Deal sheet 📄 Offer letter ✓ Due diligence
Listing remarks
Bring your vision and craft your own modern masterpiece. This comfortable 1-bedroom condo offers a rare opportunity in the center of it all. Whether you’re looking to build equity or design your dream urban retreat, this space is ready for you! Step outside and immerse yourself in the best of Downtown St. Paul. You are steps from: local coffee shops, dining, theaters, ball park, history, science , Grand Casino arena, bike paths, river trails and the greenery of Mears park and Rice Park! Assoc fee includes; heat, AC, water, trash, cable, and high-speed internet. Don’t miss this opportunity to define luxury on your own terms.
Key facts
- Theaters
- Modern masterpiece
- Local coffee shops
Tags
Property features AI
Finance
- Other: Public maintained roads with city street frontage, curbs, sidewalks and street lights
- HOA & community: HOA managed by Cedar Management; Monthly association fee; Association fee covers air conditioning, cable TV, controlled access, hazard insurance, internet, grounds maintenance, professional management, sewer, shared amenities, snow removal and water; Association amenities include laundry, elevator(s), lobby entrance, sauna, community room, exercise room and guest suite
Exterior
- Parking: Attached garage; Underground parking; Additional onsite parking available for a fee; Unassigned parking
- Security: Controlled access; Fire sprinkler system
- Utilities: City water connected; City sewer connected; Electric with circuit breakers; Xcel Energy power; Other fuel
- Home design: Residential attached property; One level (single story); Accessible elevator installed; No stairs internal and external
- Construction: Concrete floors and walls
- Exterior features: Stone exterior; City view; Indoor sprinklers; Patio; Deck
Interior
- Kitchen: Kitchen on main level
- Bedrooms: 1 bedroom on main level
- Flooring: Tile floors
- Bathrooms: 1 full bathroom on main level
- Heating & cooling: Central air; Other heating
- Interior features: All living facilities on one level; Main floor primary bedroom; Main floor laundry; Living/Dining room; Deck
- Laundry & utility: Shared laundry in common area
Neighborhood map
What this means for you Summary
Snapshot
- This is a 1-bed/1.0-bath condo listed at $80k.
Deal economics
- At list price, monthly cash flow is $255 ($3k/yr) — positive.
- The deal already cash-flows at list — no discount required.
- Meets the 1% rule at list price ($2k rent vs $80k).
- Recommended offer: $78k (3.0% below list) — sets the bar for market timing.
Location & tenants
- Location reads: area grade B — affects rentability + tenant quality, not the cash-flow math above.
- St. Paul Public School District (urban): math 21% / reading 33% proficiency, ranked #270 of 301 in MN (top 90%) — low school quality limits family demand, transient renter base, plan for 1-2y turnover; 64% free/reduced lunch — lower-income household profile, screen leases tightly.
- Market conditions: Rents rising (+1.6%/yr); 145 active listings in the ZIP; 11 comparable units currently listed for rent nearby; rentals leasing fast (median 2d on market — plan ~1-2 weeks tenant-placement turnaround); solid renter incomes; 1,202 units permitted in Ramsey County in 2024 (880 in 5+ unit buildings).
Forward outlook
- Local home prices are declining (-3.0%/yr); year-one equity from $552 of loan paydown is wiped out by about $2k of value loss. Plan a longer hold.
- Ramsey County population projected at +27% by 2050 — long-run rental-demand tailwind backs the buy-and-hold thesis.
Negotiation context
- It's been on market 48 days — a 3% lower offer ($78k) is reasonable based on typical stale-listing flexibility.
- 5 sale attempts since 37y ago with the ask held roughly flat each time — persistent listings suggest the price (not the market) is what's stuck; bring a comps-based counter.
- Current owner paid $34k; list at $80k implies a 133% gain — meaningful room to come down on a strong offer.
Risks & watch-outs
- Watch-outs: HOA is 32% of rent.
Questions for the listing agent
- It's been on market 48 days. Have you received any prior offers? Is the seller open to a 3% concession, seller financing, or rate buy-down credit?
- What does the HOA fee cover, when was the last increase, and are there any pending special assessments or reserve-fund shortfalls?
- Any open or pending special assessments — roof, HVAC, plumbing, elevator, façade? What's the per-unit balance and payoff schedule, and is the seller paying it off at close or rolling it to the buyer?
- Is there a deadline driving the sale (1031 exchange, divorce, estate, relocation)? That informs how much negotiation room exists.
- What's the average days-on-market for RENTAL listings here right now (not sales)? A rising rental-DOM trend means longer vacancies and softer asking-rent achievability than the comps imply.
- What's the recent tenant-quality profile in this submarket — average credit score on applications, eviction rate, late-payment / NSF rate, and stable-employment percentage? A property-management company in the area should have these aggregated.
- How much new apartment / multifamily construction is in the pipeline within 1–3 miles? Heavy new supply (>2% of stock underway) typically softens rents 12–24 months out; light construction supports rent growth.
Investment metrics
- 1% rule
- 2.19% ✓
- Cap rate
- 10.13%
- Cash-on-cash
- 13.70%
- DSCR
- 1.61
- GRM
- 3.8
CMA / ARV
No comps found within radius.
Projected returns pro-forma
-3.0% appreciation · 1.6% rent growth · sell at horizon
- IRR
- 1.5%
- Equity multiple
- 1.06×
- Total profit
- $1,270
- Equity at exit
- $11,913
- IRR
- 8.9%
- Equity multiple
- 1.62×
- Total profit
- $13,893
- Equity at exit
- $6,908
Cash invested: $22,372 (down + closing). Projections, not guarantees.
Landlord ↔ Tenant lean methodology
- Overall (STATE)
- 46 Balanced
- State Minnesota
- 46 Balanced · D+2
- County
- — inherits STATE
- City
- — inherits STATE
ZIP-level market 55102
- Rents YoY
- 1.6%
- Active inventory
- 145
- Price-to-rent
- 3.8×
Monthly cashflow live
- Estimated rent
- $1,752 high interval (Pro) →
- Mortgage (P&I)
- −$419
- Tax from tax record
- −$117 /mo · $1,404/yr
- Insurance
- −$33
- HOA
- −$559
- Vacancy / Maint / Mgmt
- −$368
- Net cashflow
- $255
Break-even live
UW: 25.0% down · 7.5% · 30yr · 1.5% tax · 5.0% vac · 8.0% maint · 8.0% mgmt
Financing live
Cash to close
- Down payment
- $19,975
- Closing costs
- $2,397
- Reserves months
- —
- Total cash needed
- —
Loan-product check · same deal, 3 products live
Conventional
25% down · 7.5% · 30yr
- Down + closing
- —
- Monthly P&I
- —
- Monthly cashflow
- —
- DSCR
- —
- Eligible?
- —
Personal DTI + credit; lowest rate.
DSCR
20% down · 8.5% · 30yr
- Down + closing
- —
- Monthly P&I
- —
- Monthly cashflow
- —
- DSCR
- —
- Eligible?
- —
No personal income docs; deal must DSCR.
Hard money
10% down · 12.0% · 12mo
- Down + closing
- —
- Monthly P&I
- —
- Monthly cashflow
- —
- DSCR
- —
- Eligible?
- —
Short-term bridge; refi at stabilization.
Rent comps 11 comps
| Address | Beds | Baths | Sqft | Rent | $/sqft | DOM | Units | Dist |
|---|---|---|---|---|---|---|---|---|
| 101 10th St E Saint Paul, MN | 3.0 | 1.0–2.0 | 887 | $1,611 | $1.82 | 2d | 25 | 0.24mi |
| 253 Kellogg Blvd W Saint Paul, MN | 2.0 | 1.0–2.0 | 1208 | $2,226 | $1.84 | 2d | 12 | 0.29mi |
| 141 4th St E Saint Paul, MN | 2.0 | 1.0–2.0 | 811 | $1,776 | $2.19 | 20d | 20 | 0.48mi |
| 111 Kellogg Blvd E Saint Paul, MN | 3.0 | 1.0–2.0 | 1000 | $1,749 | $1.75 | 1d | 20 | 0.50mi |
| 333 Sibley St Saint Paul, MN | 3.0 | 1.0–2.0 | 1358 | $1,884 | $1.39 | 10d | 10 | 0.53mi |
| 240 5th St E St Paul, MN | 2.0 | 1.0–2.0 | 949 | $2,038 | $2.15 | 2d | 10 | 0.58mi |
| 250 6th St E St Paul, MN | 2.0 | 1.0–2.0 | 980 | $2,108 | $2.15 | 1d | 16 | 0.58mi |
| 180 E Kellogg Blvd St Paul, MN | 3.0 | 1.0–2.5 | 1436 | $2,338 | $1.63 | 1d | 22 | 0.61mi |
| 330 9th St E St Paul, MN | 1.0–2.0 | 1.0 | 978 | $1,445 | $1.48 | 3d | 3 | 0.64mi |
| 255 Western Ave N Saint Paul, MN | 3.0 | 1.0–2.0 | 1049 | $2,181 | $2.08 | 1d | 23 | 0.87mi |
| 400 Spring St Saint Paul, MN | 1.0–2.0 | 1.0–2.0 | 1205 | $1,500 | $1.24 | 3d | 31 | 0.93mi |
HOA detail condo
- Monthly dues
- $559 · $6,708/yr
- Likely covers
- watertrashinternetcable
- Assessments
- None detected in remarks — confirm with the listing agent.
Listing history 25 events
-
2026-06-18days on market $79,900 Active 48 DOM
-
2026-06-17days on market $79,900 Active 47 DOM
-
2026-06-16days on market $79,900 Active 46 DOM
-
2026-06-15days on market $79,900 Active 45 DOM
-
2026-06-13days on market $79,900 Active 43 DOM
-
2026-06-09days on market $79,900 Active 39 DOM
-
2026-06-08days on market $79,900 Active 38 DOM
-
2026-06-07days on market $79,900 Active 37 DOM
-
2026-06-04days on market $79,900 Active 34 DOM
-
2026-06-03days on market $79,900 Active 33 DOM
-
2026-06-02days on market $79,900 Active 32 DOM
-
2026-06-01days on market $79,900 Active 31 DOM
-
2026-05-31days on market $79,900 Active 30 DOM
-
2026-04-30$79,900 Active 646-char remark
-
1998-05-18soldstatus $34,250
-
1998-03-27soldstatus $34,250
-
1998-02-05historical
-
1998-01-29$35,900
-
1994-12-29soldstatus $27,000
-
1994-10-24historical
-
1994-04-16$31,900
-
1993-12-31historical
-
1993-04-01$31,900
-
1992-12-31historical
-
1989-12-18$35,900
ⓘ Source: listings_history table (triggers on properties + properties_extension) + one-shot
backfill from property_details.listing_events for pre-trigger history.
Tax reassessment forecast MN · Partial reset (capped growth)
- Current annual tax
- $1,404 · $117/mo
- Projected year-2 tax
- $1,404 · $117/mo
- Expected delta
- $0/yr ($0/mo · 0.0%)
ⓘ Screening estimate from a state-policy table — verify with the county assessor before closing.
Climate risk First Street
- Flood 1/10 Low FEMA zone X (unshaded) · 0% chance over 30 yrs
- Wildfire 1/10 Low
- Heat 2/10 Low 7 d/yr ≥99°F today · 14 d/yr by 30 yrs out
- Wind 2/10 Low
- Air quality 2/10 Low 1 unhealthy d/yr today · 1 by 30 yrs out
Nearby sold comps map
Loading sold comps map…
Walkable amenities ~0.75 mi
Loading nearby amenities…
Taxation est. · year 1
- Rental income
- $21,019
- − Mortgage interest
- −$4,476
- − Property taxes
- −$1,404
- − Insurance
- −$400
- − Repairs & maintenance
- −$1,682
- − Management
- −$1,682
- − HOA
- −$6,708
- − Depreciation
- −$2,324
- Taxable income
- $2,344
- Est. tax owed @ 24.0%
- −$563
- After-tax cash flow
- $2,503/yr
For passive investors: Depreciation is non-cash, so a rental often shows a tax loss while cash-flowing — sheltering income. Rental losses are passive: they offset passive income freely, and up to $25,000/yr can offset ordinary (W-2) income if you actively participate and your MAGI is under $100k (phasing out to $0 by $150k); unused losses carry forward. On sale, claimed depreciation is recaptured at up to 25%, and gains may owe capital-gains tax (a 1031 exchange can defer both). Figures are a year-1 estimate at your 24.0% rate — not tax advice; consult a CPA.
Schools (NCES district)
- District
- St. Paul Public School District
- NCES district ID
- 2733840
- Math proficiency
- 21% ▼ -11.00%
- Reading proficiency
- 33% ▼ -7.00%
- Median HH income
- $48,316
- Composite
- 23.51/100
- National rank
- #7868
- State rank
- #270 of 301 in MN
Livability — St. Paul
No livability data for this city. (Only ~50 U.S. cities are tracked.)
Census & demographics
- Census place
- St. Paul, MN
- County
- Ramsey County · 542,837 people
- City population
- 280,599
- Metro
- Minneapolis-St. Paul-Bloomington, MN-WI
- Population (ZIP)
- 19,630
- Household income
- $76,406
- Rent vs Own
- Severe rent burden
- 1116.0
Population outlook (Ramsey County) Hauer SSP2
- Today (2025)
- 603,431 people
- By 2030
- 636,459 · +5.5%
- By 2040
- 700,596 · +16.1%
- By 2050
- 765,819 · +26.9%
- By 2075
- 929,297 · +54.0%
- By 2100
- 1,053,924 · +74.7%
Race, ethnicity, and origin ACS 2023
- Neighborhood character
- Predominantly White (77%)
- Race & ethnicity
- White 77% Black 10% Two or more races 6% Hispanic / Latino 5% Asian 3%
- Hispanic origin (detail)
- Mexican 4%
- Common ancestry
- Portuguese 10% Lithuanian 5% Romanian 3%
- Foreign-born
- 9% · Canada, South Korea
- Languages at home
- 87% English-only · Spanish 4% Other Indo-European 1% German/W. Germanic 1%
Political lean MEDSL · Ramsey
- 2024 margin
- Solid D (+43.3) · D 70.5% · R 27.2% · Other 2.3%
- 2008→2024 swing
- +9.4pp toward D · 2008: 33.9pp · 2024: 43.3pp
- All cycles
- 2024: D+43.3 2020: D+45.4 2016: D+39.4 2012: D+35.3 2008: D+33.9
Not yet ingested
- Civics
- —
Market trends
- HPI YoY
- ▼ -217.83%
- Current HPI
- 241.7112
- Rent YoY
- ▲ 1.60%
- Metro
- Minneapolis-St. Paul-Bloomington, MN-WI
- State GDP YoY
- ▲ 2.41%
- F500 in state
- 34
Industry mix (Fortune 500 HQ in MN)
| Industry | F500 HQs | Revenue |
|---|---|---|
| Healthcare | 2 | $407B |
|
||
| Retail | 2 | $150B |
|
||
| Consumer Goods | 2 | $32B |
|
||
| Industrial Machinery | 2 | $6B |
|
||
| Agriculture | 1 | $40B |
|
||
| Healthcare / Medical Devices | 1 | $32B |
|
||
Price history
+122.6% since first listed12 events — show timeline
- 2026-04-30 Listed $79,900 NORTHSTARMLS as Distributed by MLS Grid
- 1998-05-18 Sold (Public Records) $34,250 Public Records
- 1998-03-27 Sold (MLS) $34,250 NORTHSTARMLS as Distributed by MLS Grid
- 1998-02-05 Listing Removed — NORTHSTARMLS as Distributed by MLS Grid
- 1998-01-29 Listed $35,900 NORTHSTARMLS as Distributed by MLS Grid
- 1994-12-29 Sold (MLS) $27,000 NORTHSTARMLS as Distributed by MLS Grid
- 1994-10-24 Listing Removed — NORTHSTARMLS as Distributed by MLS Grid
- 1994-04-16 Listed $31,900 NORTHSTARMLS as Distributed by MLS Grid
- 1993-12-31 Listing Removed — NORTHSTARMLS as Distributed by MLS Grid
- 1993-04-01 Listed $31,900 NORTHSTARMLS as Distributed by MLS Grid
- 1992-12-31 Listing Removed — NORTHSTARMLS as Distributed by MLS Grid
- 1989-12-18 Listed $35,900 NORTHSTARMLS as Distributed by MLS Grid
Property tax history
+7.5%/yrLatest (2025): $1,404 · +1.7% YoY. Source: county tax records.
Cash-flow waterfall
monthlySold comps — $/sqft
last 12 mo · ≤1 miLoading sold comps…