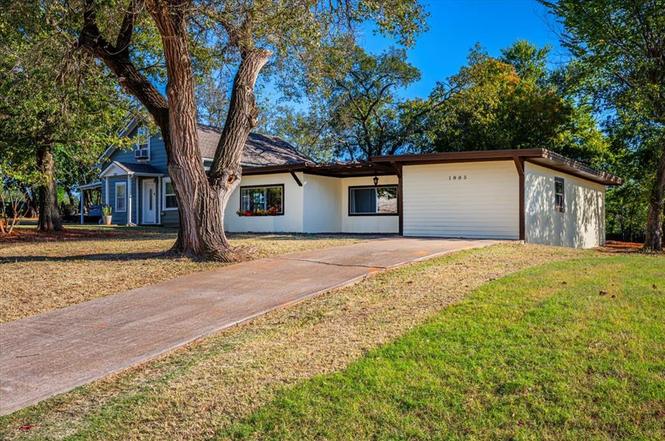
1805 E University Ave · Guthrie, OK
Flood risk 1/10 · Minimal
- FEMA flood zone
- X (unshaded)
- Chance of flooding over 30 yrs
- 0.0%
- Est. flood insurance / yr
- $507 – $1,088
Fire risk 5/10 · Moderate
- Est. fire insurance / yr
- $2,463 – $4,575
Heat risk 5/10 · Moderate
- Hot days now (above 109°F)
- 7 days/yr
- Hot days in 30 yrs
- 18 days/yr
Wind risk 2/10 · Minimal
- Chance of severe wind over 30 yrs
- 4.0%
Air-quality risk 2/10 · Minimal
- Unhealthy air days now
- 2 days/yr
- Unhealthy air days in 30 yrs
- 2 days/yr
Risk factors via First Street. Map © Google.
Why this score? — see what drove the C grade
The composite is a weighted blend of 9 inputs, each scored 0–100. Each bar is that input's sub-score; the figure is the points it added to the 100-point composite (weight × sub-score).
- Cash flow +21.3/30.0
- ARV discount +11.8/15.0
- DSCR +6.8/10.0
- Rent growth +5.0/5.0
- 1% rule +4.6/10.0
- Livability +3.7/5.0
- Condition / age +2.5/5.0
- Schools +2.1/10.0
- Appreciation +0.0/10.0
$175,000
🖨 Deal sheet 📄 Offer letter ✓ Due diligence
Listing remarks
Remodeled Home in the Heart of Guthrie! This beautifully remodeled home is move-in ready and ideally located just minutes from historic downtown Guthrie and I-35, offering an easy commute to Edmond or Stillwater. Recent updates include: • All new plumbing • New septic tank • New central HVAC system with high-efficiency furnace • New energy-efficient windows • New flooring throughout • Fresh interior and exterior paint • Custom tile surround shower • Tile backsplashes in kitchen and bathroom • New lighting fixtures and ceiling fans • New electrical plugs, switches, and upgraded electrical panel • Newly built deck—perfect for outd
Key facts
- New plumbing
- New flooring
- New septic tank
Tags
Property features AI
Finance
- Other: Living area approximately 1,256 (assessor); Corner lot on the south side of the road (directions available); No storm shelter; Homestead not indicated
- Financial info: Not assumable
- HOA & community: No mandatory association dues
Exterior
- Utilities: Public utilities
- Home design: Single family residence; One level; North-facing
- Construction: Brick and frame construction; Other roof type; Conventional foundation; Built (existing property)
- Exterior features: Open deck; Interior lot
Interior
- Kitchen: Free standing range (gas); Free standing oven (electric)
- Bedrooms: 3 bedrooms
- Flooring: Vinyl flooring
- Bathrooms: 1 full bathroom
- Interior features: Ceiling fans; Window treatments
Neighborhood map
What this means for you Summary
Snapshot
- This is a 3-bed/1.0-bath single-family listed at $175k.
Deal economics
- At list price, monthly cash flow is $257 ($3k/yr) — positive.
- The deal already cash-flows at list — no discount required.
- To meet the 1% rule (rent ≥ 1% of price), the offer needs to be $169k (3.6% below list).
- Recommended offer: $154k (12.0% below list) — sets the bar for market timing.
- Cap rate 8.1% vs local median 3.0% in Guthrie — top-decile yield for the area; either an underpriced asset or a hidden risk that comps aren't pricing in. Stress-test before assuming the spread holds.
Location & tenants
- Location reads 74/100 on livability (#15 in OK, #4,696 nationally) — a middle-class / working-renter tenant base. Strengths: cost of living A+, housing A+, health & safety A+; Watch: amenities F, commute F.
- Guthrie (town): math 24% / reading 24% proficiency, ranked #119 of 270 in OK (top 44%) — low school quality limits family demand, transient renter base, plan for 1-2y turnover.
- Zoned schools: Guthrie Hs (math 22% / reading 32%, grade F, #125 of 447 statewide, top 31%, 1,025 students, 0% FRL) — zoned schools average 0% FRL vs 55% district-wide (55 pts lower); this property's tenant base skews higher-income than the district average.
- Market conditions: Rents rising fast (+12.2%/yr); 843 active listings in the ZIP; 6 comparable units currently listed for rent nearby; rentals leasing fast (median 3d on market — plan ~1-2 weeks tenant-placement turnaround); 102 units permitted in Logan County in 2024 (0 in 5+ unit buildings).
Forward outlook
- Local home prices are declining (-3.0%/yr); year-one equity from $1k of loan paydown is wiped out by about $5k of value loss. Plan a longer hold.
- Logan County population projected at +36% by 2050 — long-run rental-demand tailwind backs the buy-and-hold thesis.
- At projected returns (-3.0% appreciation + 8.0% rent growth), your $49k cash investment doubles in ~9 years — after that, you're playing with house money.
Negotiation context
- It's been on market 222 days — a 12% lower offer ($154k) is reasonable based on typical stale-listing flexibility.
- 6 sale attempts since 14y ago; this cycle's ask has dropped $20k (10%) from the opening price — seller is motivated, your offer sets the floor, not the list.
- Current owner paid $77k; list at $175k implies a 127% gain — meaningful room to come down on a strong offer.
Risks & watch-outs
- Climate carrying-cost: moderate wildfire risk; extreme-heat days projected 7→18/yr by 2055 (HVAC capex compounding) — expect insurance premiums to compound above CPI over the hold.
Questions for the listing agent
- It's been on market 222 days. Have you received any prior offers? Is the seller open to a 12% concession, seller financing, or rate buy-down credit?
- Built in 1964 — when were the roof, HVAC, electrical panel, plumbing, and water heater last replaced?
- Why hasn't it sold? Are there any deal-killer items the seller is aware of (foundation, flood, title, zoning, code violations)?
- Is there a deadline driving the sale (1031 exchange, divorce, estate, relocation)? That informs how much negotiation room exists.
- Schools are F-rated, which usually means shorter tenancies and higher turnover. Who's the typical renter profile here, and what's been the actual vacancy rate?
- What's the average days-on-market for RENTAL listings here right now (not sales)? A rising rental-DOM trend means longer vacancies and softer asking-rent achievability than the comps imply.
- What's the recent tenant-quality profile in this submarket — average credit score on applications, eviction rate, late-payment / NSF rate, and stable-employment percentage? A property-management company in the area should have these aggregated.
- How much new for-sale + rental construction is in the pipeline within 1–3 miles? Heavy new supply typically softens prices + rents 12–24 months out; constrained supply supports both.
Investment metrics
- 1% rule
- 0.96% ✗
- Cap rate
- 8.05%
- Cash-on-cash
- 6.29%
- DSCR
- 1.28
- GRM
- 8.6
CMA / ARV
- ARV (on-the-fly)
- $193,424
- Comps found
- 12
Show comp detail 12 sales within ~0.75 mi
| Address | Dist | Beds/Ba | Sqft | Sold | Price | $/sf | Match |
|---|---|---|---|---|---|---|---|
| 1211 Colt Dr | 0.46mi | 3/2.0 | 1,259 (+0%) | 1mo | $199,943 | $159 | 73 |
| 1112 Colt Dr | 0.46mi | 3/2.0 | 1,248 (-1%) | 0mo | $198,390 | $159 | 73 |
| 1117 Colt Dr | 0.46mi | 3/2.0 | 1,248 (-1%) | 1mo | $189,000 | $151 | 73 |
| 1201 Colt Dr | 0.46mi | 3/2.0 | 1,248 (-1%) | 1mo | $192,150 | $154 | 73 |
| 1110 Colt Dr | 0.46mi | 3/2.0 | 1,373 (+9%) | 1mo | $217,910 | $159 | 58 |
| 1113 Colt Dr | 0.46mi | 3/2.0 | 1,373 (+9%) | 1mo | $204,665 | $149 | 58 |
| 1202 Colt Dr | 0.46mi | 3/2.0 | 1,373 (+9%) | 1mo | $204,960 | $149 | 58 |
| 1118 Colt Dr | 0.46mi | 3/2.0 | 1,373 (+9%) | 1mo | $201,750 | $147 | 58 |
| 1121 Colt Dr | 0.46mi | 3/2.0 | 1,373 (+9%) | 2mo | $207,650 | $151 | 57 |
| 1124 Colt Dr | 0.46mi | 3/2.0 | 1,402 (+12%) | 1mo | $218,649 | $156 | 54 |
| 1108 Colt Dr | 0.46mi | 3/2.0 | 1,402 (+12%) | 1mo | $235,005 | $168 | 54 |
| 1320 E Cleveland Ave | 0.69mi | 3/2.0 | 1,422 (+13%) | 2mo | $195,000 | $137 | 40 |
Match score weights: distance 35% · size 25% · config 20% · recency 20%. Top-matched comps best support the ARV.
Projected returns pro-forma
-3.0% appreciation · 8.0% rent growth · sell at horizon
- IRR
- -1.6%
- Equity multiple
- 0.94×
- Total profit
- $-3,140
- Equity at exit
- $26,093
- IRR
- 12.5%
- Equity multiple
- 2.20×
- Total profit
- $58,673
- Equity at exit
- $15,131
Cash invested: $49,000 (down + closing). Projections, not guarantees.
Landlord ↔ Tenant lean methodology
- Overall (STATE)
- 83 Strongly Landlord-Friendly
- State Oklahoma
- 83 Strongly Landlord-Friendly · R+20
- County
- — inherits STATE
- City
- — inherits STATE
ZIP-level market 73044
- Home prices YoY
- -25.9%
- Rents YoY
- 12.2%
- Active inventory
- 843
- Price-to-rent
- 8.6×
Monthly cashflow live
- Estimated rent
- $1,687 high interval (Pro) →
- Mortgage (P&I)
- −$918
- Tax from tax record
- −$85 /mo · $1,020/yr
- Insurance
- −$73
- HOA
- −$0
- Vacancy / Maint / Mgmt
- −$354
- Net cashflow
- $257
Break-even live
UW: 25.0% down · 7.5% · 30yr · 1.5% tax · 5.0% vac · 8.0% maint · 8.0% mgmt
Financing live
Cash to close
- Down payment
- $43,750
- Closing costs
- $5,250
- Reserves months
- —
- Total cash needed
- —
Loan-product check · same deal, 3 products live
Conventional
25% down · 7.5% · 30yr
- Down + closing
- —
- Monthly P&I
- —
- Monthly cashflow
- —
- DSCR
- —
- Eligible?
- —
Personal DTI + credit; lowest rate.
DSCR
20% down · 8.5% · 30yr
- Down + closing
- —
- Monthly P&I
- —
- Monthly cashflow
- —
- DSCR
- —
- Eligible?
- —
No personal income docs; deal must DSCR.
Hard money
10% down · 12.0% · 12mo
- Down + closing
- —
- Monthly P&I
- —
- Monthly cashflow
- —
- DSCR
- —
- Eligible?
- —
Short-term bridge; refi at stabilization.
Rent comps 6 comps
| Address | Beds | Baths | Sqft | Rent | $/sqft | DOM | Units | Dist |
|---|---|---|---|---|---|---|---|---|
| 1201 Stallion Dr Guthrie, OK | 4.0 | 2.0 | 1459 | $2,000 | $1.37 | 11d | 1 | 0.35mi |
| 406 S Pine St Guthrie, OK | 4.0 | 1.0 | 1272 | $1,400 | $1.10 | 1d | 1 | 0.37mi |
| 1221 Colt Dr Guthrie, OK | 3.0 | 2.0 | 1051 | $1,645 | $1.57 | 3d | 1 | 0.42mi |
| 1211 Clydesdale Dr Guthrie, OK | 3.0 | 2.0 | 1273 | $1,625 | $1.28 | 1d | 1 | 0.44mi |
| 520 E Springer Ave Guthrie, OK | 2.0 | 2.0 | 1092 | $1,300 | $1.19 | 23d | 1 | 0.93mi |
| 208 E Oklahoma Ave Guthrie, OK | 2.0 | 2.0 | 1800 | $1,450 | $0.81 | 1d | 1 | 1.24mi |
Listing history 19 events
-
2026-06-02statusdays on market $175,000 Pending 222 DOM
-
2026-06-01days on market $175,000 Active 221 DOM
-
2026-05-31days on market $175,000 Active 220 DOM
-
2026-03-06price $175,000
-
2025-12-19price $192,500
-
2025-10-23$195,000 Active
-
2014-04-15soldstatus $77,100
-
2014-01-28historical
-
2013-09-19$74,900
-
2013-09-17historical
-
2013-06-18$79,900
-
2013-04-03soldstatus $16,501
-
2013-02-22historical
-
2013-02-22historical
-
2013-02-22$15,000
-
2013-01-09$24,565
-
2012-10-12$28,900
-
2006-11-14soldstatus $55,000
-
1999-02-11soldstatus $46,500
ⓘ Source: listings_history table (triggers on properties + properties_extension) + one-shot
backfill from property_details.listing_events for pre-trigger history.
Tax reassessment forecast OK · Resets to sale price
- Current annual tax
- $1,020 · $85/mo
- Projected year-2 tax
- $1,575 · $131/mo
- Expected delta
- +$555/yr (+$46/mo · 54.4%)
ⓘ Screening estimate from a state-policy table — verify with the county assessor before closing.
Climate risk First Street
- Flood 1/10 Low FEMA zone X (unshaded) · 0% chance over 30 yrs
- Wildfire 5/10 Major
- Heat 5/10 Major 7 d/yr ≥109°F today · 18 d/yr by 30 yrs out
- Wind 2/10 Low 4% chance of damaging wind over 30 yrs
- Air quality 2/10 Low 2 unhealthy d/yr today · 2 by 30 yrs out
Nearby sold comps map
Loading sold comps map…
Walkable amenities ~0.75 mi
Loading nearby amenities…
Taxation est. · year 1
- Rental income
- $20,241
- − Mortgage interest
- −$9,803
- − Property taxes
- −$1,020
- − Insurance
- −$875
- − Repairs & maintenance
- −$1,619
- − Management
- −$1,619
- − Depreciation
- −$5,091
- Taxable income
- $214
- Est. tax owed @ 24.0%
- −$51
- After-tax cash flow
- $3,031/yr
For passive investors: Depreciation is non-cash, so a rental often shows a tax loss while cash-flowing — sheltering income. Rental losses are passive: they offset passive income freely, and up to $25,000/yr can offset ordinary (W-2) income if you actively participate and your MAGI is under $100k (phasing out to $0 by $150k); unused losses carry forward. On sale, claimed depreciation is recaptured at up to 25%, and gains may owe capital-gains tax (a 1031 exchange can defer both). Figures are a year-1 estimate at your 24.0% rate — not tax advice; consult a CPA.
Schools (NCES district)
- District
- Guthrie
- NCES district ID
- 4013560
- Math proficiency
- 24% ▼ -7.00%
- Reading proficiency
- 24% ▼ -2.00%
- Median HH income
- $45,370
- Composite
- 20.79/100
- National rank
- #8513
- State rank
- #119 of 270 in OK
Livability — Guthrie
- Score
- 74/100
- State rank
- #15
- US rank
- #4696
Category grades
Schools grade is shown separately in the Schools card above.
Census & demographics
- Census place
- Guthrie, OK
- County
- Logan County · 25,398 people
- City population
- 25,398
- Metro
- Oklahoma City, OK
- Population (ZIP)
- 25,398
- Household income
- $72,288
- Rent vs Own
- Severe rent burden
- 397.0
Population outlook (Logan County) Hauer SSP2
- Today (2025)
- 55,683 people
- By 2030
- 60,011 · +7.8%
- By 2040
- 68,071 · +22.2%
- By 2050
- 75,815 · +36.2%
- By 2075
- 94,749 · +70.2%
- By 2100
- 108,057 · +94.1%
Race, ethnicity, and origin ACS 2023
- Neighborhood character
- Predominantly White (77%)
- Race & ethnicity
- White 77% Two or more races 10% Hispanic / Latino 8% Black 6% Native American 3%
- Hispanic origin (detail)
- Mexican 7%
- Common ancestry
- Slovak 3% Lithuanian 3% Italian 2%
- Foreign-born
- 3% · Canada
- Languages at home
- 94% English-only · Spanish 6%
Political lean MEDSL · Logan
- 2024 margin
- Solid R (+49.0) · D 24.4% · R 73.5% · Other 2.1%
- 2008→2024 swing
- -11.6pp toward R · 2008: -37.4pp · 2024: -49.0pp
- All cycles
- 2024: R+49.0 2020: R+47.1 2016: R+49.5 2012: R+44.8 2008: R+37.4
Not yet ingested
- Civics
- —
Market trends
- HPI YoY
- ▼ -86.90%
- Current HPI
- 247.9481
- Rent YoY
- ▲ 12.22%
- Metro
- Oklahoma City, OK
- State GDP YoY
- ▲ 1.55%
- F500 in state
- 6
Industry mix (Fortune 500 HQ in OK)
| Industry | F500 HQs | Revenue |
|---|---|---|
| Energy | 3 | $48B |
|
||
Price history
+276.3% since first listed16 events — show timeline
- 2026-03-06 Price Changed $175,000 MLSOK
- 2025-12-19 Price Changed $192,500 MLSOK
- 2025-10-23 Listed $195,000 MLSOK
- 2014-04-15 Sold (Public Records) $77,100 Public Records
- 2014-01-28 Listing Removed — MLSOK
- 2013-09-19 Listed $74,900 MLSOK
- 2013-09-17 Listing Removed — MLSOK
- 2013-06-18 Listed $79,900 MLSOK
- 2013-04-03 Sold (MLS) $16,501 MLSOK
- 2013-02-22 Listing Removed — MLSOK
- 2013-02-22 Listing Removed — MLSOK
- 2013-02-22 Listed $15,000 MLSOK
- 2013-01-09 Listed $24,565 MLSOK
- 2012-10-12 Listed $28,900 MLSOK
- 2006-11-14 Sold (Public Records) $55,000 Public Records
- 1999-02-11 Sold (Public Records) $46,500 Public Records
Property tax history
+4.3%/yrLatest (2025): $1,020 · +24.5% YoY. Source: county tax records.
Cash-flow waterfall
monthlySold comps — $/sqft
last 12 mo · ≤1 miLoading sold comps…