6242 Beech Dr · Surrey, MI
Flood risk No data
- FEMA flood zone
- —
- Chance of flooding over 30 yrs
- —
- Est. flood insurance / yr
- —
Fire risk No data
- Est. fire insurance / yr
- —
Heat risk No data
- Hot days now (above threshold)
- —
- Hot days in 30 yrs
- —
Wind risk No data
- Chance of severe wind over 30 yrs
- —
Air-quality risk No data
- Unhealthy air days now
- —
- Unhealthy air days in 30 yrs
- —
Risk factors via First Street. Map © Google.
Why this score? — see what drove the B grade
The composite is a weighted blend of 9 inputs, each scored 0–100. Each bar is that input's sub-score; the figure is the points it added to the 100-point composite (weight × sub-score).
- Cash flow +30.0/30.0
- ARV discount +15.0/15.0
- 1% rule +10.0/10.0
- DSCR +10.0/10.0
- Rent growth +2.5/5.0
- Livability +2.5/5.0
- Condition / age +2.5/5.0
- Schools +2.4/10.0
- Appreciation +0.0/10.0
$45,000
🖨 Deal sheet 📄 Offer letter ✓ Due diligence
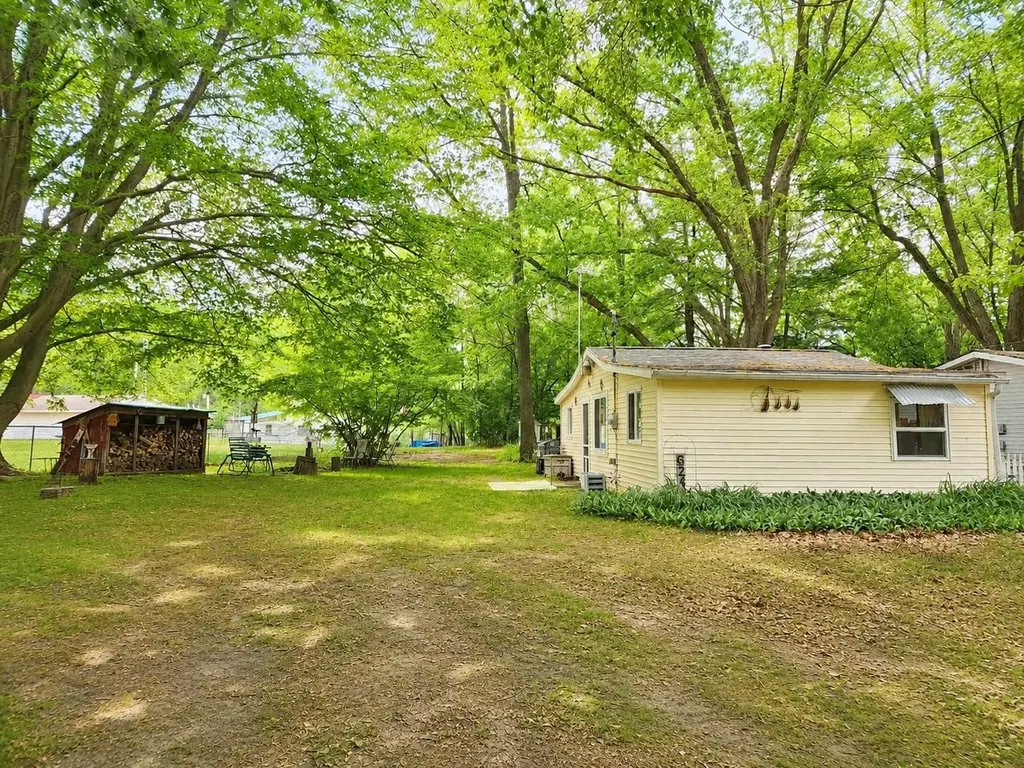
Listing remarks
Escape to the simple pleasures of cabin life with this adorable rustic retreat! This fully furnished 1-bedroom cabin offers 558 square feet of cozy living space on a beautifully shaded lot, making it the perfect up-north getaway. Enjoy access to Bear Lake with a low annual association fee of just $75, or take advantage of nearby access to Halfmoon Lake for additional recreational opportunities. Inside, you'll find a warm and inviting living area centered around a charming wood stove, which serves as the cabin's heat source. The kitchen comes equipped with essential appliances and cookware Home includes most furnishings, allowing you to start enjoying your getaway immediately. A makeshift sh
Key facts
- Wood stove
- Access to bear lake
- Fenced dog run
Tags
Property features AI
Finance
- HOA & community: Community amenities include park, playground, and beach area
Exterior
- Utilities: 100 amp electric service with circuit breakers; Electricity connected; No public water listed; No sewer/septic listed; No water heater
- Home design: Residential property; Single-story
- Construction: Slab foundation; Year built not specified
- Exterior features: Vinyl siding; Fenced yard (owned); Shed and outhouse; Subdivision setting; Lake/river privileges and beach access; Road frontage
Interior
- Kitchen: Carpeted kitchen; Microwave; Range/oven; Refrigerator; Eat-in kitchen
- Bedrooms: One bedroom on the main level (8 x 17) with carpet
- Flooring: Carpet throughout primary living areas (living room, kitchen, bedroom)
- Heating & cooling: Supplemental wood heat; Ceiling fan(s); Wall/window A/C
- Interior features: Furnished; Wood-burning free-standing fireplace; Living room; Eat-in kitchen; No basement
Neighborhood map
What this means for you Summary
Snapshot
- This is a 1-bed/1.0-bath single-family listed at $45k.
Deal economics
- At list price, monthly cash flow is $305 ($4k/yr) — positive.
- The deal already cash-flows at list — no discount required.
- Meets the 1% rule at list price ($765 rent vs $45k).
Location & tenants
- Location reads: area grade B — affects rentability + tenant quality, not the cash-flow math above.
- Farwell Area Schools (town): math 24% / reading 34% proficiency, ranked #388 of 540 in MI (top 72%) — low school quality limits family demand, transient renter base, plan for 1-2y turnover; 62% free/reduced lunch — lower-income household profile, screen leases tightly.
- Market conditions: 92 active listings in the ZIP; 77 units permitted in Clare County in 2024 (0 in 5+ unit buildings).
Forward outlook
- Local home prices are declining (-3.0%/yr); year-one equity from $311 of loan paydown is wiped out by about $1k of value loss. Plan a longer hold.
- Clare County population projected at -20% by 2050 — secular population decline; favor cash flow + early exit over multi-decade hold.
- At projected returns (-3.0% appreciation + 3.0% rent growth), your $13k cash investment doubles in ~5 years — after that, you're playing with house money.
Negotiation context
- Only 12 days on market — expect competitive offers; lowballing is unlikely to land.
- Current owner paid $8k; list at $45k implies a 470% gain — meaningful room to come down on a strong offer.
Questions for the listing agent
- Is there a deadline driving the sale (1031 exchange, divorce, estate, relocation)? That informs how much negotiation room exists.
- What's the average days-on-market for RENTAL listings here right now (not sales)? A rising rental-DOM trend means longer vacancies and softer asking-rent achievability than the comps imply.
- What's the recent tenant-quality profile in this submarket — average credit score on applications, eviction rate, late-payment / NSF rate, and stable-employment percentage? A property-management company in the area should have these aggregated.
- How much new for-sale + rental construction is in the pipeline within 1–3 miles? Heavy new supply typically softens prices + rents 12–24 months out; constrained supply supports both.
Investment metrics
- 1% rule
- 1.70% ✓
- Cap rate
- 14.44%
- Cash-on-cash
- 29.09%
- DSCR
- 2.29
- GRM
- 4.9
CMA / ARV
- ARV (on-the-fly)
- $78,678
- Comps found
- 6
Show comp detail 6 sales within ~0.75 mi
| Address | Dist | Beds/Ba | Sqft | Sold | Price | $/sf | Match |
|---|---|---|---|---|---|---|---|
| 5311 Half Moon Trl | 0.32mi | 2/1.0 (+1) | 558 (0%) | 14mo | $22,500 | $40 | 69 |
| 5490 Half Moon Trl | 0.40mi | 1/1.0 | 558 (0%) | 20mo | $80,000 | $143 | 65 |
| 5962 Woodland Dr Dr | 0.24mi | 1/1.0 | 600 (+8%) | 20mo | $50,000 | $83 | 60 |
| 5380 Half Moon Trl | 0.35mi | 2/1.0 (+1) | 630 (+13%) | 11mo | $81,000 | $129 | 48 |
| 5500 Half Moon Trl | 0.28mi | 2/1.0 (+1) | 638 (+14%) | 12mo | $90,000 | $141 | 48 |
| 5231 Summit Ct | 0.56mi | 2/1.0 (+1) | 620 (+11%) | 19mo | $90,000 | $145 | 34 |
Match score weights: distance 35% · size 25% · config 20% · recency 20%. Top-matched comps best support the ARV.
Projected returns pro-forma
-3.0% appreciation · 3.0% rent growth · sell at horizon
- IRR
- 23.5%
- Equity multiple
- 1.97×
- Total profit
- $12,168
- Equity at exit
- $6,710
- IRR
- 31.4%
- Equity multiple
- 3.83×
- Total profit
- $35,665
- Equity at exit
- $3,891
Cash invested: $12,600 (down + closing). Projections, not guarantees.
Landlord ↔ Tenant lean methodology
- Overall (STATE)
- 62 Landlord-Friendly
- State Michigan
- 62 Landlord-Friendly · EVEN
- County
- — inherits STATE
- City
- — inherits STATE
ZIP-level market 48632
- Home prices YoY
- -27.9%
- Active inventory
- 92
- Price-to-rent
- 4.9×
Monthly cashflow live
- Estimated rent
- $765 medium interval (Pro) →
- Mortgage (P&I)
- −$236
- Tax from tax record
- −$44 /mo · $531/yr
- Insurance
- −$19
- HOA
- −$0
- Vacancy / Maint / Mgmt
- −$161
- Net cashflow
- $305
Break-even live
UW: 25.0% down · 7.5% · 30yr · 1.5% tax · 5.0% vac · 8.0% maint · 8.0% mgmt
Financing live
Cash to close
- Down payment
- $11,250
- Closing costs
- $1,350
- Reserves months
- —
- Total cash needed
- —
Loan-product check · same deal, 3 products live
Conventional
25% down · 7.5% · 30yr
- Down + closing
- —
- Monthly P&I
- —
- Monthly cashflow
- —
- DSCR
- —
- Eligible?
- —
Personal DTI + credit; lowest rate.
DSCR
20% down · 8.5% · 30yr
- Down + closing
- —
- Monthly P&I
- —
- Monthly cashflow
- —
- DSCR
- —
- Eligible?
- —
No personal income docs; deal must DSCR.
Hard money
10% down · 12.0% · 12mo
- Down + closing
- —
- Monthly P&I
- —
- Monthly cashflow
- —
- DSCR
- —
- Eligible?
- —
Short-term bridge; refi at stabilization.
Listing history 10 events
-
2026-06-18days on market $45,000 Active 12 DOM
-
2026-06-17days on market $45,000 Active 11 DOM
-
2026-06-16days on market $45,000 Active 10 DOM
-
2026-06-15days on market $45,000 Active 9 DOM
-
2026-06-13days on market $45,000 Active 7 DOM
-
2026-06-12days on market $45,000 Active 6 DOM
-
2026-06-09days on market $45,000 Active 3 DOM
-
2026-06-08days on market $45,000 Active 2 DOM
-
2026-06-07remarks 699-char remark
-
2026-06-07$45,000 Active 1 DOM
ⓘ Source: listings_history table (triggers on properties + properties_extension) + one-shot
backfill from property_details.listing_events for pre-trigger history.
Tax reassessment forecast MI · Partial reset (capped growth)
- Current annual tax
- $531 · $44/mo
- Projected year-2 tax
- $612 · $51/mo
- Expected delta
- +$81/yr (+$7/mo · 15.3%)
ⓘ Screening estimate from a state-policy table — verify with the county assessor before closing.
Nearby sold comps map
Loading sold comps map…
Walkable amenities ~0.75 mi
Loading nearby amenities…
Taxation est. · year 1
- Rental income
- $9,182
- − Mortgage interest
- −$2,521
- − Property taxes
- −$531
- − Insurance
- −$225
- − Repairs & maintenance
- −$735
- − Management
- −$735
- − Depreciation
- −$1,309
- Taxable income
- $3,127
- Est. tax owed @ 24.0%
- −$750
- After-tax cash flow
- $2,915/yr
For passive investors: Depreciation is non-cash, so a rental often shows a tax loss while cash-flowing — sheltering income. Rental losses are passive: they offset passive income freely, and up to $25,000/yr can offset ordinary (W-2) income if you actively participate and your MAGI is under $100k (phasing out to $0 by $150k); unused losses carry forward. On sale, claimed depreciation is recaptured at up to 25%, and gains may owe capital-gains tax (a 1031 exchange can defer both). Figures are a year-1 estimate at your 24.0% rate — not tax advice; consult a CPA.
Schools (NCES district)
- District
- Farwell Area Schools
- NCES district ID
- 2614100
- Math proficiency
- 24% ▼ -8.00%
- Reading proficiency
- 34% ▼ -8.00%
- Median HH income
- $36,696
- Composite
- 24.07/100
- National rank
- #7760
- State rank
- #388 of 540 in MI
Livability — Surrey
No livability data for this city. (Only ~50 U.S. cities are tracked.)
Census & demographics
- Population (ZIP)
- 4,995
Population outlook (Clare County) Hauer SSP2
- Today (2025)
- 29,283 people
- By 2030
- 28,199 · -3.7%
- By 2040
- 25,722 · -12.2%
- By 2050
- 23,372 · -20.2%
- By 2075
- 18,569 · -36.6%
- By 2100
- 14,320 · -51.1%
Race, ethnicity, and origin ACS 2023
- Neighborhood character
- Predominantly White (91%)
- Race & ethnicity
- White 91% Two or more races 4% Hispanic / Latino 4%
- Common ancestry
- Romanian 7% Lithuanian 3% Slovak 2%
- Foreign-born
- 2% · Canada, China, South Korea
- Languages at home
- 95% English-only · German/W. Germanic 2% Spanish 1% Chinese 1%
Political lean MEDSL · Clare
- 2024 margin
- Solid R (+37.6) · D 30.5% · R 68.1% · Other 1.4%
- 2008→2024 swing
- -42.4pp toward R · 2008: 4.8pp · 2024: -37.6pp
- All cycles
- 2024: R+37.6 2020: R+34.8 2016: R+31.8 2012: R+4.8 2008: D+4.8
Not yet ingested
- Civics
- —
Market trends
- HPI YoY
- ▼ -90.83%
- Current HPI
- 234.5118
- Rent YoY
- —
- Metro
- —
- State GDP YoY
- ▲ 1.37%
- F500 in state
- 28
Industry mix (Fortune 500 HQ in MI)
| Industry | F500 HQs | Revenue |
|---|---|---|
| Automotive Parts | 3 | $48B |
|
||
| Automotive | 2 | $372B |
|
||
| Chemicals | 1 | $45B |
|
||
| Automotive Retail | 1 | $29B |
|
||
| Healthcare / Medical Devices | 1 | $23B |
|
||
| Automotive Technology | 1 | $20B |
|
||
Price history
+469.6% since first listed2 events — show timeline
- 2026-06-06 Listed $45,000 MiRealSource-MiMLS
- 2015-12-04 Sold (Public Records) $7,900 Public Records
Property tax history
+2.4%/yrLatest (2024): $531 · +2.8% YoY. Source: county tax records.
Cash-flow waterfall
monthlySold comps — $/sqft
last 12 mo · ≤1 miLoading sold comps…