1249 W Oakdale Dr · Fort Wayne, IN
Flood risk 1/10 · Minimal
- FEMA flood zone
- X (unshaded)
- Chance of flooding over 30 yrs
- 0.0%
- Est. flood insurance / yr
- $473 – $860
Fire risk 1/10 · Minimal
- Est. fire insurance / yr
- $717 – $1,331
Heat risk 3/10 · Minor
- Hot days now (above 100°F)
- 7 days/yr
- Hot days in 30 yrs
- 17 days/yr
Wind risk 2/10 · Minimal
- Chance of severe wind over 30 yrs
- —
Air-quality risk 3/10 · Minor
- Unhealthy air days now
- 2 days/yr
- Unhealthy air days in 30 yrs
- 3 days/yr
Risk factors via First Street. Map © Google.
Why this score? — see what drove the C- grade
The composite is a weighted blend of 9 inputs, each scored 0–100. Each bar is that input's sub-score; the figure is the points it added to the 100-point composite (weight × sub-score).
- Cash flow +15.3/30.0
- ARV discount +15.0/15.0
- DSCR +4.7/10.0
- Rent growth +4.6/5.0
- Livability +4.2/5.0
- 1% rule +3.7/10.0
- Condition / age +2.5/5.0
- Schools +2.2/10.0
- Appreciation +0.0/10.0
$175,000
🖨 Deal sheet (PDF) 📄 Offer letter ✓ Due diligence
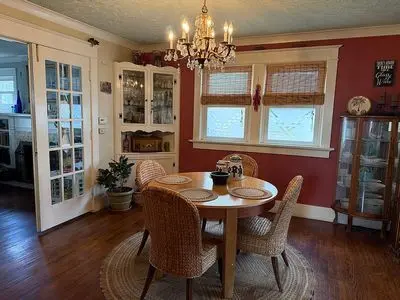
Listing remarks
Craftsman home with great bones. 2 living rooms located front and back. Great lighting! Small back porch and nice front porch that French doors open to from front living room and another set of French doors from that living to back living room. Excellent storage with a workshop in the basement. Wine bar stays in partially finished basement along with washer and dryer. New furnace four years ago with April aire included. Central Air. Whole house solar. Fenced in back yard. Home needs a bit of TLC but is move in ready! Cash offers accepted.
Key facts
- Wine bar
- Front porch
- French doors
Tags
Property features AI
Exterior
- Home design: Built in 1920
- Construction: Living area approximately 2100; Original construction from 1920
- Exterior features: Located in the Illsley Place subdivision
Interior
- Bedrooms: No bedroom details provided
Neighborhood map
What this means for you Summary
Snapshot
- This is a 4-bed/1.5-bath single-family listed at $175k.
Deal economics
- At list price, monthly cash flow is $64 ($763/yr) — positive.
- The deal already cash-flows at list — no discount required.
- To meet the 1% rule (rent ≥ 1% of price), the offer needs to be $152k (13.1% below list).
- Recommended offer: $152k (13.1% below list) — sets the bar for 1% rule.
- Cap rate 6.7% vs local median 4.7% in Fort Wayne — top-decile yield for the area; either an underpriced asset or a hidden risk that comps aren't pricing in. Stress-test before assuming the spread holds.
Location & tenants
- Location reads 84/100 on livability (#6 in IN, #676 nationally) — a professional / high-income tenant draw. Strengths: amenities A+, commute A+, cost of living A+; Watch: crime C-, employment D+.
- Fort Wayne Community Schools (urban): math 22% / reading 29% proficiency, ranked #263 of 301 in IN (top 87%) — low school quality limits family demand, transient renter base, plan for 1-2y turnover; 60% free/reduced lunch — lower-income household profile, screen leases tightly.
- Zoned schools: Harrison Hill Elementary School (math 21% / reading 18%, grade F, #814 of 994 statewide, top 83%, 618 students, 76% FRL); Miami Middle School (math 9% / reading 17%, grade F, #304 of 330 statewide, top 94%, 497 students, 80% FRL); South Side High School (math 12% / reading 39%, grade F, #322 of 369 statewide, top 87%, 1,423 students, 73% FRL) — zoned schools average 77% FRL vs 60% district-wide (16 pts higher); higher-poverty schools than district average — tighter screening recommended.
- Market conditions: Rents rising fast (+8.2%/yr); 99 active listings in the ZIP; 11 comparable units currently listed for rent nearby; rentals lingering (median 46d on market — plan ~5-8 weeks vacancy on turnover, expect pricing pressure); 55% of comp listings sitting > 30 days — soft ceiling on asking rent; 1,861 units permitted in Allen County in 2024 (576 in 5+ unit buildings).
- This rent runs 31% of the median local income ($59k/yr) — at the standard rent-burdened threshold; future hikes will face affordability resistance.
Forward outlook
- Local home prices are declining (-3.0%/yr); year-one equity from $1k of loan paydown is wiped out by about $5k of value loss. Plan a longer hold.
- Allen County population projected at +10% by 2050 — modest demand growth; plan on rents tracking national, not racing it.
Negotiation context
- It's been on market 26 days — a 2% lower offer ($172k) is reasonable based on typical stale-listing flexibility.
- 2 sale attempts since 12y ago with the ask held roughly flat each time — persistent listings suggest the price (not the market) is what's stuck; bring a comps-based counter.
Risks & watch-outs
- Watch-outs: built in 1920 — expect roof / HVAC / electrical / plumbing capex.
Questions for the listing agent
- Built in 1920 — when were the roof, HVAC, electrical panel, plumbing, and water heater last replaced?
- Is there a deadline driving the sale (1031 exchange, divorce, estate, relocation)? That informs how much negotiation room exists.
- Schools are D-rated, which usually means shorter tenancies and higher turnover. Who's the typical renter profile here, and what's been the actual vacancy rate?
- What's the average days-on-market for RENTAL listings here right now (not sales)? A rising rental-DOM trend means longer vacancies and softer asking-rent achievability than the comps imply.
- What's the recent tenant-quality profile in this submarket — average credit score on applications, eviction rate, late-payment / NSF rate, and stable-employment percentage? A property-management company in the area should have these aggregated.
- How much new for-sale + rental construction is in the pipeline within 1–3 miles? Heavy new supply typically softens prices + rents 12–24 months out; constrained supply supports both.
Investment metrics
- 1% rule
- 0.87% ✗
- Cap rate
- 6.73%
- Cash-on-cash
- 1.56%
- DSCR
- 1.07
- GRM
- 9.6
CMA / ARV
- ARV (on-the-fly)
- $273,000
- Comps found
- 12
Show comp detail 12 sales within ~0.75 mi
| Address | Dist | Beds/Ba | Sqft | Sold | Price | $/sf | Match |
|---|---|---|---|---|---|---|---|
| 1205 Sheridan Ct | 0.30mi | 3/1.5 (-1) | 2,072 (-1%) | 1mo | $280,000 | $135 | 78 |
| 1138 W Packard Ave | 0.27mi | 4/1.5 | 1,858 (-12%) | 7mo | $200,000 | $108 | 63 |
| 1150 Westover Rd | 0.63mi | 4/2.0 | 2,220 (+6%) | 2mo | $374,500 | $169 | 57 |
| 815 Pasadena Dr | 0.73mi | 3/1.5 (-1) | 2,152 (+2%) | 1mo | $268,000 | $125 | 56 |
| 1216 Maxine Dr | 0.45mi | 3/1.5 (-1) | 2,272 (+8%) | 5mo | $295,000 | $130 | 56 |
| 4301 Indiana Ave | 0.60mi | 4/1.5 | 1,917 (-9%) | 4mo | $330,000 | $172 | 54 |
| 628 W Oakdale Dr | 0.48mi | 3/2.0 (-1) | 2,330 (+11%) | 2mo | $314,900 | $135 | 50 |
| 1302 Huestis Ave | 0.74mi | 4/3.0 | 2,325 (+11%) | 1mo | $220,000 | $95 | 41 |
| 1225 Huestis Ave | 0.73mi | 3/1.5 (-1) | 1,825 (-13%) | 1mo | $200,000 | $110 | 38 |
| 404 W Oakdale Dr | 0.71mi | 5/2.5 (+1) | 2,338 (+11%) | 2mo | $280,000 | $120 | 37 |
| 2222 Opechee Way | 0.73mi | 3/2.0 (-1) | 2,382 (+13%) | 2mo | $234,900 | $99 | 35 |
| 4615 Beaver Ave | 0.75mi | 3/1.5 (-1) | 1,794 (-15%) | 3mo | $255,000 | $142 | 34 |
Match score weights: distance 35% · size 25% · config 20% · recency 20%. Top-matched comps best support the ARV.
Projected returns pro-forma
-3.0% appreciation · 8.0% rent growth · sell at horizon
- IRR
- -8.7%
- Equity multiple
- 0.67×
- Total profit
- $-16,291
- Equity at exit
- $26,093
- IRR
- 6.2%
- Equity multiple
- 1.56×
- Total profit
- $27,519
- Equity at exit
- $15,131
Cash invested: $49,000 (down + closing). Projections, not guarantees.
Landlord ↔ Tenant lean methodology
- Overall (STATE)
- 90 Strongly Landlord-Friendly
- State Indiana
- 90 Strongly Landlord-Friendly · R+11
- County
- — inherits STATE
- City
- — inherits STATE
ZIP-level market 46807
- Rents YoY
- 8.2%
- Active inventory
- 99
- Price-to-rent
- 9.6×
Monthly cashflow live
- Estimated rent
- $1,521 high interval (Pro) →
- Mortgage (P&I)
- −$918
- Tax from tax record
- −$147 /mo · $1,764/yr
- Insurance
- −$73
- HOA
- −$0
- Vacancy / Maint / Mgmt
- −$319
- Net cashflow
- $64
Break-even live
Sensitivity live
| Price | -10% $163 | -5% $113 | +0% $64 | +5% $14 | +10% $-35 |
|---|---|---|---|---|---|
| Rent | -10% $-57 | -5% $4 | +0% $64 | +5% $124 | +10% $184 |
| Rate | -1.0pp $152 | -0.5pp $108 | base $64 | +0.5pp $18 | +1.0pp $-28 |
UW: 25.0% down · 7.5% · 30yr · 1.5% tax · 5.0% vac · 8.0% maint · 8.0% mgmt
Financing live
Cash to close
- Down payment
- $43,750
- Closing costs
- $5,250
- Reserves months
- —
- Total cash needed
- —
Loan-product check · same deal, 3 products live
Conventional
25% down · 7.5% · 30yr
- Down + closing
- —
- Monthly P&I
- —
- Monthly cashflow
- —
- DSCR
- —
- Eligible?
- —
Personal DTI + credit; lowest rate.
DSCR
20% down · 8.5% · 30yr
- Down + closing
- —
- Monthly P&I
- —
- Monthly cashflow
- —
- DSCR
- —
- Eligible?
- —
No personal income docs; deal must DSCR.
Hard money
10% down · 12.0% · 12mo
- Down + closing
- —
- Monthly P&I
- —
- Monthly cashflow
- —
- DSCR
- —
- Eligible?
- —
Short-term bridge; refi at stabilization.
Rent comps 11 comps
| Address | Beds | Baths | Sqft | Rent | $/sqft | DOM | Units | Dist |
|---|---|---|---|---|---|---|---|---|
| 724 Kinnaird Ave Fort Wayne, IN | 3.0 | 1.5 | 1880 | $1,450 | $0.77 | 45d | 1 | 0.50mi |
| 2431 Fox Ave Fort Wayne, IN | 3.0 | 1.5 | 1522 | $1,550 | $1.02 | 15d | 1 | 0.82mi |
| 3221 Webster St Fort Wayne, IN | 5.0 | 2.0 | 1885 | $1,575 | $0.84 | 15d | 1 | 0.88mi |
| 3221 S Harrison St Fort Wayne, IN | 5.0 | 2.0 | 2062 | $1,650 | $0.80 | 23d | 1 | 0.94mi |
| 2616 S Harrison St Fort Wayne, IN | 4.0 | 2.0 | 1908 | $1,500 | $0.79 | 45d | 1 | 1.06mi |
| 116 E Pontiac St Fort Wayne, IN | 3.0 | 1.5 | 1400 | $1,175 | $0.84 | 23d | 1 | 1.14mi |
| 2118 Webster St Fort Wayne, IN | 4.0 | 1.0 | 2200 | $1,175 | $0.53 | 45d | 1 | 1.23mi |
| 4133 Lafayette St Fort Wayne, IN | 4.0 | 2.0 | 1640 | $1,400 | $0.85 | 23d | 1 | 1.29mi |
| 2530 Lafayette St Fort Wayne, IN | 4.0 | 1.0 | 1816 | $1,500 | $0.83 | 45d | 1 | 1.35mi |
| 877 Lavina St Fort Wayne, IN | 1.0–3.0 | 1.0–2.0 | 997 | $2,980 | $2.99 | 45d | 17 | 1.46mi |
| 1118 Rockhill St Fort Wayne, IN | 3.0 | 3.0 | 1790 | $2,300 | $1.28 | 45d | 1 | 1.49mi |
Listing history 17 events
-
2026-06-22days on market $175,000 Active 26 DOM
-
2026-06-18days on market $175,000 Active 23 DOM
-
2026-06-17days on market $175,000 Active 22 DOM
-
2026-06-16days on market $175,000 Active 21 DOM
-
2026-06-15days on market $175,000 Active 20 DOM
-
2026-06-14days on market $175,000 Active 18 DOM
-
2026-06-10days on market $175,000 Active 15 DOM
-
2026-06-09days on market $175,000 Active 14 DOM
-
2026-06-08days on market $175,000 Active 13 DOM
-
2026-06-07days on market $175,000 Active 12 DOM
-
2026-06-03days on market $175,000 Active 8 DOM
-
2026-06-02days on market $175,000 Active 7 DOM
-
2026-06-01days on market $175,000 Active 6 DOM
-
2026-05-31days on market $175,000 Active 5 DOM
-
2026-05-30days on market $175,000 Active 4 DOM
-
2026-05-26$175,000 Active
-
2014-09-15$89,900
ⓘ Source: listings_history table (triggers on properties + properties_extension) + one-shot
backfill from property_details.listing_events for pre-trigger history.
Tax reassessment forecast IN · Partial reset (capped growth)
- Current annual tax
- $1,764 · $147/mo
- Projected year-2 tax
- $1,764 · $147/mo
- Expected delta
- $0/yr ($0/mo · 0.0%)
ⓘ Screening estimate from a state-policy table — verify with the county assessor before closing.
Climate risk First Street
- Flood 1/10 Low FEMA zone X (unshaded) · 0% chance over 30 yrs
- Wildfire 1/10 Low
- Heat 3/10 Moderate 7 d/yr ≥100°F today · 17 d/yr by 30 yrs out
- Wind 2/10 Low
- Air quality 3/10 Moderate 2 unhealthy d/yr today · 3 by 30 yrs out
Nearby sold comps map
Loading sold comps map…
Walkable amenities ~0.75 mi
Loading nearby amenities…
Taxation est. · year 1
- Rental income
- $18,246
- − Mortgage interest
- −$9,803
- − Property taxes
- −$1,764
- − Insurance
- −$875
- − Repairs & maintenance
- −$1,460
- − Management
- −$1,460
- − Depreciation
- −$5,091
- Taxable loss
- −$2,205
- Est. tax savings @ 24.0%
- +$529
- After-tax cash flow
- $1,293/yr
For passive investors: Depreciation is non-cash, so a rental often shows a tax loss while cash-flowing — sheltering income. Rental losses are passive: they offset passive income freely, and up to $25,000/yr can offset ordinary (W-2) income if you actively participate and your MAGI is under $100k (phasing out to $0 by $150k); unused losses carry forward. On sale, claimed depreciation is recaptured at up to 25%, and gains may owe capital-gains tax (a 1031 exchange can defer both). Figures are a year-1 estimate at your 24.0% rate — not tax advice; consult a CPA.
Schools (NCES district)
- District
- Fort Wayne Community Schools
- NCES district ID
- 1803630
- Math proficiency
- 22% ▼ -11.00%
- Reading proficiency
- 29% ▼ -7.00%
- Median HH income
- $41,951
- Composite
- 21.68/100
- National rank
- #8275
- State rank
- #263 of 301 in IN
Livability — Fort Wayne
- Score
- 84/100
- State rank
- #6
- US rank
- #676
Category grades
Schools grade is shown separately in the Schools card above.
Census & demographics
- Census place
- Fort Wayne, IN
- County
- Allen County · 326,813 people
- City population
- 326,813
- Metro
- Fort Wayne, IN
- Population (ZIP)
- 16,317
- Household income
- $58,685
- Rent vs Own
- Severe rent burden
- 680.0
Population outlook (Allen County) Hauer SSP2
- Today (2025)
- 394,020 people
- By 2030
- 405,128 · +2.8%
- By 2040
- 423,476 · +7.5%
- By 2050
- 435,137 · +10.4%
- By 2075
- 450,293 · +14.3%
- By 2100
- 424,101 · +7.6%
Race, ethnicity, and origin ACS 2023
- Neighborhood character
- Diverse neighborhood (Simpson 0.66)
- Race & ethnicity
- White 54% Two or more races 19% Hispanic / Latino 16% Black 14% Asian 4%
- Hispanic origin (detail)
- Mexican 15%
- Common ancestry
- Slovak 3% Lithuanian 3% Romanian 2%
- Foreign-born
- 9% · Canada, Philippines, Jamaica
- Languages at home
- 82% English-only · Spanish 13% Other Asian/Pacific 4% German/W. Germanic 1%
Political lean MEDSL · Allen
- 2024 margin
- R (+12.5) · D 42.9% · R 55.4% · Other 1.7%
- 2008→2024 swing
- -8.1pp toward R · 2008: -4.3pp · 2024: -12.5pp
- All cycles
- 2024: R+12.5 2020: R+11.2 2016: R+19.6 2012: R+16.8 2008: R+4.3
Not yet ingested
- Civics
- —
Market trends
- HPI YoY
- ▼ -318.66%
- Current HPI
- 272.6238
- Rent YoY
- ▲ 8.24%
- Metro
- Fort Wayne, IN
- State GDP YoY
- ▲ 2.90%
- F500 in state
- 18
Industry mix (Fortune 500 HQ in IN)
| Industry | F500 HQs | Revenue |
|---|---|---|
| Industrial Machinery | 2 | $37B |
|
||
| Healthcare | 1 | $177B |
|
||
| Pharmaceuticals | 1 | $45B |
|
||
| Metals / Steel | 1 | $18B |
|
||
| Agriculture | 1 | $17B |
|
||
| Packaging | 1 | $12B |
|
||
Price history
+94.7% since first listed2 events — show timeline
- 2026-05-26 Listed $175,000 FSBO.com
- 2014-09-15 Listed $89,900 IRMLS
Property tax history
+4.3%/yrLatest (2024): $1,764 · +0.9% YoY. Source: county tax records.
Cash-flow waterfall
monthlySold comps — $/sqft
last 12 mo · ≤1 miLoading sold comps…