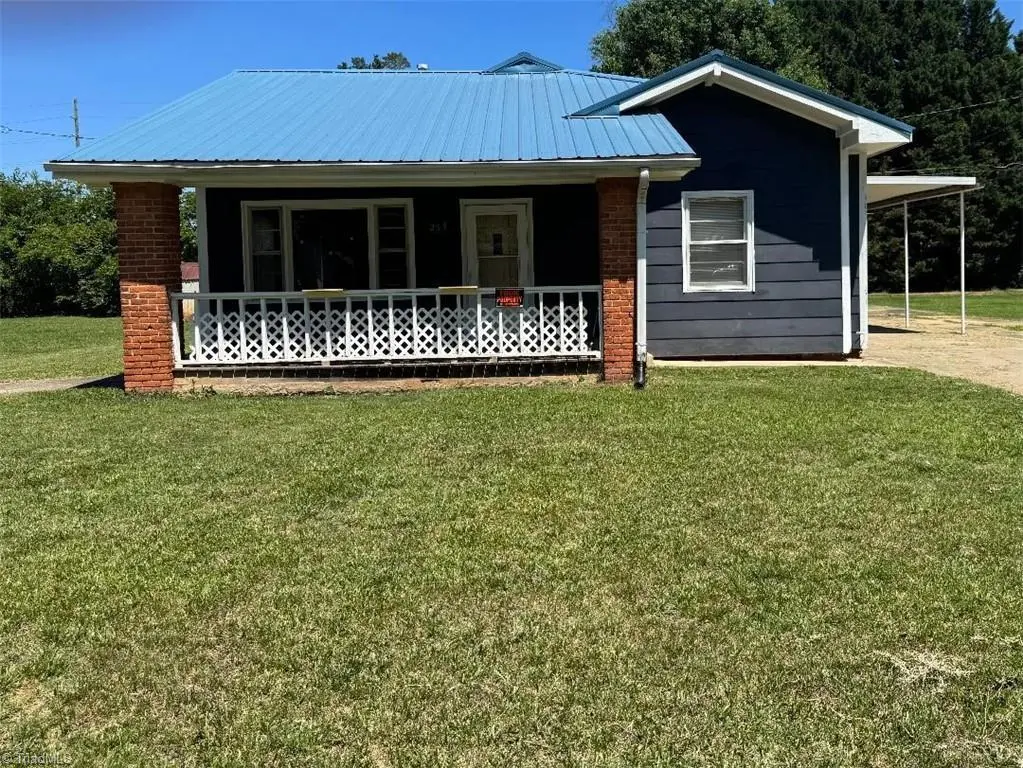
265 Broad St · Lexington, NC
Flood risk 1/10 · Minimal
- FEMA flood zone
- X (unshaded)
- Chance of flooding over 30 yrs
- 0.0%
- Est. flood insurance / yr
- $507 – $1,088
Fire risk 1/10 · Minimal
- Est. fire insurance / yr
- $906 – $1,684
Heat risk 6/10 · Moderate
- Hot days now (above 104°F)
- 7 days/yr
- Hot days in 30 yrs
- 17 days/yr
Wind risk 4/10 · Minor
- Chance of severe wind over 30 yrs
- 12.0%
Air-quality risk 2/10 · Minimal
- Unhealthy air days now
- 1 days/yr
- Unhealthy air days in 30 yrs
- 2 days/yr
Risk factors via First Street. Map © Google.
Why this score? — see what drove the C- grade
The composite is a weighted blend of 9 inputs, each scored 0–100. Each bar is that input's sub-score; the figure is the points it added to the 100-point composite (weight × sub-score).
- Cash flow +15.8/30.0
- ARV discount +15.0/15.0
- DSCR +4.9/10.0
- Livability +3.6/5.0
- Rent growth +3.3/5.0
- 1% rule +3.2/10.0
- Schools +2.8/10.0
- Condition / age +2.5/5.0
- Appreciation +0.0/10.0
$170,000
🖨 Deal sheet (PDF) 📄 Offer letter ✓ Due diligence
Listing remarks
Perfect starter home for anyone looking to find a cute house to put some sweat equity into. Good bones just need a little TLC.
Key facts
- 9,583 sq ft lot
- 2 garage spots
- Built 1917
Property features AI
Finance
- Other: Property type: Residential; Structure type: House; Built/existing structure
- HOA & community: No homeowners association; Subdivision: Erlanger Mills
Exterior
- Parking: Detached carport; Driveway with gravel; Two garage/carport spaces
- Utilities: Public water; Public sewer; Electric water heater
- Home design: Residential stick/site-built house; One story; Built in 1917; Living room fireplace
- Construction: Vinyl siding construction; Crawl space foundation
- Exterior features: Fenced yard; Level, city lot; Storage building on the property; Publicly maintained road access
Interior
- Flooring: Laminate
- Bathrooms: One full bathroom
- Heating & cooling: Heat pump for cooling; Forced air heating; Natural gas heating fuel
- Interior features: Primary bedroom located on the main level; Attic access only; Laminate flooring; Six total rooms
Neighborhood map
What this means for you Summary
Snapshot
- This is a 3-bed/1.0-bath single-family listed at $170k.
Deal economics
- At list price, monthly cash flow is $79 ($945/yr) — positive.
- The deal already cash-flows at list — no discount required.
- To meet the 1% rule (rent ≥ 1% of price), the offer needs to be $139k (18.4% below list).
- Recommended offer: $139k (18.4% below list) — sets the bar for 1% rule.
- Cap rate 6.8% vs local median 3.5% in Lexington — top-decile yield for the area; either an underpriced asset or a hidden risk that comps aren't pricing in. Stress-test before assuming the spread holds.
Location & tenants
- Location reads 72/100 on livability (#89 in NC) — a middle-class / working-renter tenant base. Strengths: commute A+, cost of living A+, health & safety A+; Watch: crime F, amenities D-, employment F.
- Lexington City Schools (suburban): math 32% / reading 38% proficiency, ranked #136 of 178 in NC (top 76%) — families likely to look elsewhere, expect single-tenant / working-renter base with shorter leases; 78% free/reduced lunch — lower-income household profile, screen leases tightly.
- Zoned schools: Pickett Elementary School (math 32% / reading 32%, grade F, #908 of 1,410 statewide, top 67%, 394 students, 99% FRL); Lexington Middle School (math 31% / reading 41%, grade F, #273 of 475 statewide, top 58%, 647 students, 100% FRL); Lexington Senior High School (math 27% / reading 52%, grade F, #393 of 535 statewide, top 75%, 928 students, 99% FRL) — zoned schools average 99% FRL vs 78% district-wide (21 pts higher); higher-poverty schools than district average — tighter screening recommended.
- Market conditions: Rents rising (+3.4%/yr); 362 active listings in the ZIP; 4 comparable units currently listed for rent nearby; rentals at typical pace (median 21d on market — plan ~3-4 weeks tenant-placement turnaround); 990 units permitted in Davidson County in 2024 (54 in 5+ unit buildings).
Forward outlook
- Local home prices are declining (-3.0%/yr); year-one equity from $1k of loan paydown is wiped out by about $5k of value loss. Plan a longer hold.
- Davidson County population projected to shrink 6% by 2050 — rents likely to lag national; underwrite the cash flow, not the appreciation.
Negotiation context
- Only 13 days on market — expect competitive offers; lowballing is unlikely to land.
- Current owner paid $50k; list at $170k implies a 240% gain — meaningful room to come down on a strong offer.
Risks & watch-outs
- Watch-outs: built in 1917 — expect roof / HVAC / electrical / plumbing capex.
- Climate carrying-cost: extreme-heat days projected 7→17/yr by 2055 (HVAC capex compounding) — expect insurance premiums to compound above CPI over the hold.
Questions for the listing agent
- Built in 1917 — when were the roof, HVAC, electrical panel, plumbing, and water heater last replaced?
- Is there a deadline driving the sale (1031 exchange, divorce, estate, relocation)? That informs how much negotiation room exists.
- Schools are D-rated, which usually means shorter tenancies and higher turnover. Who's the typical renter profile here, and what's been the actual vacancy rate?
- Crime grade is F in this area — have there been break-ins, vandalism, or insurance claims at this property in the last 3 years? What carrier currently insures it and at what premium?
- What's the average days-on-market for RENTAL listings here right now (not sales)? A rising rental-DOM trend means longer vacancies and softer asking-rent achievability than the comps imply.
- What's the recent tenant-quality profile in this submarket — average credit score on applications, eviction rate, late-payment / NSF rate, and stable-employment percentage? A property-management company in the area should have these aggregated.
- How much new for-sale + rental construction is in the pipeline within 1–3 miles? Heavy new supply typically softens prices + rents 12–24 months out; constrained supply supports both.
Investment metrics
- 1% rule
- 0.82% ✗
- Cap rate
- 6.85%
- Cash-on-cash
- 1.98%
- DSCR
- 1.09
- GRM
- 10.2
CMA / ARV
- ARV (on-the-fly)
- $231,990
- Comps found
- 12
Show comp detail 12 sales within ~0.75 mi
| Address | Dist | Beds/Ba | Sqft | Sold | Price | $/sf | Match |
|---|---|---|---|---|---|---|---|
| 293 Winston Rd | 0.05mi | 3/1.0 | 1,350 (-4%) | 1mo | $45,000 | $33 | 90 |
| 238 Broad St | 0.05mi | 3/2.0 | 1,361 (-3%) | 4mo | $134,700 | $99 | 85 |
| 300 E 8th Street 8th St | 0.31mi | 3/2.0 | 1,320 (-6%) | 7mo | $226,000 | $171 | 65 |
| 105 Kenwood Ln | 0.50mi | 3/2.0 | 1,354 (-4%) | 8mo | $270,000 | $199 | 60 |
| 100 Kenwood Ln | 0.56mi | 2/2.0 (-1) | 1,464 (+4%) | 1mo | $218,000 | $149 | 58 |
| 226 Westover Dr | 0.54mi | 2/2.0 (-1) | 1,410 (+0%) | 9mo | $192,000 | $136 | 57 |
| 10 Woodhaven Dr | 0.58mi | 3/2.0 | 1,392 (-1%) | 14mo | $248,000 | $178 | 56 |
| 37 Mill St | 0.13mi | 2/2.0 (-1) | 1,199 (-15%) | 11mo | $65,000 | $54 | 51 |
| 1514 Hampton St | 0.67mi | 3/2.0 | 1,468 (+4%) | 8mo | $300,000 | $204 | 50 |
| 409 Hillside Dr | 0.70mi | 3/2.0 | 1,511 (+8%) | 18mo | $250,000 | $165 | 36 |
| 300 Hillside Dr | 0.69mi | 2/2.0 (-1) | 1,588 (+13%) | 4mo | $215,000 | $135 | 34 |
| 1 Hillside Dr | 0.72mi | 3/2.0 | 1,215 (-14%) | 17mo | $227,000 | $187 | 25 |
Match score weights: distance 35% · size 25% · config 20% · recency 20%. Top-matched comps best support the ARV.
Projected returns pro-forma
-3.0% appreciation · 3.37% rent growth · sell at horizon
- IRR
- -12.8%
- Equity multiple
- 0.54×
- Total profit
- $-22,090
- Equity at exit
- $25,348
- IRR
- -3.4%
- Equity multiple
- 0.77×
- Total profit
- $-10,943
- Equity at exit
- $14,698
Cash invested: $47,600 (down + closing). Projections, not guarantees.
Landlord ↔ Tenant lean methodology
- Overall (STATE)
- 85 Strongly Landlord-Friendly
- State North Carolina
- 85 Strongly Landlord-Friendly · R+3
- County
- — inherits STATE
- City
- — inherits STATE
ZIP-level market 27295
- Home prices YoY
- -15.2%
- Rents YoY
- 3.4%
- Active inventory
- 362
- Price-to-rent
- 10.2×
Monthly cashflow live
- Estimated rent
- $1,387 medium interval (Pro) →
- Mortgage (P&I)
- −$891
- Tax from tax record
- −$55 /mo · $660/yr
- Insurance
- −$71
- HOA
- −$0
- Vacancy / Maint / Mgmt
- −$291
- Net cashflow
- $79
Break-even live
Sensitivity live
| Price | -10% $175 | -5% $127 | +0% $79 | +5% $31 | +10% $-17 |
|---|---|---|---|---|---|
| Rent | -10% $-31 | -5% $24 | +0% $79 | +5% $134 | +10% $188 |
| Rate | -1.0pp $164 | -0.5pp $122 | base $79 | +0.5pp $35 | +1.0pp $-10 |
UW: 25.0% down · 7.5% · 30yr · 1.5% tax · 5.0% vac · 8.0% maint · 8.0% mgmt
Financing live
Cash to close
- Down payment
- $42,500
- Closing costs
- $5,100
- Reserves months
- —
- Total cash needed
- —
Loan-product check · same deal, 3 products live
Conventional
25% down · 7.5% · 30yr
- Down + closing
- —
- Monthly P&I
- —
- Monthly cashflow
- —
- DSCR
- —
- Eligible?
- —
Personal DTI + credit; lowest rate.
DSCR
20% down · 8.5% · 30yr
- Down + closing
- —
- Monthly P&I
- —
- Monthly cashflow
- —
- DSCR
- —
- Eligible?
- —
No personal income docs; deal must DSCR.
Hard money
10% down · 12.0% · 12mo
- Down + closing
- —
- Monthly P&I
- —
- Monthly cashflow
- —
- DSCR
- —
- Eligible?
- —
Short-term bridge; refi at stabilization.
Rent comps 4 comps
| Address | Beds | Baths | Sqft | Rent | $/sqft | DOM | Units | Dist |
|---|---|---|---|---|---|---|---|---|
| 1305 White St Unit 1315-A Lexington, NC | 2.0 | 1.5 | 900 | $875 | $0.97 | 16d | 1 | 0.35mi |
| 420 Salem St Unit H Lexington, NC | 2.0 | 1.5 | 1100 | $875 | $0.80 | 21d | 1 | 0.61mi |
| 206 Crane Creek Way Lexington, NC | 3.0 | 2.5 | 1588 | $1,650 | $1.04 | 25d | 1 | 1.28mi |
| 154 Hill Everhart Rd Lexington, NC | 1.0–2.0 | 1.0–2.0 | 820 | $1,100 | $1.34 | 16d | 4 | 1.49mi |
Listing history 9 events
-
2026-06-21days on market $170,000 Active 13 DOM
-
2026-06-18days on market $170,000 Active 10 DOM
-
2026-06-17days on market $170,000 Active 9 DOM
-
2026-06-16days on market $170,000 Active 8 DOM
-
2026-06-15days on market $170,000 Active 7 DOM
-
2026-06-14days on market $170,000 Active 5 DOM
-
2026-06-10days on market $170,000 Active 2 DOM
-
2026-06-09remarks 126-char remark
-
2026-06-09$170,000 Active 1 DOM
ⓘ Source: listings_history table (triggers on properties + properties_extension) + one-shot
backfill from property_details.listing_events for pre-trigger history.
Tax reassessment forecast NC · Resets to sale price
- Current annual tax
- $660 · $55/mo
- Projected year-2 tax
- $1,394 · $116/mo
- Expected delta
- +$734/yr (+$61/mo · 111.1%)
ⓘ Screening estimate from a state-policy table — verify with the county assessor before closing.
Climate risk First Street
- Flood 1/10 Low FEMA zone X (unshaded) · 0% chance over 30 yrs
- Wildfire 1/10 Low
- Heat 6/10 Major 7 d/yr ≥104°F today · 17 d/yr by 30 yrs out
- Wind 4/10 Moderate 12% chance of damaging wind over 30 yrs
- Air quality 2/10 Low 1 unhealthy d/yr today · 2 by 30 yrs out
Nearby sold comps map
Loading sold comps map…
Walkable amenities ~0.75 mi
Loading nearby amenities…
Taxation est. · year 1
- Rental income
- $16,649
- − Mortgage interest
- −$9,523
- − Property taxes
- −$660
- − Insurance
- −$850
- − Repairs & maintenance
- −$1,332
- − Management
- −$1,332
- − Depreciation
- −$4,945
- Taxable loss
- −$1,993
- Est. tax savings @ 24.0%
- +$478
- After-tax cash flow
- $1,423/yr
For passive investors: Depreciation is non-cash, so a rental often shows a tax loss while cash-flowing — sheltering income. Rental losses are passive: they offset passive income freely, and up to $25,000/yr can offset ordinary (W-2) income if you actively participate and your MAGI is under $100k (phasing out to $0 by $150k); unused losses carry forward. On sale, claimed depreciation is recaptured at up to 25%, and gains may owe capital-gains tax (a 1031 exchange can defer both). Figures are a year-1 estimate at your 24.0% rate — not tax advice; consult a CPA.
Schools (NCES district)
- District
- Lexington City Schools
- NCES district ID
- 3702640
- Math proficiency
- 32% ▲ 3.00%
- Reading proficiency
- 38% ▲ 6.00%
- Median HH income
- $27,758
- Composite
- 28.2/100
- National rank
- #6807
- State rank
- #136 of 178 in NC
Livability — Lexington
- Score
- 72/100
- State rank
- #89
- US rank
- #6051
Category grades
Schools grade is shown separately in the Schools card above.
Census & demographics
- Census place
- Lexington, NC
- County
- Davidson County · 129,088 people
- City population
- 79,578
- Metro
- Winston-Salem, NC
- Population (ZIP)
- 39,267
- Household income
- $63,961
- Rent vs Own
- Severe rent burden
- 733.0
Population outlook (Davidson County) Hauer SSP2
- Today (2025)
- 167,156 people
- By 2030
- 167,216 · +0.0%
- By 2040
- 164,524 · -1.6%
- By 2050
- 157,229 · -5.9%
- By 2075
- 138,084 · -17.4%
- By 2100
- 112,729 · -32.6%
Race, ethnicity, and origin ACS 2023
- Neighborhood character
- Predominantly White (82%)
- Race & ethnicity
- White 82% Hispanic / Latino 6% Black 6% Two or more races 4% Asian 3%
- Hispanic origin (detail)
- Mexican 4%
- Common ancestry
- Serbian 2% Slovak 2% Italian 2%
- Foreign-born
- 5% · Canada, Jamaica
- Languages at home
- 93% English-only · Spanish 5% Other Asian/Pacific 1%
Political lean MEDSL · Davidson
- 2024 margin
- Solid R (+47.1) · D 25.9% · R 73.0% · Other 1.1%
- 2008→2024 swing
- -13.5pp toward R · 2008: -33.5pp · 2024: -47.1pp
- All cycles
- 2024: R+47.1 2020: R+47.5 2016: R+49.4 2012: R+40.9 2008: R+33.5
Not yet ingested
- Civics
- —
Market trends
- HPI YoY
- ▼ -46.39%
- Current HPI
- 258.6557
- Rent YoY
- ▲ 3.37%
- Metro
- Winston-Salem, NC
- State GDP YoY
- ▲ 3.28%
- F500 in state
- 26
Industry mix (Fortune 500 HQ in NC)
| Industry | F500 HQs | Revenue |
|---|---|---|
| Financial Services | 2 | $213B |
|
||
| Retail | 2 | $95B |
|
||
| Industrial Conglomerate | 1 | $38B |
|
||
| Metals / Steel | 1 | $35B |
|
||
| Utilities | 1 | $30B |
|
||
| Industrial Machinery | 1 | $19B |
|
||
Price history
+123.7% since first listed5 events — show timeline
- 2026-06-08 Listed $170,000 Triad MLS
- 2025-02-25 Sold (Public Records) $50,000 Public Records
- 1997-08-01 Sold (Public Records) $38,000 Public Records
- 1997-08-01 Sold (Public Records) $38,000 Public Records
- 1997-08-01 Sold (Public Records) $76,000 Public Records
Property tax history
+1.2%/yrLatest (2025): $660 · +0.0% YoY. Source: county tax records.
Cash-flow waterfall
monthlySold comps — $/sqft
last 12 mo · ≤1 miLoading sold comps…