 Duplex
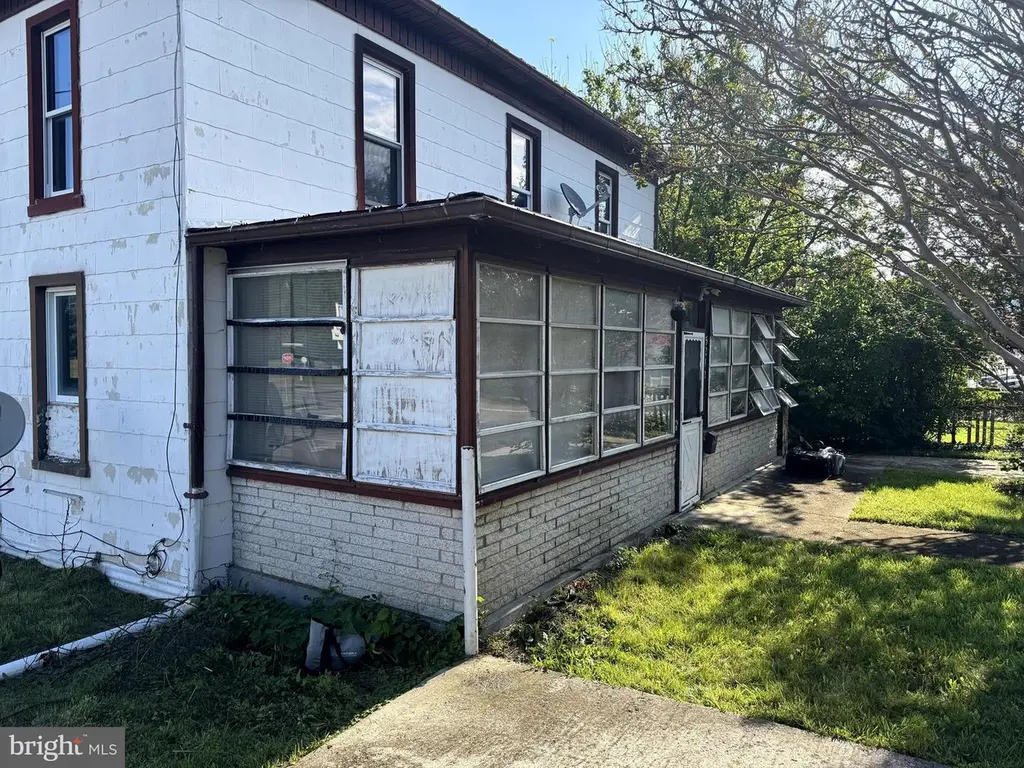
521 W Main St · Romney, WV
Flood risk 1/10 · Minimal
- FEMA flood zone
- X (unshaded)
- Chance of flooding over 30 yrs
- 0.0%
- Est. flood insurance / yr
- $473 – $860
Fire risk 4/10 · Minor
- Est. fire insurance / yr
- $787 – $1,461
Heat risk 5/10 · Moderate
- Hot days now (above 96°F)
- 7 days/yr
- Hot days in 30 yrs
- 19 days/yr
Wind risk 2/10 · Minimal
- Chance of severe wind over 30 yrs
- 0.0%
Air-quality risk 1/10 · Minimal
- Unhealthy air days now
- 0 days/yr
- Unhealthy air days in 30 yrs
- 0 days/yr
Risk factors via First Street. Map © Google.
Why this score? — see what drove the B- grade
The composite is a weighted blend of 9 inputs, each scored 0–100. Each bar is that input's sub-score; the figure is the points it added to the 100-point composite (weight × sub-score).
- Cash flow +27.8/30.0
- DSCR +9.8/10.0
- ARV discount +7.5/15.0
- 1% rule +6.8/10.0
- Appreciation +4.9/10.0
- Livability +3.6/5.0
- Schools +2.6/10.0
- Rent growth +2.5/5.0
- Condition / age +2.5/5.0
$174,500
🖨 Deal sheet 📄 Offer letter ✓ Due diligence
Multi-family units
County records classify this as Multi-Family (2-4 Unit). Listing-text estimate: 2 units. confirmed
Listing remarks
Incredible investment opportunity in Romney, West Virginia—the historic first town of the state! This rare, legally zoned duplex features two separate units, each offering 2 bedrooms and 1 bathroom. Whether you are a seasoned investor looking to expand your portfolio or a first-time buyer by living in one unit and letting the other pay your mortgage, this property delivers immense potential. Property Features: Two distinct legal rental units under one roof. Layout: Both individual units feature 2 bedrooms and 1 bathroom. : Situated in the historic heart of Romney, WV. Strategy: Perfect for a complete rental portfolio addition.
Key facts
- Legally zoned duplex
- 9,034 sq ft lot
- Built 1900
Tags
Property features AI
Finance
- Financial info: Fee simple ownership; Improvement assessed value noted; Land assessed value noted; Tax assessed value noted
Exterior
- Parking: Driveway
- Utilities: Public water; Public sewer; Electric cooling fuel
- Home design: Detached structure; Above-grade living space approximately 1,700 (estimated)
- Construction: Frame construction; Block foundation; Other structures above and below grade
- Exterior features: Property is inside city limits; No tidal water
Interior
- Bedrooms: Two 2-bedroom units
- Flooring: Wood flooring; Vinyl flooring
- Heating & cooling: Oil heating; Central air conditioning; Electric hot water
- Interior features: Estimated living area; Two-unit property
Neighborhood map
What this means for you Summary
Snapshot
- This is a 2 × 2-bed/1-bath units multifamily listed at $174k.
Deal economics
- At list price, monthly cash flow is $533 ($6k/yr) — positive. Per door: $266/mo.
- The deal already cash-flows at list — no discount required.
- Meets the 1% rule at list price ($2k rent vs $174k).
- Recommended offer: $172k (1.5% below list) — sets the bar for market timing.
- Cap rate 10.0% vs local median 3.5% in Romney — top-decile yield for the area; either an underpriced asset or a hidden risk that comps aren't pricing in. Stress-test before assuming the spread holds.
Location & tenants
- Location reads 72/100 on livability (#43 in WV) — a middle-class / working-renter tenant base. Strengths: cost of living A+, housing A+, health & safety A+; Watch: crime D-, commute F, employment F.
- Hampshire County Schools (rural): math 25% / reading 38% proficiency, ranked #30 of 55 in WV (top 54%) — families likely to look elsewhere, expect single-tenant / working-renter base with shorter leases.
- Market conditions: 58 active listings in the ZIP; 124 units permitted in Hampshire County in 2024 (0 in 5+ unit buildings).
Forward outlook
- In year one you build about $990 of equity ($1k loan paydown + $-216 appreciation (-0.1% local appreciation)).
- Hampshire County population projected at -29% by 2050 — secular population decline; favor cash flow + early exit over multi-decade hold.
- At projected returns (-0.1% appreciation + 3.0% rent growth), your $49k cash investment doubles in ~6 years — after that, you're playing with house money.
Negotiation context
- It's been on market 18 days — a 2% lower offer ($172k) is reasonable based on typical stale-listing flexibility.
Risks & watch-outs
- Watch-outs: built in 1900 — expect roof / HVAC / electrical / plumbing capex.
- Climate carrying-cost: extreme-heat days projected 7→19/yr by 2055 (HVAC capex compounding) — expect insurance premiums to compound above CPI over the hold.
Questions for the listing agent
- Can we see the unit-by-unit rent roll, current vacancy, and any below-market leases? What's the average tenancy length?
- What capital expenditures (roof, boiler, parking lot, exteriors) have been made in the last 5 years, and what's planned in the next 2?
- Built in 1900 — when were the roof, HVAC, electrical panel, plumbing, and water heater last replaced?
- Is there a deadline driving the sale (1031 exchange, divorce, estate, relocation)? That informs how much negotiation room exists.
- Crime grade is D in this area — have there been break-ins, vandalism, or insurance claims at this property in the last 3 years? What carrier currently insures it and at what premium?
- What's the average days-on-market for RENTAL listings here right now (not sales)? A rising rental-DOM trend means longer vacancies and softer asking-rent achievability than the comps imply.
- What's the recent tenant-quality profile in this submarket — average credit score on applications, eviction rate, late-payment / NSF rate, and stable-employment percentage? A property-management company in the area should have these aggregated.
- How much new apartment / multifamily construction is in the pipeline within 1–3 miles? Heavy new supply (>2% of stock underway) typically softens rents 12–24 months out; light construction supports rent growth.
Investment metrics
- 1% rule
- 1.18% ✓
- Cap rate
- 9.96%
- Cash-on-cash
- 13.08%
- DSCR
- 1.58
- GRM
- 7.0
CMA / ARV
No comps found within radius.
Projected returns pro-forma
-0.12% appreciation · 3.0% rent growth · sell at horizon
- IRR
- 12.0%
- Equity multiple
- 1.57×
- Total profit
- $27,772
- Equity at exit
- $49,592
- IRR
- 16.9%
- Equity multiple
- 2.83×
- Total profit
- $89,478
- Equity at exit
- $58,759
Cash invested: $48,860 (down + closing). Projections, not guarantees.
Landlord ↔ Tenant lean methodology
- Overall (STATE)
- 83 Strongly Landlord-Friendly
- State West Virginia
- 83 Strongly Landlord-Friendly · R+22
- County
- — inherits STATE
- City
- — inherits STATE
ZIP-level market 26757
- Home prices YoY
- -0.1%
- Active inventory
- 58
- Price-to-rent
- 14.1×
Monthly cashflow live
- Estimated rent
- $2,063 medium interval (Pro) →
- Mortgage (P&I)
- −$915
- Tax from tax record
- −$109 /mo · $1,312/yr
- Insurance
- −$73
- HOA
- −$0
- Vacancy / Maint / Mgmt
- −$433
- Net cashflow
- $533
Break-even live
2-unit breakdown (identical units grouped — click to expand)
| Units | Beds | Baths | Est. rent |
|---|---|---|---|
| 2× units | 2 | 1 | $2,062 |
| #1 | 2 | 1 | $1,031 |
| #2 | 2 | 1 | $1,031 |
| Total (2 units) | $2,063 | ||
UW: 25.0% down · 7.5% · 30yr · 1.5% tax · 5.0% vac · 8.0% maint · 8.0% mgmt
Financing live
Cash to close
- Down payment
- $43,625
- Closing costs
- $5,235
- Reserves months
- —
- Total cash needed
- —
Loan-product check · same deal, 3 products live
Conventional
25% down · 7.5% · 30yr
- Down + closing
- —
- Monthly P&I
- —
- Monthly cashflow
- —
- DSCR
- —
- Eligible?
- —
Personal DTI + credit; lowest rate.
DSCR
20% down · 8.5% · 30yr
- Down + closing
- —
- Monthly P&I
- —
- Monthly cashflow
- —
- DSCR
- —
- Eligible?
- —
No personal income docs; deal must DSCR.
Hard money
10% down · 12.0% · 12mo
- Down + closing
- —
- Monthly P&I
- —
- Monthly cashflow
- —
- DSCR
- —
- Eligible?
- —
Short-term bridge; refi at stabilization.
Listing history 14 events
-
2026-06-19days on market $174,500 Active 18 DOM
-
2026-06-18days on market $174,500 Active 17 DOM
-
2026-06-17days on market $174,500 Active 16 DOM
-
2026-06-16days on market $174,500 Active 15 DOM
-
2026-06-15days on market $174,500 Active 14 DOM
-
2026-06-14days on market $174,500 Active 12 DOM
-
2026-06-12days on market $174,500 Active 11 DOM
-
2026-06-09days on market $174,500 Active 8 DOM
-
2026-06-08days on market $174,500 Active 7 DOM
-
2026-06-07days on market $174,500 Active 6 DOM
-
2026-06-05days on market $174,500 Active 3 DOM
-
2026-06-03days on market $174,500 Active 2 DOM
-
2026-06-01remarks 634-char remark
-
2026-06-01$174,500 Active 1 DOM
ⓘ Source: listings_history table (triggers on properties + properties_extension) + one-shot
backfill from property_details.listing_events for pre-trigger history.
Tax reassessment forecast WV · Resets to sale price
- Current annual tax
- $1,312 · $109/mo
- Projected year-2 tax
- $1,312 · $109/mo
- Expected delta
- $0/yr ($0/mo · 0.0%)
ⓘ Screening estimate from a state-policy table — verify with the county assessor before closing.
Climate risk First Street
- Flood 1/10 Low FEMA zone X (unshaded) · 0% chance over 30 yrs
- Wildfire 4/10 Moderate
- Heat 5/10 Major 7 d/yr ≥96°F today · 19 d/yr by 30 yrs out
- Wind 2/10 Low 0% chance of damaging wind over 30 yrs
- Air quality 1/10 Low 0 unhealthy d/yr today · 0 by 30 yrs out
Nearby sold comps map
Loading sold comps map…
Walkable amenities ~0.75 mi
Loading nearby amenities…
Taxation est. · year 1
- Rental income
- $24,756
- − Mortgage interest
- −$9,775
- − Property taxes
- −$1,312
- − Insurance
- −$872
- − Repairs & maintenance
- −$1,980
- − Management
- −$1,980
- − Depreciation
- −$5,076
- Taxable income
- $3,760
- Est. tax owed @ 24.0%
- −$902
- After-tax cash flow
- $5,490/yr
For passive investors: Depreciation is non-cash, so a rental often shows a tax loss while cash-flowing — sheltering income. Rental losses are passive: they offset passive income freely, and up to $25,000/yr can offset ordinary (W-2) income if you actively participate and your MAGI is under $100k (phasing out to $0 by $150k); unused losses carry forward. On sale, claimed depreciation is recaptured at up to 25%, and gains may owe capital-gains tax (a 1031 exchange can defer both). Figures are a year-1 estimate at your 24.0% rate — not tax advice; consult a CPA.
Schools (NCES district)
- District
- Hampshire County Schools
- NCES district ID
- 5400420
- Math proficiency
- 25% ▼ -16.00%
- Reading proficiency
- 38% ▼ -8.00%
- Median HH income
- $32,170
- Composite
- 25.69/100
- National rank
- #7392
- State rank
- #30 of 55 in WV
Livability — Romney
- Score
- 72/100
- State rank
- #43
- US rank
- #5809
Category grades
Schools grade is shown separately in the Schools card above.
Census & demographics
- Census place
- Romney, WV
- Population (ZIP)
- 7,020
Population outlook (Hampshire County) Hauer SSP2
- Today (2025)
- 21,820 people
- By 2030
- 20,690 · -5.2%
- By 2040
- 18,089 · -17.1%
- By 2050
- 15,413 · -29.4%
- By 2075
- 10,421 · -52.2%
- By 2100
- 6,842 · -68.6%
Race, ethnicity, and origin ACS 2023
- Neighborhood character
- Predominantly White (94%)
- Race & ethnicity
- White 94% Two or more races 5%
- Common ancestry
- Lithuanian 3% Slovak 3% Serbian 1%
- Foreign-born
- 0%
Political lean MEDSL · Hampshire
- 2024 margin
- Solid R (+62.6) · D 18.0% · R 80.6% · Other 1.4%
- 2008→2024 swing
- -35.8pp toward R · 2008: -26.8pp · 2024: -62.6pp
- All cycles
- 2024: R+62.6 2020: R+60.4 2016: R+59.2 2012: R+40.4 2008: R+26.8
Not yet ingested
- Civics
- —
Market trends
- HPI YoY
- ▼ -0.12%
- Current HPI
- 175.7403
- Rent YoY
- —
- Metro
- —
- State GDP YoY
- —
- F500 in state
- 0
Price history
1 event — show timeline
- 2026-06-01 Listed $174,500 BRIGHT MLS
Property tax history
+0.6%/yrLatest (2025): $1,312 · +7.0% YoY. Source: county tax records.
Cash-flow waterfall
monthlySold comps — $/sqft
last 12 mo · ≤1 miLoading sold comps…