12442 Cople · Piney Point, MD
Flood risk 1/10 · Minimal
- FEMA flood zone
- X (unshaded)
- Chance of flooding over 30 yrs
- 0.0%
- Est. flood insurance / yr
- $507 – $1,088
Fire risk 4/10 · Minor
- Est. fire insurance / yr
- $666 – $1,236
Heat risk 8/10 · Major
- Hot days now (above 104°F)
- 7 days/yr
- Hot days in 30 yrs
- 16 days/yr
Wind risk 6/10 · Moderate
- Chance of severe wind over 30 yrs
- 64.0%
Air-quality risk 1/10 · Minimal
- Unhealthy air days now
- 0 days/yr
- Unhealthy air days in 30 yrs
- 0 days/yr
Risk factors via First Street. Map © Google.
Why this score? — see what drove the B+ grade
The composite is a weighted blend of 9 inputs, each scored 0–100. Each bar is that input's sub-score; the figure is the points it added to the 100-point composite (weight × sub-score).
- Cash flow +30.0/30.0
- 1% rule +10.0/10.0
- DSCR +10.0/10.0
- ARV discount +7.5/15.0
- Appreciation +5.6/10.0
- Schools +4.0/10.0
- Livability +3.1/5.0
- Rent growth +2.5/5.0
- Condition / age +2.5/5.0
$65,000
🖨 Deal sheet 📄 Offer letter ✓ Due diligence
Listing remarks MLS
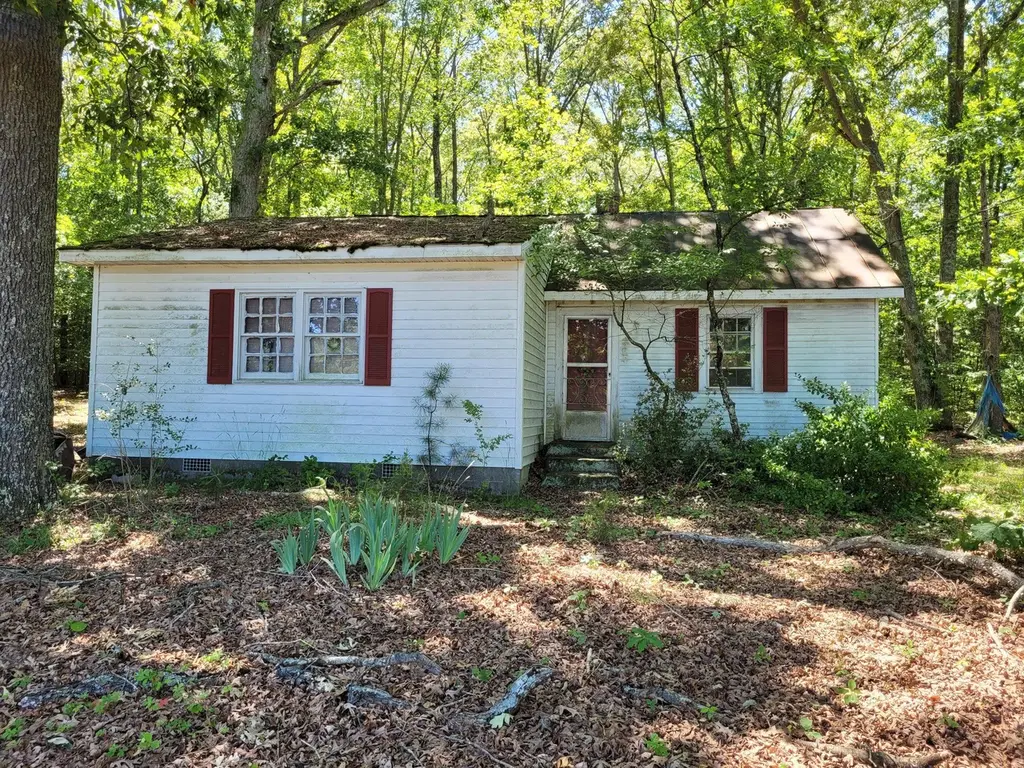
Opportunity awaits in Kinsale, Virginia! Located in Westmoreland County, this property offers potential for investors, renovators, or buyers looking for their next project. The home features approximately three bedrooms and one bathroom, along with an existing well, kitchen area, and electric service available to the property (currently inactive). The property also includes multiple storage sheds that convey with the sale and existing exterior plumbing features. No septic system is currently present on the property. Conveniently situated near the amenities and recreational opportunities of Virginia's Northern Neck, this property presents an opportunity to restore, renovate, or reimagine according to your goals. Property is being sold strictly As-Is, Where-Is. Buyer is responsible for conducting all due diligence regarding property condition, utilities, zoning, and intended use. Adjoining +/- 0.05 lot is included in sale. Contact Listing Agent to schedule a showing.
Key facts
- 8,276 sq ft lot
- Built 1930
- Listed 5 days
Property features AI
Exterior
- Parking: Driveway
- Utilities: Electric service available; Private well water; No septic system / no septic approved
- Home design: Detached property; Year of major remodel 1989; Year built estimated
- Construction: Aluminum siding; Metal roof; Concrete perimeter foundation and crawl space; Above-grade structure
- Exterior features: Private well water; No tidal water; +/- 0.05 acre adjoining parcel included in total lot
Interior
- Bedrooms: 3 bedrooms on the main level
- Bathrooms: 1 full bathroom (main level)
- Heating & cooling: Baseboard electric heating; Oil heating available
- Interior features: Estimated living area; No basement; 6 total rooms
Neighborhood map
What this means for you Summary
Snapshot
- This is a 3-bed/1.0-bath single-family listed at $65k.
Deal economics
- At list price, monthly cash flow is $417 ($5k/yr) — positive.
- The deal already cash-flows at list — no discount required.
- Meets the 1% rule at list price ($1k rent vs $65k).
Location & tenants
- Location reads 62/100 on livability (#321 in MD) — a middle-class / working-renter tenant base. Strengths: crime A+, employment A+, housing A+; Watch: schools D, amenities F, commute F.
- Westmoreland County Public School District (rural): math 34% / reading 59% proficiency, ranked #105 of 131 in VA (top 80%) — families likely to look elsewhere, expect single-tenant / working-renter base with shorter leases; 64% free/reduced lunch — lower-income household profile, screen leases tightly.
- Market conditions: 220 units permitted in Westmoreland County in 2024 (0 in 5+ unit buildings).
Forward outlook
- In year one you build about $1k of equity ($449 loan paydown + $784 appreciation (1.2% local appreciation)).
- Westmoreland County population projected to shrink 7% by 2050 — rents likely to lag national; underwrite the cash flow, not the appreciation.
- At projected returns (1.2% appreciation + 3.0% rent growth), your $18k cash investment doubles in ~3 years — after that, you're playing with house money.
Negotiation context
- Only 5 days on market — expect competitive offers; lowballing is unlikely to land.
- 2 sale attempts with the ask held roughly flat each time — persistent listings suggest the price (not the market) is what's stuck; bring a comps-based counter.
Risks & watch-outs
- Watch-outs: built in 1930 — expect roof / HVAC / electrical / plumbing capex.
- Climate carrying-cost: major wind risk, 64% chance of damaging wind over 30y; extreme-heat days projected 7→16/yr by 2055 (HVAC capex compounding) — expect insurance premiums to compound above CPI over the hold.
Questions for the listing agent
- Built in 1930 — when were the roof, HVAC, electrical panel, plumbing, and water heater last replaced?
- Is there a deadline driving the sale (1031 exchange, divorce, estate, relocation)? That informs how much negotiation room exists.
- Schools are D-rated, which usually means shorter tenancies and higher turnover. Who's the typical renter profile here, and what's been the actual vacancy rate?
- What's the average days-on-market for RENTAL listings here right now (not sales)? A rising rental-DOM trend means longer vacancies and softer asking-rent achievability than the comps imply.
- What's the recent tenant-quality profile in this submarket — average credit score on applications, eviction rate, late-payment / NSF rate, and stable-employment percentage? A property-management company in the area should have these aggregated.
- How much new for-sale + rental construction is in the pipeline within 1–3 miles? Heavy new supply typically softens prices + rents 12–24 months out; constrained supply supports both.
Investment metrics
- 1% rule
- 1.60% ✓
- Cap rate
- 13.99%
- Cash-on-cash
- 27.49%
- DSCR
- 2.22
- GRM
- 5.2
CMA / ARV
No comps found within radius.
Projected returns pro-forma
1.21% appreciation · 3.0% rent growth · sell at horizon
- IRR
- 30.1%
- Equity multiple
- 2.56×
- Total profit
- $28,413
- Equity at exit
- $22,890
- IRR
- 32.4%
- Equity multiple
- 4.95×
- Total profit
- $71,905
- Equity at exit
- $30,967
Cash invested: $18,200 (down + closing). Projections, not guarantees.
Landlord ↔ Tenant lean methodology
- Overall (STATE)
- 27 Tenant-Leaning
- State Maryland
- 27 Tenant-Leaning · D+14
- County
- — inherits STATE
- City
- — inherits STATE
ZIP-level market 22488
- Home prices YoY
- 0.9%
- Price-to-rent
- 5.2×
Monthly cashflow live
- Estimated rent
- $1,039 medium interval (Pro) →
- Mortgage (P&I)
- −$341
- Tax from tax record
- −$36 /mo · $432/yr
- Insurance
- −$27
- HOA
- −$0
- Vacancy / Maint / Mgmt
- −$218
- Net cashflow
- $417
Break-even live
UW: 25.0% down · 7.5% · 30yr · 1.5% tax · 5.0% vac · 8.0% maint · 8.0% mgmt
Financing live
Cash to close
- Down payment
- $16,250
- Closing costs
- $1,950
- Reserves months
- —
- Total cash needed
- —
Loan-product check · same deal, 3 products live
Conventional
25% down · 7.5% · 30yr
- Down + closing
- —
- Monthly P&I
- —
- Monthly cashflow
- —
- DSCR
- —
- Eligible?
- —
Personal DTI + credit; lowest rate.
DSCR
20% down · 8.5% · 30yr
- Down + closing
- —
- Monthly P&I
- —
- Monthly cashflow
- —
- DSCR
- —
- Eligible?
- —
No personal income docs; deal must DSCR.
Hard money
10% down · 12.0% · 12mo
- Down + closing
- —
- Monthly P&I
- —
- Monthly cashflow
- —
- DSCR
- —
- Eligible?
- —
Short-term bridge; refi at stabilization.
Listing history 6 events
-
2026-06-18days on market $65,000 Active 5 DOM
-
2026-06-17days on market $65,000 Active 4 DOM
-
2026-06-16days on market $65,000 Active 3 DOM
-
2026-06-15days on market $65,000 Active 2 DOM
-
2026-06-14remarks 699-char remark
-
2026-06-14$65,000 Active 1 DOM
ⓘ Source: listings_history table (triggers on properties + properties_extension) + one-shot
backfill from property_details.listing_events for pre-trigger history.
Tax reassessment forecast MD · Partial reset (capped growth)
- Current annual tax
- $432 · $36/mo
- Projected year-2 tax
- $570 · $48/mo
- Expected delta
- +$138/yr (+$12/mo · 31.9%)
ⓘ Screening estimate from a state-policy table — verify with the county assessor before closing.
Climate risk First Street
- Flood 1/10 Low FEMA zone X (unshaded) · 0% chance over 30 yrs
- Wildfire 4/10 Moderate
- Heat 8/10 Severe 7 d/yr ≥104°F today · 16 d/yr by 30 yrs out
- Wind 6/10 Major 64% chance of damaging wind over 30 yrs
- Air quality 1/10 Low 0 unhealthy d/yr today · 0 by 30 yrs out
Nearby sold comps map
Loading sold comps map…
Walkable amenities ~0.75 mi
Loading nearby amenities…
Taxation est. · year 1
- Rental income
- $12,469
- − Mortgage interest
- −$3,641
- − Property taxes
- −$432
- − Insurance
- −$325
- − Repairs & maintenance
- −$998
- − Management
- −$998
- − Depreciation
- −$1,891
- Taxable income
- $4,185
- Est. tax owed @ 24.0%
- −$1,004
- After-tax cash flow
- $3,998/yr
For passive investors: Depreciation is non-cash, so a rental often shows a tax loss while cash-flowing — sheltering income. Rental losses are passive: they offset passive income freely, and up to $25,000/yr can offset ordinary (W-2) income if you actively participate and your MAGI is under $100k (phasing out to $0 by $150k); unused losses carry forward. On sale, claimed depreciation is recaptured at up to 25%, and gains may owe capital-gains tax (a 1031 exchange can defer both). Figures are a year-1 estimate at your 24.0% rate — not tax advice; consult a CPA.
Schools (NCES district)
- District
- Westmoreland County Public School District
- NCES district ID
- 5103980
- Math proficiency
- 34% ▼ -47.00%
- Reading proficiency
- 59% ▼ -11.00%
- Median HH income
- $51,665
- Composite
- 39.94/100
- National rank
- #3845
- State rank
- #105 of 131 in VA
Livability — Piney Point
- Score
- 62/100
- State rank
- #321
- US rank
- #16770
Category grades
Schools grade is shown separately in the Schools card above.
Census & demographics
- Population (ZIP)
- 807
Population outlook (Westmoreland County) Hauer SSP2
- Today (2025)
- 17,643 people
- By 2030
- 17,520 · -0.7%
- By 2040
- 17,041 · -3.4%
- By 2050
- 16,397 · -7.1%
- By 2075
- 15,012 · -14.9%
- By 2100
- 12,917 · -26.8%
Race, ethnicity, and origin ACS 2023
- Neighborhood character
- Diverse neighborhood (Simpson 0.60)
- Race & ethnicity
- White 51% Black 36% Hispanic / Latino 14% Two or more races 8%
- Hispanic origin (detail)
- Puerto Rican 14%
- Common ancestry
- Iranian 6% Portuguese 2% Italian 1%
- Foreign-born
- 2% · Canada
- Languages at home
- 86% English-only · Spanish 14%
Political lean MEDSL · Westmoreland
- 2024 margin
- R (+14.3) · D 42.4% · R 56.7%
- 2008→2024 swing
- -24.5pp toward R · 2008: 10.2pp · 2024: -14.3pp
- All cycles
- 2024: R+14.3 2020: R+8.2 2016: R+7.3 2012: D+0.5 2008: D+10.2
Not yet ingested
- Civics
- —
Market trends
- HPI YoY
- ▲ 1.21%
- Current HPI
- 128.8481
- Rent YoY
- —
- Metro
- —
- State GDP YoY
- ▲ 2.97%
- F500 in state
- 12
Industry mix (Fortune 500 HQ in MD)
| Industry | F500 HQs | Revenue |
|---|---|---|
| Aerospace / Defense | 1 | $71B |
|
||
| Utilities | 1 | $25B |
|
||
| Hotels | 1 | $24B |
|
||
| Consumer Goods | 1 | $7B |
|
||
| Real Estate | 1 | $6B |
|
||
| Chemicals | 1 | $2B |
|
||
Price history
+0.0% since first listed2 events — show timeline
- 2026-06-13 Listed $65,000 NNAR
- 2026-06-13 Listed $65,000 BRIGHT MLS
Property tax history
+4.2%/yrLatest (2025): $432 · +0.0% YoY. Source: county tax records.
Cash-flow waterfall
monthlySold comps — $/sqft
last 12 mo · ≤1 miLoading sold comps…