1110 12th Ave #818 · Pike Creek Valley, DE
Flood risk No data
- FEMA flood zone
- —
- Chance of flooding over 30 yrs
- —
- Est. flood insurance / yr
- —
Fire risk No data
- Est. fire insurance / yr
- —
Heat risk No data
- Hot days now (above threshold)
- —
- Hot days in 30 yrs
- —
Wind risk No data
- Chance of severe wind over 30 yrs
- —
Air-quality risk No data
- Unhealthy air days now
- —
- Unhealthy air days in 30 yrs
- —
Risk factors via First Street. Map © Google.
Why this score? — see what drove the C+ grade
The composite is a weighted blend of 9 inputs, each scored 0–100. Each bar is that input's sub-score; the figure is the points it added to the 100-point composite (weight × sub-score).
- Cash flow +30.0/30.0
- 1% rule +10.0/10.0
- DSCR +10.0/10.0
- Livability +3.5/5.0
- Schools +3.1/10.0
- Rent growth +3.0/5.0
- Condition / age +2.5/5.0
- ARV discount +0.0/15.0
- Appreciation +0.0/10.0
$109,000
🖨 Deal sheet 📄 Offer letter ✓ Due diligence
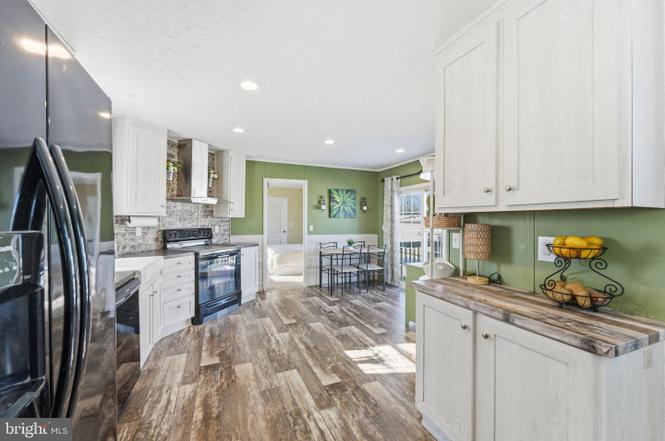
Listing remarks
If you are looking for a move-in ready home with a modern look and spacious living, this Clayton Anniversary Plus home was built in 2020 and will meet all your needs. Offering 1,140 square feet of comfortable living space, this home features 3 bedrooms, 2 full bathrooms, a bright family room, an eat-in kitchen, with all new appliances, and an adjoining laundry room with a new Samsung washer and dryer. Sliding doors leading out to the back deck complete this space. The primary bedroom features a walk-in closet, a private bathroom with a walk-in shower and garden tub. The front deck was built in March 2025. A 2-car driveway provides convenient parking. This home operates entirely on electric
Key facts
- 2 parking spots
- Built 2020
- Listed 60 days
Property features AI
Finance
- Other: Pets allowed (cats and dogs OK)
- Financial info: Improvement assessed value available
- HOA & community: Monthly land lease payment of $1,133; Land lease years remaining: 0
Exterior
- Parking: Driveway parking; 2 driveway spaces; 2 total garage/parking spaces
- Utilities: Public water; Public septic; Electric service for heating, cooling, and hot water
- Home design: Manufactured home; Single wide mobile home; Land lease ownership
- Construction: Year built (estimated)
- Exterior features: Above-grade and below-grade structures; Tidal water not present
Interior
- Bedrooms: 3 bedrooms on the main level
- Bathrooms: 2 full bathrooms on the main level
- Heating & cooling: Forced air heating (electric); Central air conditioning (electric); Electric hot water
- Interior features: Estimated living area; No basement
Neighborhood map
What this means for you Summary
Snapshot
- This is a 3-bed/2.0-bath single-family listed at $109k.
Deal economics
- At list price, monthly cash flow is $802 ($10k/yr) — positive.
- The deal already cash-flows at list — no discount required.
- Meets the 1% rule at list price ($2k rent vs $109k).
- Recommended offer: $106k (3.0% below list) — sets the bar for market timing.
- Cap rate 15.1% vs local median 4.7% in Pike Creek Valley — top-decile yield for the area; either an underpriced asset or a hidden risk that comps aren't pricing in. Stress-test before assuming the spread holds.
Location & tenants
- Location reads 69/100 on livability (#26 in DE) — a middle-class / working-renter tenant base. Strengths: housing A+, employment A, cost of living B+; Watch: amenities F, commute F, health & safety D-.
- Red Clay Consolidated School District (suburban): math 27% / reading 42% proficiency, ranked #12 of 26 in DE (top 46%) — families likely to look elsewhere, expect single-tenant / working-renter base with shorter leases.
- Market conditions: Rents rising (+2.0%/yr); 126 active listings in the ZIP; 5 comparable units currently listed for rent nearby; rentals leasing fast (median 2d on market — plan ~1-2 weeks tenant-placement turnaround); solid renter incomes; 1,367 units permitted in New Castle County in 2024 (201 in 5+ unit buildings).
Forward outlook
- Local home prices are declining (-3.0%/yr); year-one equity from $754 of loan paydown is wiped out by about $3k of value loss. Plan a longer hold.
- New Castle County population projected at +9% by 2050 — modest demand growth; plan on rents tracking national, not racing it.
- At projected returns (-3.0% appreciation + 2.0% rent growth), your $31k cash investment doubles in ~4 years — after that, you're playing with house money.
Negotiation context
- It's been on market 60 days — a 3% lower offer ($106k) is reasonable based on typical stale-listing flexibility.
Questions for the listing agent
- It's been on market 60 days. Have you received any prior offers? Is the seller open to a 3% concession, seller financing, or rate buy-down credit?
- Is there a deadline driving the sale (1031 exchange, divorce, estate, relocation)? That informs how much negotiation room exists.
- What's the average days-on-market for RENTAL listings here right now (not sales)? A rising rental-DOM trend means longer vacancies and softer asking-rent achievability than the comps imply.
- What's the recent tenant-quality profile in this submarket — average credit score on applications, eviction rate, late-payment / NSF rate, and stable-employment percentage? A property-management company in the area should have these aggregated.
- How much new for-sale + rental construction is in the pipeline within 1–3 miles? Heavy new supply typically softens prices + rents 12–24 months out; constrained supply supports both.
Investment metrics
- 1% rule
- 1.81% ✓
- Cap rate
- 15.12%
- Cash-on-cash
- 31.52%
- DSCR
- 2.40
- GRM
- 4.6
CMA / ARV
- ARV (on-the-fly)
- $85,500
- Comps found
- 12
Show comp detail 12 sales within ~0.75 mi
| Address | Dist | Beds/Ba | Sqft | Sold | Price | $/sf | Match |
|---|---|---|---|---|---|---|---|
| 74 Kathy Ln Unit A661 | 0.09mi | 2/2.0 (-1) | 1,056 (-7%) | 4mo | $76,000 | $72 | 76 |
| 134 Gale Dr | 0.09mi | 3/2.0 | 1,165 (+2%) | 20mo | $100,000 | $86 | 75 |
| 459 5th Ave | 0.34mi | 3/2.0 | 1,200 (+5%) | 3mo | $85,500 | $71 | 73 |
| 418 5th Ave | 0.29mi | 3/2.0 | 1,100 (-4%) | 10mo | $82,000 | $75 | 73 |
| 1104 12th Ave #815 | 0.03mi | 2/2.0 (-1) | 1,036 (-9%) | 13mo | $15,550 | $15 | 67 |
| 1122 12th Ave #824 | 0.06mi | 2/2.0 (-1) | 1,000 (-12%) | 14mo | $94,500 | $95 | 60 |
| 1041 11th Ave #744 | 0.16mi | 2/2.0 (-1) | 1,200 (+5%) | 24mo | $75,000 | $63 | 59 |
| 532 6th Ave Unit A329 | 0.26mi | 2/2.0 (-1) | 1,250 (+10%) | 17mo | $45,000 | $36 | 52 |
| 7 Theodora Ct | 0.63mi | 2/1.5 (-1) | 1,250 (+10%) | 3mo | $232,500 | $186 | 45 |
| 400 5th Ave Unit A236 | 0.29mi | 2/2.0 (-1) | 1,000 (-12%) | 20mo | $50,000 | $50 | 44 |
| 2030 Telegraph Rd | 0.59mi | 3/1.0 | 1,250 (+10%) | 10mo | $350,000 | $280 | 44 |
| 5007 Old Capitol Trl | 0.64mi | 3/2.0 | 1,225 (+8%) | 23mo | $335,000 | $273 | 39 |
Match score weights: distance 35% · size 25% · config 20% · recency 20%. Top-matched comps best support the ARV.
Projected returns pro-forma
-3.0% appreciation · 2.02% rent growth · sell at horizon
- IRR
- 25.3%
- Equity multiple
- 2.03×
- Total profit
- $31,498
- Equity at exit
- $16,252
- IRR
- 32.4%
- Equity multiple
- 3.80×
- Total profit
- $85,556
- Equity at exit
- $9,424
Cash invested: $30,520 (down + closing). Projections, not guarantees.
Landlord ↔ Tenant lean methodology
- Overall (STATE)
- 70 Landlord-Friendly
- State Delaware
- 70 Landlord-Friendly · D+7
- County
- — inherits STATE
- City
- — inherits STATE
ZIP-level market 19808
- Rents YoY
- 2.0%
- Active inventory
- 126
- Price-to-rent
- 4.6×
Monthly cashflow live
- Estimated rent
- $1,968 high interval (Pro) →
- Mortgage (P&I)
- −$572
- Tax est. 1.5%
- −$136 /mo · $1,635/yr
- Insurance
- −$45
- HOA
- −$0
- Vacancy / Maint / Mgmt
- −$413
- Net cashflow
- $802
Break-even live
UW: 25.0% down · 7.5% · 30yr · 1.5% tax · 5.0% vac · 8.0% maint · 8.0% mgmt
Financing live
Cash to close
- Down payment
- $27,250
- Closing costs
- $3,270
- Reserves months
- —
- Total cash needed
- —
Loan-product check · same deal, 3 products live
Conventional
25% down · 7.5% · 30yr
- Down + closing
- —
- Monthly P&I
- —
- Monthly cashflow
- —
- DSCR
- —
- Eligible?
- —
Personal DTI + credit; lowest rate.
DSCR
20% down · 8.5% · 30yr
- Down + closing
- —
- Monthly P&I
- —
- Monthly cashflow
- —
- DSCR
- —
- Eligible?
- —
No personal income docs; deal must DSCR.
Hard money
10% down · 12.0% · 12mo
- Down + closing
- —
- Monthly P&I
- —
- Monthly cashflow
- —
- DSCR
- —
- Eligible?
- —
Short-term bridge; refi at stabilization.
Rent comps 5 comps
| Address | Beds | Baths | Sqft | Rent | $/sqft | DOM | Units | Dist |
|---|---|---|---|---|---|---|---|---|
| 5597 Heritage Court Dr Apt 2B Wilmington, DE | 1.0–2.0 | 1.0 | 707 | $1,535 | $2.17 | 2d | 6 | 0.64mi |
| 39 Abbey Ln Newark, DE | 1.0–2.0 | 1.0 | 707 | $1,580 | $2.23 | 1d | 11 | 0.67mi |
| 5121 W Woodmill Dr Wilmington, DE | 2.0 | 1.5 | 1120 | $1,950 | $1.74 | 44d | 1 | 0.67mi |
| 229 E Green Valley Cir Newark, DE | 2.0 | 1.5 | 1250 | $2,050 | $1.64 | 1d | 1 | 1.05mi |
| 4608 Haverford Pl Wilmington, DE | 1.0–2.0 | 1.0 | 750 | $1,465 | $1.95 | 13d | 1 | 1.15mi |
Listing history 19 events
-
2026-06-18days on market $109,000 Active 60 DOM
-
2026-06-17days on market $109,000 Active 59 DOM
-
2026-06-16days on market $109,000 Active 58 DOM
-
2026-06-15days on market $109,000 Active 57 DOM
-
2026-06-13days on market $109,000 Active 55 DOM
-
2026-06-13days on market $109,000 Active 54 DOM
-
2026-06-10price $109,000 Active 51 DOM
-
2026-06-09days on market $115,000 Active 51 DOM
-
2026-06-08days on market $115,000 Active 50 DOM
-
2026-06-07days on market $115,000 Active 49 DOM
-
2026-06-04days on market $115,000 Active 46 DOM
-
2026-06-03days on market $115,000 Active 45 DOM
-
2026-06-02days on market $115,000 Active 44 DOM
-
2026-06-01days on market $115,000 Active 43 DOM
-
2026-05-31days on market $115,000 Active 42 DOM
-
2026-04-06historical Active Under Contract
-
2026-03-20price $115,000
-
2026-02-27$119,000 Active
-
2026-02-23historical $119,000
ⓘ Source: listings_history table (triggers on properties + properties_extension) + one-shot
backfill from property_details.listing_events for pre-trigger history.
Nearby sold comps map
Loading sold comps map…
Walkable amenities ~0.75 mi
Loading nearby amenities…
Taxation est. · year 1
- Rental income
- $23,618
- − Mortgage interest
- −$6,106
- − Property taxes
- −$1,635
- − Insurance
- −$545
- − Repairs & maintenance
- −$1,889
- − Management
- −$1,889
- − Depreciation
- −$3,171
- Taxable income
- $8,383
- Est. tax owed @ 24.0%
- −$2,012
- After-tax cash flow
- $7,607/yr
For passive investors: Depreciation is non-cash, so a rental often shows a tax loss while cash-flowing — sheltering income. Rental losses are passive: they offset passive income freely, and up to $25,000/yr can offset ordinary (W-2) income if you actively participate and your MAGI is under $100k (phasing out to $0 by $150k); unused losses carry forward. On sale, claimed depreciation is recaptured at up to 25%, and gains may owe capital-gains tax (a 1031 exchange can defer both). Figures are a year-1 estimate at your 24.0% rate — not tax advice; consult a CPA.
Schools (NCES district)
- District
- Red Clay Consolidated School District
- NCES district ID
- 1001300
- Math proficiency
- 27% ▼ -11.00%
- Reading proficiency
- 42% ▼ -7.00%
- Median HH income
- $64,298
- Composite
- 31.25/100
- National rank
- #6027
- State rank
- #12 of 26 in DE
Livability — Pike Creek Valley
- Score
- 69/100
- State rank
- #26
- US rank
- #8511
Category grades
Schools grade is shown separately in the Schools card above.
Census & demographics
- County
- New Castle County · 483,412 people
- Metro
- Philadelphia-Camden-Wilmington, PA-NJ-DE-MD
- Population (ZIP)
- 39,082
- Household income
- $94,234
- Rent vs Own
- Severe rent burden
- 619.0
Population outlook (New Castle County) Hauer SSP2
- Today (2025)
- 594,686 people
- By 2030
- 609,164 · +2.4%
- By 2040
- 632,154 · +6.3%
- By 2050
- 649,068 · +9.1%
- By 2075
- 687,771 · +15.7%
- By 2100
- 694,961 · +16.9%
Race, ethnicity, and origin ACS 2023
- Neighborhood character
- Predominantly White (66%)
- Race & ethnicity
- White 66% Hispanic / Latino 14% Asian 8% Black 8% Two or more races 7%
- Hispanic origin (detail)
- Mexican 7% Puerto Rican 3%
- Common ancestry
- Romanian 7% Lithuanian 1% Slovak 1%
- Foreign-born
- 14% · Canada, China, South Korea
- Languages at home
- 80% English-only · Spanish 12% Chinese 3% Other Indo-European 2%
Political lean MEDSL · New Castle
- 2024 margin
- Solid D (+32.6) · D 65.5% · R 32.9% · Other 1.6%
- 2008→2024 swing
- -8.1pp toward R · 2008: 40.6pp · 2024: 32.6pp
- All cycles
- 2024: D+32.6 2020: D+37.1 2016: D+29.6 2012: D+34.1 2008: D+40.6
Not yet ingested
- Civics
- —
Market trends
- HPI YoY
- ▼ -252.43%
- Current HPI
- 239.0702
- Rent YoY
- ▲ 2.02%
- Metro
- Philadelphia-Camden-Wilmington, PA-NJ-DE-MD
- State GDP YoY
- —
- F500 in state
- 0
Price history
-3.4% since first listed4 events — show timeline
- 2026-04-06 Contingent — BRIGHT MLS
- 2026-03-20 Price Changed $115,000 BRIGHT MLS
- 2026-02-27 Listed $119,000 BRIGHT MLS
- 2026-02-23 Coming Soon $119,000 BRIGHT MLS
Cash-flow waterfall
monthlySold comps — $/sqft
last 12 mo · ≤1 miLoading sold comps…