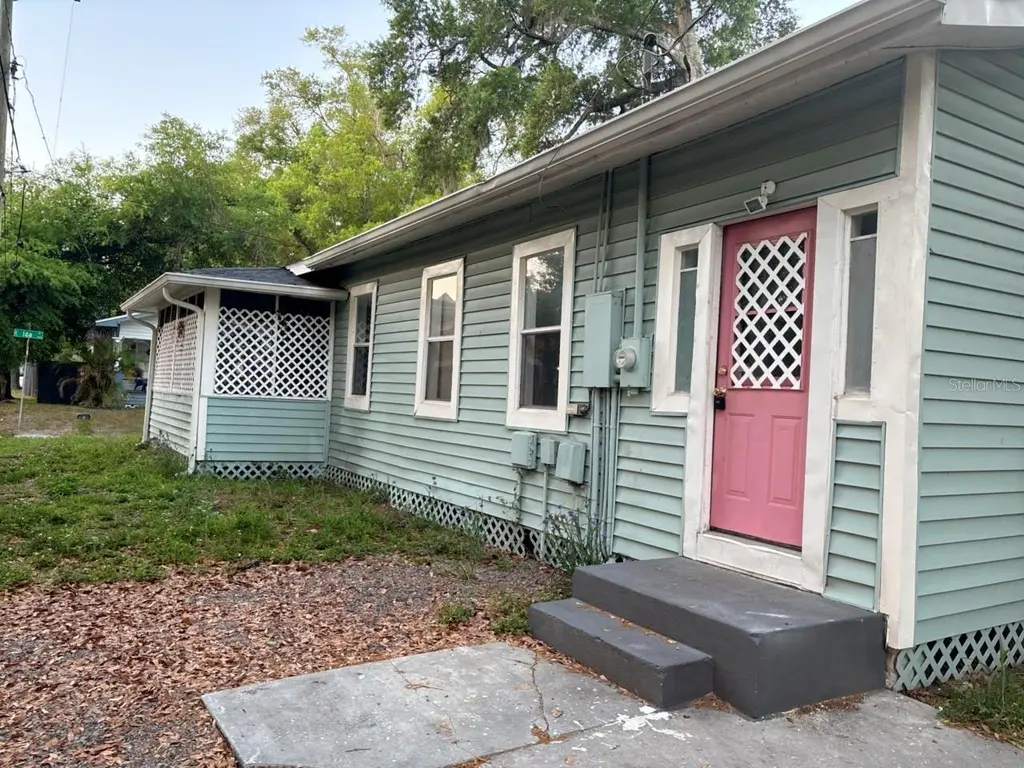
922 E Ida St · Tampa, FL
Flood risk 6/10 · Moderate
- FEMA flood zone
- X (unshaded)
- Chance of flooding over 30 yrs
- 0.72%
- Est. flood insurance / yr
- $507 – $1,088
Fire risk 1/10 · Minimal
- Est. fire insurance / yr
- $947 – $1,759
Heat risk 10/10 · Severe
- Hot days now (above 107°F)
- 7 days/yr
- Hot days in 30 yrs
- 26 days/yr
Wind risk 9/10 · Severe
- Chance of severe wind over 30 yrs
- 99.0%
Air-quality risk 3/10 · Minor
- Unhealthy air days now
- 3 days/yr
- Unhealthy air days in 30 yrs
- 4 days/yr
Risk factors via First Street. Map © Google.
Why this score? — see what drove the D grade
The composite is a weighted blend of 9 inputs, each scored 0–100. Each bar is that input's sub-score; the figure is the points it added to the 100-point composite (weight × sub-score).
- Cash flow +14.1/30.0
- ARV discount +7.5/15.0
- DSCR +4.3/10.0
- Schools +4.2/10.0
- Livability +4.0/5.0
- 1% rule +3.9/10.0
- Condition / age +2.5/5.0
- Rent growth +2.2/5.0
- Appreciation +0.0/10.0
$250,000
🖨 Deal sheet 📄 Offer letter ✓ Due diligence
Listing remarks MLS
Great opportunity to own a home in the highly desirable Seminole Heights historic district! This charming 3-bedroom, 2-bath residence blends classic character with modern updates, featuring a updated kitchen and bathrooms along with an open floor plan perfect for everyday living and entertaining. Situated on a spacious corner lot, this home offers added privacy and curb appeal. Enjoy the vibrant lifestyle Seminole Heights is known for—tree-lined streets, local coffee shops, popular breweries, dog parks, and scenic riverfront trails all just a short stroll away. Conveniently located with quick access to Downtown Tampa, Tampa International Airport, Water Street, and Florida’s world-famous beaches, this home offers the perfect mix of charm, location, and convenience. Don’t miss this exceptional opportunity!
Key facts
- Open floor plan
- Spacious corner lot
- Curb appeal
Tags
Neighborhood map
What this means for you Summary
Snapshot
- This is a 3-bed/2.0-bath single-family listed at $250k.
Deal economics
- At list price, monthly cash flow is $37 ($449/yr) — positive.
- The deal already cash-flows at list — no discount required.
- To meet the 1% rule (rent ≥ 1% of price), the offer needs to be $222k (11.4% below list).
- Recommended offer: $222k (11.4% below list) — sets the bar for 1% rule.
Location & tenants
- Location reads 79/100 on livability (#142 in FL, #2,135 nationally) — a middle-class / working-renter tenant base. Strengths: commute A+, housing A+, health & safety A+; Watch: schools C-, crime D+.
- Hillsborough (suburban): math 47% / reading 50% proficiency, ranked #41 of 73 in FL (top 56%) — families likely to look elsewhere, expect single-tenant / working-renter base with shorter leases.
- Market conditions: Rents soft (-1.3%/yr); 207 active listings in the ZIP; 40 comparable units currently listed for rent nearby; rentals at typical pace (median 20d on market — plan ~3-4 weeks tenant-placement turnaround); 9,053 units permitted in Hillsborough County in 2024 (4,555 in 5+ unit buildings).
- This rent runs 36% of the median local income ($74k/yr) — at the standard rent-burdened threshold; future hikes will face affordability resistance.
Forward outlook
- Local home prices are declining (-3.0%/yr); year-one equity from $2k of loan paydown is wiped out by about $8k of value loss. Plan a longer hold.
- Hillsborough County population projected at +37% by 2050 — long-run rental-demand tailwind backs the buy-and-hold thesis.
Negotiation context
- It's been on market 47 days — a 3% lower offer ($242k) is reasonable based on typical stale-listing flexibility.
- 16 sale attempts since 15y ago; this cycle's ask has dropped $25k (9%) from the opening price — seller is motivated, your offer sets the floor, not the list.
- Current owner paid $180k; 39% above their basis — modest negotiation headroom, anchor on the comps not their cost.
Risks & watch-outs
- Watch-outs: built in 1922 — expect roof / HVAC / electrical / plumbing capex.
- Climate carrying-cost: major flood risk; severe wind risk, 99% chance of damaging wind over 30y; extreme-heat days projected 7→26/yr by 2055 (HVAC capex compounding) — expect insurance premiums to compound above CPI over the hold.
Questions for the listing agent
- It's been on market 47 days. Have you received any prior offers? Is the seller open to a 11% concession, seller financing, or rate buy-down credit?
- Built in 1922 — when were the roof, HVAC, electrical panel, plumbing, and water heater last replaced?
- Is there a deadline driving the sale (1031 exchange, divorce, estate, relocation)? That informs how much negotiation room exists.
- Crime grade is D in this area — have there been break-ins, vandalism, or insurance claims at this property in the last 3 years? What carrier currently insures it and at what premium?
- The area grade is low — what's the realistic commute time and amenity access for the typical tenant pool here? Any planned neighborhood developments (good or bad) we should know about?
- What's the average days-on-market for RENTAL listings here right now (not sales)? A rising rental-DOM trend means longer vacancies and softer asking-rent achievability than the comps imply.
- What's the recent tenant-quality profile in this submarket — average credit score on applications, eviction rate, late-payment / NSF rate, and stable-employment percentage? A property-management company in the area should have these aggregated.
- How much new for-sale + rental construction is in the pipeline within 1–3 miles? Heavy new supply typically softens prices + rents 12–24 months out; constrained supply supports both.
Investment metrics
- 1% rule
- 0.89% ✗
- Cap rate
- 6.47%
- Cash-on-cash
- 0.64%
- DSCR
- 1.03
- GRM
- 9.4
CMA / ARV
No comps found within radius.
Projected returns pro-forma
-3.0% appreciation · 0.0% rent growth · sell at horizon
- IRR
- -18.7%
- Equity multiple
- 0.36×
- Total profit
- $-44,598
- Equity at exit
- $37,276
- IRR
- -18.6%
- Equity multiple
- 0.13×
- Total profit
- $-60,764
- Equity at exit
- $21,615
Cash invested: $70,000 (down + closing). Projections, not guarantees.
Landlord ↔ Tenant lean methodology
- Overall (STATE)
- 87 Strongly Landlord-Friendly
- State Florida
- 87 Strongly Landlord-Friendly · R+3
- County
- — inherits STATE
- City
- — inherits STATE
ZIP-level market 33603
- Rents YoY
- -1.3%
- Active inventory
- 207
- Price-to-rent
- 9.4×
Monthly cashflow live
- Estimated rent
- $2,216 high interval (Pro) →
- Mortgage (P&I)
- −$1,311
- Tax from tax record
- −$298 /mo · $3,575/yr
- Insurance
- −$104
- HOA
- −$0
- Vacancy / Maint / Mgmt
- −$465
- Net cashflow
- $37
Break-even live
UW: 25.0% down · 7.5% · 30yr · 1.5% tax · 5.0% vac · 8.0% maint · 8.0% mgmt
Financing live
Cash to close
- Down payment
- $62,500
- Closing costs
- $7,500
- Reserves months
- —
- Total cash needed
- —
Loan-product check · same deal, 3 products live
Conventional
25% down · 7.5% · 30yr
- Down + closing
- —
- Monthly P&I
- —
- Monthly cashflow
- —
- DSCR
- —
- Eligible?
- —
Personal DTI + credit; lowest rate.
DSCR
20% down · 8.5% · 30yr
- Down + closing
- —
- Monthly P&I
- —
- Monthly cashflow
- —
- DSCR
- —
- Eligible?
- —
No personal income docs; deal must DSCR.
Hard money
10% down · 12.0% · 12mo
- Down + closing
- —
- Monthly P&I
- —
- Monthly cashflow
- —
- DSCR
- —
- Eligible?
- —
Short-term bridge; refi at stabilization.
Rent comps 40 comps
| Address | Beds | Baths | Sqft | Rent | $/sqft | DOM | Units | Dist |
|---|---|---|---|---|---|---|---|---|
| 807 E Genesee St Unit 1/2 Tampa, FL | 3.0 | 2.0 | 1414 | $2,400 | $1.70 | 21d | 1 | 0.25mi |
| 807 E Genesee St Tampa, FL | 3.0 | 2.0 | 1414 | $2,400 | $1.70 | 19d | 1 | 0.25mi |
| 4207 N 13th St Unit A Tampa, FL | 2.0 | 2.0 | 832 | $2,150 | $2.58 | 24d | 1 | 0.31mi |
| 1305 E Louise Ave Tampa, FL | 3.0 | 2.0 | 1384 | $2,700 | $1.95 | 24d | 1 | 0.31mi |
| 3519 N 10th St Tampa, FL | 3.0 | 2.0 | 1200 | $1,850 | $1.54 | 17d | 1 | 0.32mi |
| 806 E Chelsea St Unit 4 Tampa, FL | 2.0 | 1.0 | 850 | $1,790 | $2.11 | 24d | 1 | 0.32mi |
| 3511 Cone Ct Tampa, FL | 3.0 | 2.0 | 1256 | $2,200 | $1.75 | 4d | 1 | 0.36mi |
| 1301 E Cayuga St Tampa, FL | 3.0 | 1.5 | 1216 | $2,200 | $1.81 | 24d | 1 | 0.39mi |
| 809 E Baker St Unit A Tampa, FL | 3.0 | 1.0 | 1083 | $2,200 | $2.03 | 24d | 1 | 0.40mi |
| 1504 E 33rd Ave Tampa, FL | 3.0 | 2.0 | 1108 | $2,900 | $2.62 | 24d | 1 | 0.41mi |
| 902 E Curtis St Unit 1 Tampa, FL | 2.0 | 2.0 | 1325 | $3,200 | $2.42 | 17d | 1 | 0.43mi |
| 1105 E 28th Ave Tampa, FL | 3.0 | 1.0 | 744 | $1,525 | $2.05 | 4d | 1 | 0.43mi |
| 4017 N Seminole Ave Tampa, FL | 4.0 | 1.0 | 1104 | $1,950 | $1.77 | 24d | 1 | 0.44mi |
| 709 E James St Tampa, FL | 2.0 | 1.0 | 768 | $1,695 | $2.21 | 12d | 1 | 0.45mi |
| 1602 E North Bay St Tampa, FL | 3.0 | 2.0 | 1200 | $2,100 | $1.75 | 24d | 1 | 0.48mi |
| 1515 E 31st Ave Tampa, FL | 2.0 | 1.0 | 914 | $1,500 | $1.64 | 4d | 1 | 0.50mi |
| 309 E Selma Ave Tampa, FL | 3.0 | 2.0 | 1170 | $3,095 | $2.65 | 4d | 1 | 0.51mi |
| 3411 N 13th St Tampa, FL | 3.0 | 2.0 | 978 | $1,895 | $1.94 | 24d | 1 | 0.51mi |
| 1006 E 26th Ave Tampa, FL | 2.0 | 1.0 | 1000 | $1,630 | $1.63 | 4d | 1 | 0.53mi |
| 1501 E Palifox St Tampa, FL | 3.0 | 2.0 | 1248 | $1,750 | $1.40 | 13d | 1 | 0.54mi |
| 302 E Selma Ave Tampa, FL | 3.0 | 1.0 | 989 | $2,200 | $2.22 | 24d | 1 | 0.54mi |
| 1212 E 25th Ave Tampa, FL | 2.0 | 1.0 | 1035 | $1,490 | $1.44 | 19d | 1 | 0.61mi |
| 1709 E Chelsea St Unit F Tampa, FL | 2.0 | 1.0 | 1041 | $1,625 | $1.56 | 23d | 1 | 0.63mi |
| 1605 E 29th Ave Tampa, FL | 3.0 | 1.0 | 870 | $1,800 | $2.07 | 20d | 1 | 0.65mi |
| 4513 N Florida Ave Tampa, FL | 2.0 | 1.0 | 887 | $2,299 | $2.59 | 1d | 6 | 0.70mi |
| 1202 E Caracas St Tampa, FL | 3.0 | 3.0 | 1224 | $2,595 | $2.12 | 24d | 1 | 0.71mi |
| 102 W Emma St Unit 1271942P Tampa, FL | 2.0 | 2.0 | 775 | $3,310 | $4.27 | 1d | 1 | 0.72mi |
| 1608 E New Orleans Ave Tampa, FL | 4.0 | 2.0 | 1254 | $1,895 | $1.51 | 14d | 1 | 0.75mi |
| 1003 E 22nd Ave Tampa, FL | 2.0 | 1.0 | 1062 | $1,639 | $1.54 | 4d | 1 | 0.76mi |
| 3210 N 16th St Tampa, FL | 4.0 | 2.0 | 1380 | $1,995 | $1.45 | 21d | 1 | 0.76mi |
| 3210 N 16th St Tampa, FL | 4.0 | 2.0 | 1380 | $1,875 | $1.36 | 2d | 1 | 0.76mi |
| 1711 E New Orleans Ave Tampa, FL | 3.0 | 2.0 | 1136 | $2,250 | $1.98 | 20d | 1 | 0.78mi |
| 1517 E Ellicott St Tampa, FL | 3.0 | 2.0 | 1292 | $2,225 | $1.72 | 16d | 1 | 0.78mi |
| 212 W North Bay St Tampa, FL | 3.0 | 1.0 | 1065 | $2,600 | $2.44 | 3d | 1 | 0.79mi |
| 1302 E 21st Ave Tampa, FL | 1.0–2.0 | 1.0–2.0 | 800 | $1,408 | $1.76 | 4d | 9 | 0.80mi |
| 411 E Adalee St Tampa, FL | 3.0 | 1.0 | 1200 | $2,500 | $2.08 | 24d | 1 | 0.80mi |
| 912 E Saint Clair St Tampa, FL | 2.0 | 1.0 | 1000 | $1,900 | $1.90 | 24d | 1 | 0.80mi |
| 203 W Emma St Tampa, FL | 3.0 | 2.0 | 1279 | $2,700 | $2.11 | 24d | 1 | 0.80mi |
| 203 W Emma St Tampa, FL | 3.0 | 2.0 | 1279 | $2,500 | $1.95 | 10d | 1 | 0.80mi |
| 3021 Sanchez St Tampa, FL | 3.0 | 1.0 | 1300 | $2,195 | $1.69 | 24d | 1 | 0.81mi |
Listing history 50 events
-
2026-05-19status Pending 833-char remark
Show marketing remark (833 chars)
Great opportunity to own a home in the highly desirable Seminole Heights historic district! This charming 3-bedroom, 2-bath residence blends classic character with modern updates, featuring a updated kitchen and bathrooms along with an open floor plan perfect for everyday living and entertaining. Situated on a spacious corner lot, this home offers added privacy and curb appeal. Enjoy the vibrant lifestyle Seminole Heights is known for—tree-lined streets, local coffee shops, popular breweries, dog parks, and scenic riverfront trails all just a short stroll away. Conveniently located with quick access to Downtown Tampa, Tampa International Airport, Water Street, and Florida’s world-famous beaches, this home offers the perfect mix of charm, location, and convenience. Don’t miss this exceptional opportunity!
-
2026-05-01price $250,000 833-char remark
Show marketing remark (833 chars)
Great opportunity to own a home in the highly desirable Seminole Heights historic district! This charming 3-bedroom, 2-bath residence blends classic character with modern updates, featuring a updated kitchen and bathrooms along with an open floor plan perfect for everyday living and entertaining. Situated on a spacious corner lot, this home offers added privacy and curb appeal. Enjoy the vibrant lifestyle Seminole Heights is known for—tree-lined streets, local coffee shops, popular breweries, dog parks, and scenic riverfront trails all just a short stroll away. Conveniently located with quick access to Downtown Tampa, Tampa International Airport, Water Street, and Florida’s world-famous beaches, this home offers the perfect mix of charm, location, and convenience. Don’t miss this exceptional opportunity!
-
2026-04-02$275,000 Active 833-char remark
Show marketing remark (833 chars)
Great opportunity to own a home in the highly desirable Seminole Heights historic district! This charming 3-bedroom, 2-bath residence blends classic character with modern updates, featuring a updated kitchen and bathrooms along with an open floor plan perfect for everyday living and entertaining. Situated on a spacious corner lot, this home offers added privacy and curb appeal. Enjoy the vibrant lifestyle Seminole Heights is known for—tree-lined streets, local coffee shops, popular breweries, dog parks, and scenic riverfront trails all just a short stroll away. Conveniently located with quick access to Downtown Tampa, Tampa International Airport, Water Street, and Florida’s world-famous beaches, this home offers the perfect mix of charm, location, and convenience. Don’t miss this exceptional opportunity!
-
2025-12-26historical
-
2024-02-14price $348,000
-
2024-01-09status Active
-
2024-01-06status Pending
-
2023-12-26$349,900 Active
-
2023-12-23historical
-
2023-09-28status Active
-
2023-09-28price $349,900
-
2023-08-31historical
-
2023-08-31$379,999 Active
-
2023-08-25price $349,999
-
2023-08-08$379,999 Active
-
2023-08-07historical
-
2023-08-04price $379,990
-
2023-07-29price $389,990
-
2023-07-11price $389,999
-
2023-06-24price $399,999
-
2023-06-19$410,000 Active
-
2023-03-15soldstatus $180,000
-
2023-02-15soldstatus $180,000 Closed
-
2023-01-18status Pending
-
2023-01-13status Active
-
2023-01-10status Pending
-
2022-12-21$230,000 Active
-
2018-06-26soldstatus $115,000
-
2018-06-20soldstatus $115,000 Sold
-
2018-06-05status Pending
-
2018-05-29status Active
-
2018-04-11status Pending
-
2018-04-09status Pending
-
2018-04-02status Active
-
2018-03-24status Pending
-
2018-03-22status Pending
-
2018-03-14status Pending
-
2018-03-07price $115,000
-
2018-02-27price $120,000
-
2018-02-21price $125,000
-
2018-02-14price $130,000
-
2018-02-07price $135,000
-
2018-01-31price $139,900
-
2018-01-11$149,900 Active
-
2014-05-01historical
-
2014-03-29historical
-
2014-01-31historical
-
2013-10-16$49,900
-
2013-10-16status Pending
-
2013-10-16$49,900
ⓘ Source: listings_history table (triggers on properties + properties_extension) + one-shot
backfill from property_details.listing_events for pre-trigger history.
Tax reassessment forecast FL · Resets to sale price
- Current annual tax
- $3,575 · $298/mo
- Projected year-2 tax
- $3,575 · $298/mo
- Expected delta
- $0/yr ($0/mo · 0.0%)
ⓘ Screening estimate from a state-policy table — verify with the county assessor before closing.
Climate risk First Street
- Flood 6/10 Major FEMA zone X (unshaded) · 72% chance over 30 yrs
- Wildfire 1/10 Low
- Heat 10/10 Extreme 7 d/yr ≥107°F today · 26 d/yr by 30 yrs out
- Wind 9/10 Extreme 99% chance of damaging wind over 30 yrs
- Air quality 3/10 Moderate 3 unhealthy d/yr today · 4 by 30 yrs out
Nearby sold comps map
Loading sold comps map…
Walkable amenities ~0.75 mi
Loading nearby amenities…
Taxation est. · year 1
- Rental income
- $26,590
- − Mortgage interest
- −$14,004
- − Property taxes
- −$3,575
- − Insurance
- −$1,250
- − Repairs & maintenance
- −$2,127
- − Management
- −$2,127
- − Depreciation
- −$7,273
- Taxable loss
- −$3,766
- Est. tax savings @ 24.0%
- +$904
- After-tax cash flow
- $1,353/yr
For passive investors: Depreciation is non-cash, so a rental often shows a tax loss while cash-flowing — sheltering income. Rental losses are passive: they offset passive income freely, and up to $25,000/yr can offset ordinary (W-2) income if you actively participate and your MAGI is under $100k (phasing out to $0 by $150k); unused losses carry forward. On sale, claimed depreciation is recaptured at up to 25%, and gains may owe capital-gains tax (a 1031 exchange can defer both). Figures are a year-1 estimate at your 24.0% rate — not tax advice; consult a CPA.
Schools (NCES district)
- District
- Hillsborough
- NCES district ID
- 1200870
- Math proficiency
- 47% ▼ -8.00%
- Reading proficiency
- 50% ▼ -4.00%
- Median HH income
- $50,622
- Composite
- 41.6/100
- National rank
- #3435
- State rank
- #41 of 73 in FL
Livability — Tampa
- Score
- 79/100
- State rank
- #142
- US rank
- #2135
Category grades
Schools grade is shown separately in the Schools card above.
Census & demographics
- Census place
- Tampa, FL
- County
- Hillsborough County · 1,540,968 people
- City population
- 523,346
- Metro
- Tampa-St. Petersburg-Clearwater, FL
- Population (ZIP)
- 19,869
- Household income
- $74,081
- Rent vs Own
- Severe rent burden
- 800.0
Population outlook (Hillsborough County) Hauer SSP2
- Today (2025)
- 1,607,022 people
- By 2030
- 1,733,968 · +7.9%
- By 2040
- 1,979,565 · +23.2%
- By 2050
- 2,203,427 · +37.1%
- By 2075
- 2,667,893 · +66.0%
- By 2100
- 2,891,558 · +79.9%
Race, ethnicity, and origin ACS 2023
- Neighborhood character
- Diverse neighborhood (Simpson 0.67)
- Race & ethnicity
- White 44% Hispanic / Latino 33% Two or more races 22% Black 17%
- Hispanic origin (detail)
- Mexican 1% Puerto Rican 7% Cuban 15% Dominican 1%
- Common ancestry
- Italian 3% Romanian 2% Slovak 2%
- Foreign-born
- 18% · Canada, Jamaica
- Languages at home
- 74% English-only · Spanish 25%
Political lean MEDSL · Hillsborough
- 2024 margin
- Toss-up / Even · D 47.8% · R 50.9% · Other 1.3%
- 2008→2024 swing
- -10.2pp toward R · 2008: 7.1pp · 2024: -3.1pp
- All cycles
- 2024: R+3.1 2020: D+6.9 2016: D+6.8 2012: D+6.7 2008: D+7.1
Not yet ingested
- Civics
- —
Market trends
- HPI YoY
- ▼ -256.57%
- Current HPI
- 467.4179
- Rent YoY
- ▼ -1.33%
- Metro
- Tampa-St. Petersburg-Clearwater, FL
- State GDP YoY
- ▲ 3.28%
- F500 in state
- 36
Industry mix (Fortune 500 HQ in FL)
| Industry | F500 HQs | Revenue |
|---|---|---|
| Industrial Technology | 2 | $29B |
|
||
| Insurance | 2 | $17B |
|
||
| Retail | 1 | $60B |
|
||
| Technology Distribution | 1 | $58B |
|
||
| Homebuilding | 1 | $35B |
|
||
| Technology Manufacturing | 1 | $35B |
|
||
Price history
+1566.7% since first listed56 events — show timeline
- 2026-05-19 Pending — Stellar MLS as Distributed by MLS Grid
- 2026-05-01 Price Changed $250,000 Stellar MLS as Distributed by MLS Grid
- 2026-04-02 Listed $275,000 Stellar MLS as Distributed by MLS Grid
- 2025-12-26 Listing Removed — Stellar MLS as Distributed by MLS Grid
- 2024-02-14 Price Changed $348,000 Stellar MLS as Distributed by MLS Grid
- 2024-01-09 Relisted — Stellar MLS as Distributed by MLS Grid
- 2024-01-06 Pending — Stellar MLS as Distributed by MLS Grid
- 2023-12-26 Listed $349,900 Stellar MLS as Distributed by MLS Grid
- 2023-12-23 Listing Removed — Stellar MLS as Distributed by MLS Grid
- 2023-09-28 Relisted — Stellar MLS as Distributed by MLS Grid
- 2023-09-28 Price Changed $349,900 Stellar MLS as Distributed by MLS Grid
- 2023-08-31 Listing Removed — Stellar MLS as Distributed by MLS Grid
- 2023-08-31 Listed $379,999 Stellar MLS as Distributed by MLS Grid
- 2023-08-25 Price Changed $349,999 Stellar MLS as Distributed by MLS Grid
- 2023-08-08 Listed $379,999 Stellar MLS as Distributed by MLS Grid
- 2023-08-07 Listing Removed — Stellar MLS as Distributed by MLS Grid
- 2023-08-04 Price Changed $379,990 Stellar MLS as Distributed by MLS Grid
- 2023-07-29 Price Changed $389,990 Stellar MLS as Distributed by MLS Grid
- 2023-07-11 Price Changed $389,999 Stellar MLS as Distributed by MLS Grid
- 2023-06-24 Price Changed $399,999 Stellar MLS as Distributed by MLS Grid
- 2023-06-19 Listed $410,000 Stellar MLS as Distributed by MLS Grid
- 2023-03-15 Sold (Public Records) $180,000 Public Records
- 2023-02-15 Sold (MLS) $180,000 Stellar MLS as Distributed by MLS Grid
- 2023-01-18 Pending — Stellar MLS as Distributed by MLS Grid
- 2023-01-13 Relisted — Stellar MLS as Distributed by MLS Grid
- 2023-01-10 Pending — Stellar MLS as Distributed by MLS Grid
- 2022-12-21 Listed $230,000 Stellar MLS as Distributed by MLS Grid
- 2018-06-26 Sold (Public Records) $115,000 Public Records
- 2018-06-20 Sold (MLS) $115,000 Stellar MLS as Distributed by MLS Grid
- 2018-06-05 Pending — Stellar MLS as Distributed by MLS Grid
- 2018-05-29 Relisted — Stellar MLS as Distributed by MLS Grid
- 2018-04-11 Pending — Stellar MLS as Distributed by MLS Grid
- 2018-04-09 Pending — Stellar MLS as Distributed by MLS Grid
- 2018-04-02 Relisted — Stellar MLS as Distributed by MLS Grid
- 2018-03-24 Pending — Stellar MLS as Distributed by MLS Grid
- 2018-03-22 Pending — Stellar MLS as Distributed by MLS Grid
- 2018-03-14 Pending — Stellar MLS as Distributed by MLS Grid
- 2018-03-07 Price Changed $115,000 Stellar MLS as Distributed by MLS Grid
- 2018-02-27 Price Changed $120,000 Stellar MLS as Distributed by MLS Grid
- 2018-02-21 Price Changed $125,000 Stellar MLS as Distributed by MLS Grid
- 2018-02-14 Price Changed $130,000 Stellar MLS as Distributed by MLS Grid
- 2018-02-07 Price Changed $135,000 Stellar MLS as Distributed by MLS Grid
- 2018-01-31 Price Changed $139,900 Stellar MLS as Distributed by MLS Grid
- 2018-01-11 Listed $149,900 Stellar MLS as Distributed by MLS Grid
- 2014-05-01 Listing Removed — Stellar MLS as Distributed by MLS Grid
- 2014-03-29 Listing Removed — Stellar MLS as Distributed by MLS Grid
- 2014-01-31 Listing Removed — Stellar MLS as Distributed by MLS Grid
- 2013-10-16 Listed $49,900 Stellar MLS as Distributed by MLS Grid
- 2013-10-16 Pending — Stellar MLS as Distributed by MLS Grid
- 2013-10-16 Listed $49,900 Stellar MLS as Distributed by MLS Grid
- 2012-03-27 Listing Removed — Stellar MLS as Distributed by MLS Grid
- 2012-02-27 Listed $28,500 Stellar MLS as Distributed by MLS Grid
- 2011-12-19 Listing Removed — Stellar MLS as Distributed by MLS Grid
- 2011-11-17 Listed $32,000 Stellar MLS as Distributed by MLS Grid
- 1987-05-01 Sold (Public Records) $15,000 Public Records
- 1984-12-01 Sold (Public Records) $15,000 Public Records
Property tax history
+11.9%/yrLatest (2025): $3,575 · +4.0% YoY. Source: county tax records.
Cash-flow waterfall
monthlySold comps — $/sqft
last 12 mo · ≤1 miLoading sold comps…