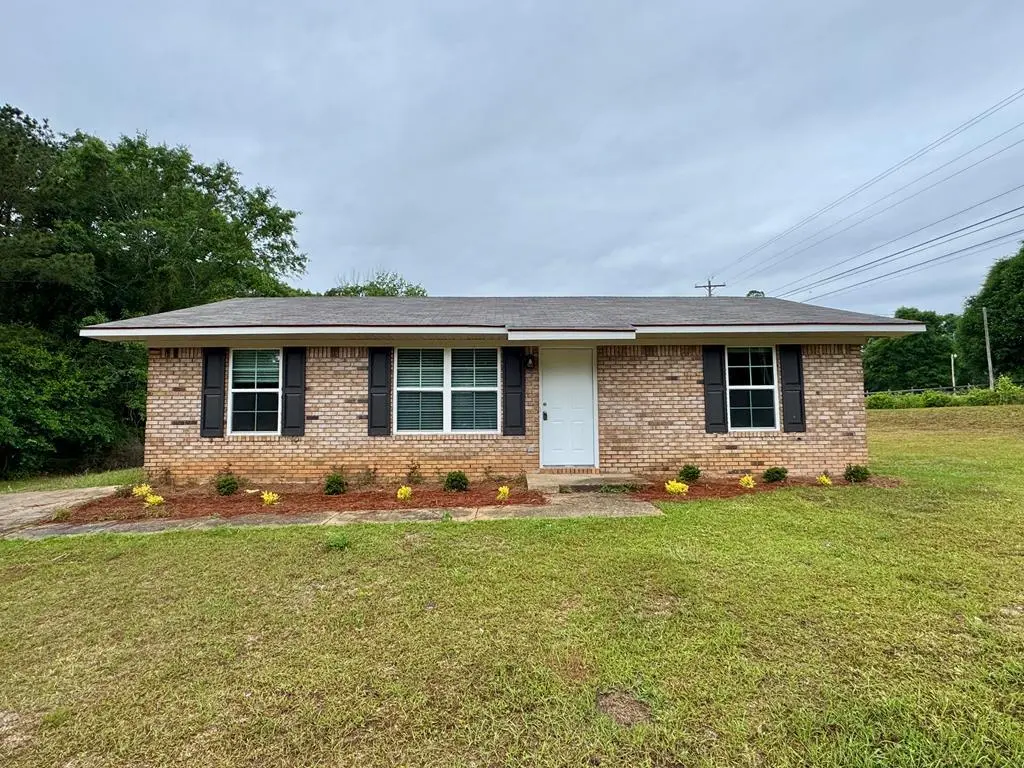
118 Emerald Ct · Ozark, AL
Flood risk 1/10 · Minimal
- FEMA flood zone
- X (unshaded)
- Chance of flooding over 30 yrs
- 0.0%
- Est. flood insurance / yr
- $507 – $1,088
Fire risk 4/10 · Minor
- Est. fire insurance / yr
- $916 – $1,700
Heat risk 8/10 · Major
- Hot days now (above 106°F)
- 7 days/yr
- Hot days in 30 yrs
- 19 days/yr
Wind risk 8/10 · Major
- Chance of severe wind over 30 yrs
- 99.0%
Air-quality risk 2/10 · Minimal
- Unhealthy air days now
- 1 days/yr
- Unhealthy air days in 30 yrs
- 1 days/yr
Risk factors via First Street. Map © Google.
Why this score? — see what drove the D grade
The composite is a weighted blend of 9 inputs, each scored 0–100. Each bar is that input's sub-score; the figure is the points it added to the 100-point composite (weight × sub-score).
- Cash flow +14.1/30.0
- ARV discount +9.8/15.0
- DSCR +4.3/10.0
- 1% rule +3.2/10.0
- Livability +3.1/5.0
- Rent growth +2.5/5.0
- Condition / age +2.5/5.0
- Schools +2.0/10.0
- Appreciation +0.0/10.0
$129,900
🖨 Deal sheet (PDF) 📄 Offer letter ✓ Due diligence
Listing remarks
Fully remodeled and move-in ready! This 3 bedroom, 1.5 bathroom home in Ozark features updated finishes throughout, new windows, new flooring throughout, stainless steel appliances, new countertops, new sinks, toilets, faucets, tub refinished, new electrical outlets/ switches, light fixtures, new blinds, upgraded kitchen layout with stainless steel dishwasher, updated landscaping, new vinyl siding, and a new roof installed in 2024. With a functional layout and modern touches, this home is perfect for comfortable everyday living. Don't miss out on this turnkey property!
Key facts
- Remodeled
- Updated finishes
- New flooring
Tags
Property features AI
Exterior
- Parking: No garage
- Utilities: Public water; Public sewer
- Home design: Single-family residence; One story
- Construction: Brick and vinyl siding exterior
- Exterior features: On waterfront; Lot is approximately 0.47 acres
Interior
- Kitchen: Dishwasher; Microwave; Oven; Refrigerator
- Flooring: Vinyl
- Bathrooms: 1 full bathroom; 1 half bathroom
- Interior features: Ceiling fans; Walk-in closet(s); Eat-in kitchen; Double pane windows; Window treatments
- Laundry & utility: Indoor laundry
Neighborhood map
What this means for you Summary
Snapshot
- This is a 3-bed/1.5-bath single-family listed at $130k.
Deal economics
- At list price, monthly cash flow is $20 ($239/yr) — positive.
- The deal already cash-flows at list — no discount required.
- To meet the 1% rule (rent ≥ 1% of price), the offer needs to be $106k (18.4% below list).
- Recommended offer: $106k (18.4% below list) — sets the bar for 1% rule.
- Cap rate 6.5% vs local median 4.3% in Ozark — top-decile yield for the area; either an underpriced asset or a hidden risk that comps aren't pricing in. Stress-test before assuming the spread holds.
Location & tenants
- Location reads 62/100 on livability (#224 in AL) — a middle-class / working-renter tenant base. Strengths: cost of living A+, housing A+, health & safety A+; Watch: crime F, amenities F, commute F.
- Ozark City (town): math 11% / reading 36% proficiency, ranked #99 of 129 in AL (top 77%) — low school quality limits family demand, transient renter base, plan for 1-2y turnover.
- Zoned schools: Joseph W Lisenby Primary School (518 students, 68% FRL); D A Smith Middle School (math 7% / reading 35%, grade F, #188 of 257 statewide, top 74%, 485 students, 65% FRL); Carroll High School (math 22% / reading 27%, grade F, #118 of 305 statewide, top 45%, 638 students, 58% FRL) — zoned schools at 64% FRL track the district average.
- Market conditions: 186 active listings in the ZIP; 38 units permitted in Dale County in 2024 (0 in 5+ unit buildings).
Forward outlook
- Local home prices are declining (-3.0%/yr); year-one equity from $898 of loan paydown is wiped out by about $4k of value loss. Plan a longer hold.
- Dale County population projected at -20% by 2050 — secular population decline; favor cash flow + early exit over multi-decade hold.
Negotiation context
- It's been on market 23 days — a 2% lower offer ($128k) is reasonable based on typical stale-listing flexibility.
Risks & watch-outs
- Climate carrying-cost: severe wind risk, 99% chance of damaging wind over 30y; extreme-heat days projected 7→19/yr by 2055 (HVAC capex compounding) — expect insurance premiums to compound above CPI over the hold.
Questions for the listing agent
- Is there a deadline driving the sale (1031 exchange, divorce, estate, relocation)? That informs how much negotiation room exists.
- Schools are F-rated, which usually means shorter tenancies and higher turnover. Who's the typical renter profile here, and what's been the actual vacancy rate?
- Crime grade is F in this area — have there been break-ins, vandalism, or insurance claims at this property in the last 3 years? What carrier currently insures it and at what premium?
- The area grade is low — what's the realistic commute time and amenity access for the typical tenant pool here? Any planned neighborhood developments (good or bad) we should know about?
- What's the average days-on-market for RENTAL listings here right now (not sales)? A rising rental-DOM trend means longer vacancies and softer asking-rent achievability than the comps imply.
- What's the recent tenant-quality profile in this submarket — average credit score on applications, eviction rate, late-payment / NSF rate, and stable-employment percentage? A property-management company in the area should have these aggregated.
- How much new for-sale + rental construction is in the pipeline within 1–3 miles? Heavy new supply typically softens prices + rents 12–24 months out; constrained supply supports both.
Investment metrics
- 1% rule
- 0.82% ✗
- Cap rate
- 6.48%
- Cash-on-cash
- 0.66%
- DSCR
- 1.03
- GRM
- 10.2
CMA / ARV
- ARV (median comp)
- $136,905
- List price
- $129,900
- Delta
- -5.12%
- Verdict
- FAIR
- Comps
- 20 within 1.0 mi
Show comp detail 6 sales within ~0.75 mi
| Address | Dist | Beds/Ba | Sqft | Sold | Price | $/sf | Match |
|---|---|---|---|---|---|---|---|
| 2310 Will Logan Rd | 0.02mi | 3/1.5 | 1,080 (0%) | 1mo | $55,000 | $51 | 98 |
| 230 Johanna Dr | 0.22mi | 3/1.5 | 1,080 (0%) | 11mo | $74,900 | $69 | 81 |
| 195 Johanna Dr | 0.19mi | 3/1.5 | 1,075 (-0%) | 12mo | $54,997 | $51 | 80 |
| 322 Johanna Dr | 0.25mi | 3/1.5 | 1,080 (0%) | 20mo | $115,000 | $106 | 71 |
| 499 Sharon Ln | 0.70mi | 3/1.5 | 1,080 (0%) | 13mo | $82,000 | $76 | 57 |
| 1750 Will Logan Rd | 0.58mi | 3/2.0 | 1,170 (+8%) | 21mo | $130,100 | $111 | 40 |
Match score weights: distance 35% · size 25% · config 20% · recency 20%. Top-matched comps best support the ARV.
Projected returns pro-forma
-3.0% appreciation · 3.0% rent growth · sell at horizon
- IRR
- -15.3%
- Equity multiple
- 0.46×
- Total profit
- $-19,812
- Equity at exit
- $19,369
- IRR
- -6.8%
- Equity multiple
- 0.57×
- Total profit
- $-15,752
- Equity at exit
- $11,231
Cash invested: $36,372 (down + closing). Projections, not guarantees.
Landlord ↔ Tenant lean methodology
- Overall (STATE)
- 90 Strongly Landlord-Friendly
- State Alabama
- 90 Strongly Landlord-Friendly · R+15
- County
- — inherits STATE
- City
- — inherits STATE
ZIP-level market 36360
- Home prices YoY
- -6.9%
- Active inventory
- 186
- Price-to-rent
- 10.2×
Monthly cashflow live
- Estimated rent
- $1,060 medium interval (Pro) →
- Mortgage (P&I)
- −$681
- Tax from tax record
- −$82 /mo · $983/yr
- Insurance
- −$54
- HOA
- −$0
- Vacancy / Maint / Mgmt
- −$223
- Net cashflow
- $20
Break-even live
Sensitivity live
| Price | -10% $93 | -5% $57 | +0% $20 | +5% $-17 | +10% $-54 |
|---|---|---|---|---|---|
| Rent | -10% $-64 | -5% $-22 | +0% $20 | +5% $62 | +10% $104 |
| Rate | -1.0pp $85 | -0.5pp $53 | base $20 | +0.5pp $-14 | +1.0pp $-48 |
UW: 25.0% down · 7.5% · 30yr · 1.5% tax · 5.0% vac · 8.0% maint · 8.0% mgmt
Financing live
Cash to close
- Down payment
- $32,475
- Closing costs
- $3,897
- Reserves months
- —
- Total cash needed
- —
Loan-product check · same deal, 3 products live
Conventional
25% down · 7.5% · 30yr
- Down + closing
- —
- Monthly P&I
- —
- Monthly cashflow
- —
- DSCR
- —
- Eligible?
- —
Personal DTI + credit; lowest rate.
DSCR
20% down · 8.5% · 30yr
- Down + closing
- —
- Monthly P&I
- —
- Monthly cashflow
- —
- DSCR
- —
- Eligible?
- —
No personal income docs; deal must DSCR.
Hard money
10% down · 12.0% · 12mo
- Down + closing
- —
- Monthly P&I
- —
- Monthly cashflow
- —
- DSCR
- —
- Eligible?
- —
Short-term bridge; refi at stabilization.
Listing history 2 events
-
2026-05-10price $129,900 575-char remark
-
2026-05-01$135,000 Active 575-char remark
ⓘ Source: listings_history table (triggers on properties + properties_extension) + one-shot
backfill from property_details.listing_events for pre-trigger history.
Tax reassessment forecast AL · Resets to sale price
- Current annual tax
- $983 · $82/mo
- Projected year-2 tax
- $983 · $82/mo
- Expected delta
- $0/yr ($0/mo · 0.0%)
ⓘ Screening estimate from a state-policy table — verify with the county assessor before closing.
Climate risk First Street
- Flood 1/10 Low FEMA zone X (unshaded) · 0% chance over 30 yrs
- Wildfire 4/10 Moderate
- Heat 8/10 Severe 7 d/yr ≥106°F today · 19 d/yr by 30 yrs out
- Wind 8/10 Severe 99% chance of damaging wind over 30 yrs
- Air quality 2/10 Low 1 unhealthy d/yr today · 1 by 30 yrs out
Nearby sold comps map
Loading sold comps map…
Walkable amenities ~0.75 mi
Loading nearby amenities…
Taxation est. · year 1
- Rental income
- $12,717
- − Mortgage interest
- −$7,276
- − Property taxes
- −$983
- − Insurance
- −$650
- − Repairs & maintenance
- −$1,017
- − Management
- −$1,017
- − Depreciation
- −$3,779
- Taxable loss
- −$2,006
- Est. tax savings @ 24.0%
- +$481
- After-tax cash flow
- $721/yr
For passive investors: Depreciation is non-cash, so a rental often shows a tax loss while cash-flowing — sheltering income. Rental losses are passive: they offset passive income freely, and up to $25,000/yr can offset ordinary (W-2) income if you actively participate and your MAGI is under $100k (phasing out to $0 by $150k); unused losses carry forward. On sale, claimed depreciation is recaptured at up to 25%, and gains may owe capital-gains tax (a 1031 exchange can defer both). Figures are a year-1 estimate at your 24.0% rate — not tax advice; consult a CPA.
Schools (NCES district)
- District
- Ozark City
- NCES district ID
- 0102640
- Math proficiency
- 11% ▼ -24.00%
- Reading proficiency
- 36% ▲ 1.00%
- Median HH income
- $39,155
- Composite
- 19.67/100
- National rank
- #8733
- State rank
- #99 of 129 in AL
Livability — Ozark
- Score
- 62/100
- State rank
- #224
- US rank
- #16855
Category grades
Schools grade is shown separately in the Schools card above.
Census & demographics
- Census place
- Ozark, AL
- City population
- 19,461
- Population (ZIP)
- 19,461
Population outlook (Dale County) Hauer SSP2
- Today (2025)
- 46,805 people
- By 2030
- 45,176 · -3.5%
- By 2040
- 41,523 · -11.3%
- By 2050
- 37,575 · -19.7%
- By 2075
- 28,931 · -38.2%
- By 2100
- 22,172 · -52.6%
Race, ethnicity, and origin ACS 2023
- Neighborhood character
- Majority White (65%)
- Race & ethnicity
- White 65% Black 27% Hispanic / Latino 4% Two or more races 3% Asian 1%
- Common ancestry
- Serbian 2% Lithuanian 1% Slovak 1%
- Foreign-born
- 4% · Canada
- Languages at home
- 94% English-only · Spanish 3% German/W. Germanic 1% Other Asian/Pacific 1%
Political lean MEDSL · Dale
- 2024 margin
- Solid R (+52.3) · D 23.5% · R 75.8%
- 2008→2024 swing
- -7.7pp toward R · 2008: -44.6pp · 2024: -52.3pp
- All cycles
- 2024: R+52.3 2020: R+46.3 2016: R+50.4 2012: R+42.2 2008: R+44.6
Not yet ingested
- Civics
- —
Market trends
- HPI YoY
- ▼ -14.80%
- Current HPI
- 198.6765
- Rent YoY
- —
- Metro
- —
- State GDP YoY
- ▲ 2.94%
- F500 in state
- 4
Industry mix (Fortune 500 HQ in AL)
| Industry | F500 HQs | Revenue |
|---|---|---|
| Financial Services | 1 | $8B |
|
||
| Healthcare | 1 | $5B |
|
||
Price history
-3.8% since first listed3 events — show timeline
- 2026-05-24 Pending — SAMLS
- 2026-05-10 Price Changed $129,900 SAMLS
- 2026-05-01 Listed $135,000 SAMLS
Property tax history
+4.5%/yrLatest (2025): $983 · +6.9% YoY. Source: county tax records.
Cash-flow waterfall
monthlySold comps — $/sqft
last 12 mo · ≤1 miLoading sold comps…