441 Barber St SE · Palm Bay, FL
Flood risk 1/10 · Minimal
- FEMA flood zone
- X (unshaded)
- Chance of flooding over 30 yrs
- 0.0%
- Est. flood insurance / yr
- $507 – $1,088
Fire risk 1/10 · Minimal
- Est. fire insurance / yr
- $947 – $1,759
Heat risk 9/10 · Severe
- Hot days now (above 106°F)
- 7 days/yr
- Hot days in 30 yrs
- 22 days/yr
Wind risk 10/10 · Severe
- Chance of severe wind over 30 yrs
- 99.0%
Air-quality risk 1/10 · Minimal
- Unhealthy air days now
- 0 days/yr
- Unhealthy air days in 30 yrs
- 0 days/yr
Risk factors via First Street. Map © Google.
Why this score? — see what drove the D- grade
The composite is a weighted blend of 9 inputs, each scored 0–100. Each bar is that input's sub-score; the figure is the points it added to the 100-point composite (weight × sub-score).
- Appreciation +10.0/10.0
- ARV discount +7.5/15.0
- Cash flow +5.8/30.0
- Schools +4.7/10.0
- Livability +3.6/5.0
- Rent growth +3.4/5.0
- Condition / age +2.5/5.0
- 1% rule +1.2/10.0
- DSCR +0.2/10.0
$339,990
🖨 Deal sheet 📄 Offer letter ✓ Due diligence
Listing remarks
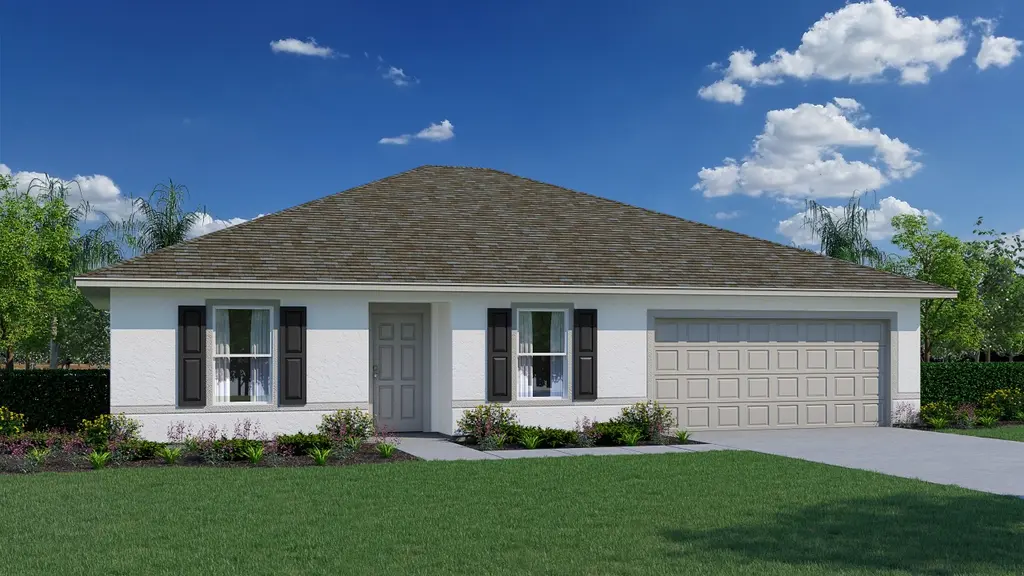
Introducing the Foxtail, a delightful floorplan from our Value collection designed with families in mind. This home offers a well-thought-out layout featuring 3 bedrooms, 2 full bathrooms, and a spacious 2-car garage. The split plan of the Foxtail ensures a welcoming master suite with ample privacy from the other two bedrooms. The Owner's Suite boasts a full bath and a walk-in closet, providing a comfortable and relaxing retreat. For added convenience, the laundry room is just steps away and offers direct access to the 2-car garage. The open concept kitchen and great room create an inviting and versatile space, ideal for memorable family gatherings. Additionally, you'll find a second living
Key facts
- Second living room
- Open concept kitchen
- Split plan
Tags
Property features AI
Finance
- Other: Listing status: Active; Last modified: 2026-05-21T16:02:41.623Z
- Financial info: List price $339,990
Exterior
- Parking: 2 total parking spaces; 2-car garage
- Home design: Spec inventory home, Plan name Foxtail
- Exterior features: Address: 441 Barber St SE, Palm Bay, FL 32909
Interior
- Bedrooms: 3 bedrooms
- Bathrooms: 2 full bathrooms
- Interior features: Living area of 1552
Neighborhood map
What this means for you Summary
Snapshot
- This is a 3-bed/2.0-bath single-family listed at $340k.
Deal economics
- At list price, monthly cash flow is $-674 ($-8k/yr) — negative.
- To cash-flow at today's rent, offer at most $242k (28.7% below list).
- To meet the 1% rule (rent ≥ 1% of price), the offer needs to be $212k (37.6% below list).
- Recommended offer: $212k (37.6% below list) — sets the bar for 1% rule.
Location & tenants
- Location reads 72/100 on livability (#366 in FL) — a middle-class / working-renter tenant base. Strengths: cost of living A+, housing A+; Watch: schools C-, employment D+, amenities F.
- Brevard (suburban): math 53% / reading 57% proficiency, ranked #19 of 73 in FL (top 26%) — acceptable for families but not a draw, mixed tenant base, ~2y average lease.
- Market conditions: Rents rising (+3.7%/yr); 1111 active listings in the ZIP; 28 comparable units currently listed for rent nearby; rentals at typical pace (median 24d on market — plan ~3-4 weeks tenant-placement turnaround); solid renter incomes; 4,602 units permitted in Brevard County in 2024 (702 in 5+ unit buildings).
- This rent runs 32% of the median local income ($80k/yr) — at the standard rent-burdened threshold; future hikes will face affordability resistance.
Forward outlook
- In year one you build about $36k of equity ($2k loan paydown + $34k appreciation (10.0% local appreciation)).
- Brevard County population projected at +15% by 2050 — modest demand growth; plan on rents tracking national, not racing it.
- By year 2, paydown + projected appreciation supports a ~$58k cash-out refi (75% LTV) — recoverable capital for the next deal without selling this one.
Negotiation context
- It's been on market 90 days — a 6% lower offer ($320k) is reasonable based on typical stale-listing flexibility.
Risks & watch-outs
- Climate carrying-cost: severe wind risk, 99% chance of damaging wind over 30y; extreme-heat days projected 7→22/yr by 2055 (HVAC capex compounding) — expect insurance premiums to compound above CPI over the hold.
Questions for the listing agent
- What do current leases actually rent for vs. the listed asking? Can we see a recent rent roll and the last 12 months of T-12 income?
- It's been on market 90 days. Have you received any prior offers? Is the seller open to a 38% concession, seller financing, or rate buy-down credit?
- Why hasn't it sold? Are there any deal-killer items the seller is aware of (foundation, flood, title, zoning, code violations)?
- Is there a deadline driving the sale (1031 exchange, divorce, estate, relocation)? That informs how much negotiation room exists.
- The area grade is low — what's the realistic commute time and amenity access for the typical tenant pool here? Any planned neighborhood developments (good or bad) we should know about?
- What's the average days-on-market for RENTAL listings here right now (not sales)? A rising rental-DOM trend means longer vacancies and softer asking-rent achievability than the comps imply.
- What's the recent tenant-quality profile in this submarket — average credit score on applications, eviction rate, late-payment / NSF rate, and stable-employment percentage? A property-management company in the area should have these aggregated.
- How much new for-sale + rental construction is in the pipeline within 1–3 miles? Heavy new supply typically softens prices + rents 12–24 months out; constrained supply supports both.
Investment metrics
- 1% rule
- 0.62% ✗
- Cap rate
- 3.91%
- Cash-on-cash
- -8.50%
- DSCR
- 0.62
- GRM
- 13.4
CMA / ARV
No comps found within radius.
Projected returns pro-forma
10.0% appreciation · 3.67% rent growth · sell at horizon
- IRR
- 18.5%
- Equity multiple
- 2.51×
- Total profit
- $143,690
- Equity at exit
- $306,290
- IRR
- 17.3%
- Equity multiple
- 5.83×
- Total profit
- $459,983
- Equity at exit
- $660,526
Cash invested: $95,197 (down + closing). Projections, not guarantees.
Landlord ↔ Tenant lean methodology
- Overall (STATE)
- 87 Strongly Landlord-Friendly
- State Florida
- 87 Strongly Landlord-Friendly · R+3
- County
- — inherits STATE
- City
- — inherits STATE
ZIP-level market 32909
- Home prices YoY
- 6.0%
- Rents YoY
- 3.7%
- Active inventory
- 1111
- Price-to-rent
- 13.4×
Monthly cashflow live
- Estimated rent
- $2,121 high interval (Pro) →
- Mortgage (P&I)
- −$1,783
- Tax est. 1.5%
- −$425 /mo · $5,100/yr
- Insurance
- −$142
- HOA
- −$0
- Vacancy / Maint / Mgmt
- −$445
- Net cashflow
- $-674
Break-even live
UW: 25.0% down · 7.5% · 30yr · 1.5% tax · 5.0% vac · 8.0% maint · 8.0% mgmt
Financing live
Cash to close
- Down payment
- $84,998
- Closing costs
- $10,200
- Reserves months
- —
- Total cash needed
- —
Loan-product check · same deal, 3 products live
Conventional
25% down · 7.5% · 30yr
- Down + closing
- —
- Monthly P&I
- —
- Monthly cashflow
- —
- DSCR
- —
- Eligible?
- —
Personal DTI + credit; lowest rate.
DSCR
20% down · 8.5% · 30yr
- Down + closing
- —
- Monthly P&I
- —
- Monthly cashflow
- —
- DSCR
- —
- Eligible?
- —
No personal income docs; deal must DSCR.
Hard money
10% down · 12.0% · 12mo
- Down + closing
- —
- Monthly P&I
- —
- Monthly cashflow
- —
- DSCR
- —
- Eligible?
- —
Short-term bridge; refi at stabilization.
Rent comps 28 comps
| Address | Beds | Baths | Sqft | Rent | $/sqft | DOM | Units | Dist |
|---|---|---|---|---|---|---|---|---|
| 272 Aquarius Ave SE Palm Bay, FL | 4.0 | 2.0 | 1650 | $1,995 | $1.21 | 23d | 1 | 0.09mi |
| 320 Algiers Ave SE Palm Bay, FL | 3.0 | 2.0 | 1306 | $1,825 | $1.40 | 23d | 1 | 0.19mi |
| 490 Hatcher St SE Palm Bay, FL | 4.0 | 2.0 | 1833 | $2,150 | $1.17 | 21d | 1 | 0.23mi |
| 214 Eldron Blvd NE Palm Bay, FL | 3.0 | 2.0 | 1646 | $2,075 | $1.26 | 23d | 1 | 0.49mi |
| 154 Anderson Ave NE Unit 154 Palm Bay, FL | 3.0 | 2.0 | 1414 | $1,800 | $1.27 | 14d | 1 | 0.50mi |
| 741 Frisco St SE Palm Bay, FL | 3.0 | 2.0 | 1156 | $1,950 | $1.69 | 23d | 1 | 0.53mi |
| 741 Fairhaven St NE Palm Bay, FL | 2.0 | 2.0 | 1336 | $1,900 | $1.42 | 23d | 1 | 0.66mi |
| 309 Cactus St SE Palm Bay, FL | 4.0 | 2.0 | 1846 | $2,195 | $1.19 | 14d | 1 | 0.67mi |
| 296 Croquet Ave NE Palm Bay, FL | 4.0 | 2.0 | 2028 | $2,300 | $1.13 | 21d | 1 | 0.75mi |
| 171 Okeefe St SE Palm Bay, FL | 3.0 | 2.0 | 1288 | $1,855 | $1.44 | 14d | 1 | 0.78mi |
| 481 Firestone St NE Palm Bay, FL | 4.0 | 2.0 | 1504 | $2,100 | $1.40 | 23d | 1 | 0.83mi |
| 334 Bordeaux Ave NE Palm Bay, FL | 4.0 | 2.0 | 2083 | $2,250 | $1.08 | 14d | 1 | 0.83mi |
| 463 Eldron Blvd NE Palm Bay, FL | 4.0 | 2.0 | 1870 | $2,800 | $1.50 | 23d | 1 | 0.96mi |
| 743 Andrew St SE Palm Bay, FL | 3.0 | 2.0 | 1252 | $1,895 | $1.51 | 23d | 1 | 0.98mi |
| 205 Valor Dr SE Palm Bay, FL | 1.0–2.0 | 1.0–2.0 | 901 | $1,937 | $2.15 | 14d | 17 | 1.08mi |
| 549 Burlington Ave NE Palm Bay, FL | 3.0 | 2.0 | 1608 | $2,075 | $1.29 | 14d | 1 | 1.10mi |
| 907 Algardi St SE Palm Bay, FL | 4.0 | 2.0 | 1943 | $2,330 | $1.20 | 23d | 1 | 1.11mi |
| 210 Meehan Ave NW Palm Bay, FL | 3.0 | 2.0 | 2020 | $1,895 | $0.94 | 14d | 1 | 1.12mi |
| 347 Americana Blvd NE Palm Bay, FL | 3.0 | 2.0 | 1372 | $1,900 | $1.38 | 14d | 1 | 1.13mi |
| 857 Buchanan Ave SE Palm Bay, FL | 3.0 | 2.0 | 1257 | $1,950 | $1.55 | 23d | 1 | 1.16mi |
| 431 Brantley St SE Palm Bay, FL | 3.0 | 2.0 | 1326 | $2,050 | $1.55 | 19d | 1 | 1.18mi |
| 154 Daffodil Dr SW Palm Bay, FL | 3.0–4.0 | 2.0–3.0 | 1384 | $1,649 | $1.19 | 14d | 6 | 1.24mi |
| 726 Scotten Ave SW Palm Bay, FL | 3.0 | 2.0 | 1443 | $1,970 | $1.37 | 14d | 1 | 1.31mi |
| 124 Evergreen St NE Palm Bay, FL | 3.0 | 2.0 | 1283 | $1,855 | $1.45 | 23d | 1 | 1.31mi |
| 931 Commerce Rd SE Palm Bay, FL | 3.0 | 2.0 | 1068 | $2,300 | $2.15 | 23d | 1 | 1.33mi |
| 914 Caligula Ave SE Palm Bay, FL | 3.0 | 2.0 | 1371 | $1,841 | $1.34 | 14d | 1 | 1.35mi |
| 487 Wiltshire Ave SW Palm Bay, FL | 3.0 | 2.0 | 1462 | $2,300 | $1.57 | 23d | 1 | 1.44mi |
| 511 Trumpet St SW Palm Bay, FL | 3.0 | 2.0 | 1243 | $2,200 | $1.77 | 23d | 1 | 1.47mi |
Listing history 13 events
-
2026-06-18days on market $339,990 Active 90 DOM
-
2026-06-17days on market $339,990 Active 89 DOM
-
2026-06-16days on market $339,990 Active 88 DOM
-
2026-06-15days on market $339,990 Active 87 DOM
-
2026-06-14days on market $339,990 Active 85 DOM
-
2026-06-10days on market $339,990 Active 82 DOM
-
2026-06-08days on market $339,990 Active 80 DOM
-
2026-06-07days on market $339,990 Active 79 DOM
-
2026-06-05days on market $339,990 Active 76 DOM
-
2026-06-03days on market $339,990 Active 75 DOM
-
2026-06-02days on market $339,990 Active 74 DOM
-
2026-06-01days on market $339,990 Active 73 DOM
-
2026-05-31days on market $339,990 Active 72 DOM
ⓘ Source: listings_history table (triggers on properties + properties_extension) + one-shot
backfill from property_details.listing_events for pre-trigger history.
Climate risk First Street
- Flood 1/10 Low FEMA zone X (unshaded) · 0% chance over 30 yrs
- Wildfire 1/10 Low
- Heat 9/10 Extreme 7 d/yr ≥106°F today · 22 d/yr by 30 yrs out
- Wind 10/10 Extreme 99% chance of damaging wind over 30 yrs
- Air quality 1/10 Low 0 unhealthy d/yr today · 0 by 30 yrs out
Nearby sold comps map
Loading sold comps map…
Walkable amenities ~0.75 mi
Loading nearby amenities…
Taxation est. · year 1
- Rental income
- $25,447
- − Mortgage interest
- −$19,045
- − Property taxes
- −$5,100
- − Insurance
- −$1,700
- − Repairs & maintenance
- −$2,036
- − Management
- −$2,036
- − Depreciation
- −$9,891
- Taxable loss
- −$14,360
- Est. tax savings @ 24.0%
- +$3,446
- After-tax cash flow
- $-4,646/yr
For passive investors: Depreciation is non-cash, so a rental often shows a tax loss while cash-flowing — sheltering income. Rental losses are passive: they offset passive income freely, and up to $25,000/yr can offset ordinary (W-2) income if you actively participate and your MAGI is under $100k (phasing out to $0 by $150k); unused losses carry forward. On sale, claimed depreciation is recaptured at up to 25%, and gains may owe capital-gains tax (a 1031 exchange can defer both). Figures are a year-1 estimate at your 24.0% rate — not tax advice; consult a CPA.
Schools (NCES district)
- District
- Brevard
- NCES district ID
- 1200150
- Math proficiency
- 53% ▼ -9.00%
- Reading proficiency
- 57% ▼ -4.00%
- Median HH income
- $49,426
- Composite
- 46.86/100
- National rank
- #2370
- State rank
- #19 of 73 in FL
Livability — Palm Bay
- Score
- 72/100
- State rank
- #366
- US rank
- #6458
Category grades
Schools grade is shown separately in the Schools card above.
Census & demographics
- Census place
- Palm Bay, FL
- County
- Brevard County · 602,871 people
- City population
- 132,211
- Metro
- Palm Bay-Melbourne-Titusville, FL
- Population (ZIP)
- 41,804
- Household income
- $79,977
- Rent vs Own
- Severe rent burden
- 697.0
Population outlook (Brevard County) Hauer SSP2
- Today (2025)
- 623,254 people
- By 2030
- 648,420 · +4.0%
- By 2040
- 690,009 · +10.7%
- By 2050
- 715,669 · +14.8%
- By 2075
- 775,744 · +24.5%
- By 2100
- 776,687 · +24.6%
Race, ethnicity, and origin ACS 2023
- Neighborhood character
- Diverse neighborhood (Simpson 0.70)
- Race & ethnicity
- White 46% Black 21% Hispanic / Latino 20% Two or more races 16% Asian 4%
- Hispanic origin (detail)
- Mexican 2% Puerto Rican 8% Cuban 5%
- Common ancestry
- Hispanic 3% Slovak 2% Lithuanian 2%
- Foreign-born
- 17% · Canada, China, Jamaica
- Languages at home
- 84% English-only · Spanish 9% French/Haitian/Cajun 4% Chinese 1%
Political lean MEDSL · Brevard
- 2024 margin
- Strong R (+20.8) · D 39.1% · R 59.9% · Other 1.0%
- 2008→2024 swing
- -10.4pp toward R · 2008: -10.4pp · 2024: -20.8pp
- All cycles
- 2024: R+20.8 2020: R+16.4 2016: R+19.8 2012: R+12.7 2008: R+10.4
Not yet ingested
- Civics
- —
Market trends
- HPI YoY
- ▲ 18.81%
- Current HPI
- 330.8595
- Rent YoY
- ▲ 3.67%
- Metro
- Palm Bay-Melbourne-Titusville, FL
- State GDP YoY
- ▲ 3.28%
- F500 in state
- 36
Industry mix (Fortune 500 HQ in FL)
| Industry | F500 HQs | Revenue |
|---|---|---|
| Industrial Technology | 2 | $29B |
|
||
| Insurance | 2 | $17B |
|
||
| Retail | 1 | $60B |
|
||
| Technology Distribution | 1 | $58B |
|
||
| Homebuilding | 1 | $35B |
|
||
| Technology Manufacturing | 1 | $35B |
|
||
Cash-flow waterfall
monthlySold comps — $/sqft
last 12 mo · ≤1 miLoading sold comps…