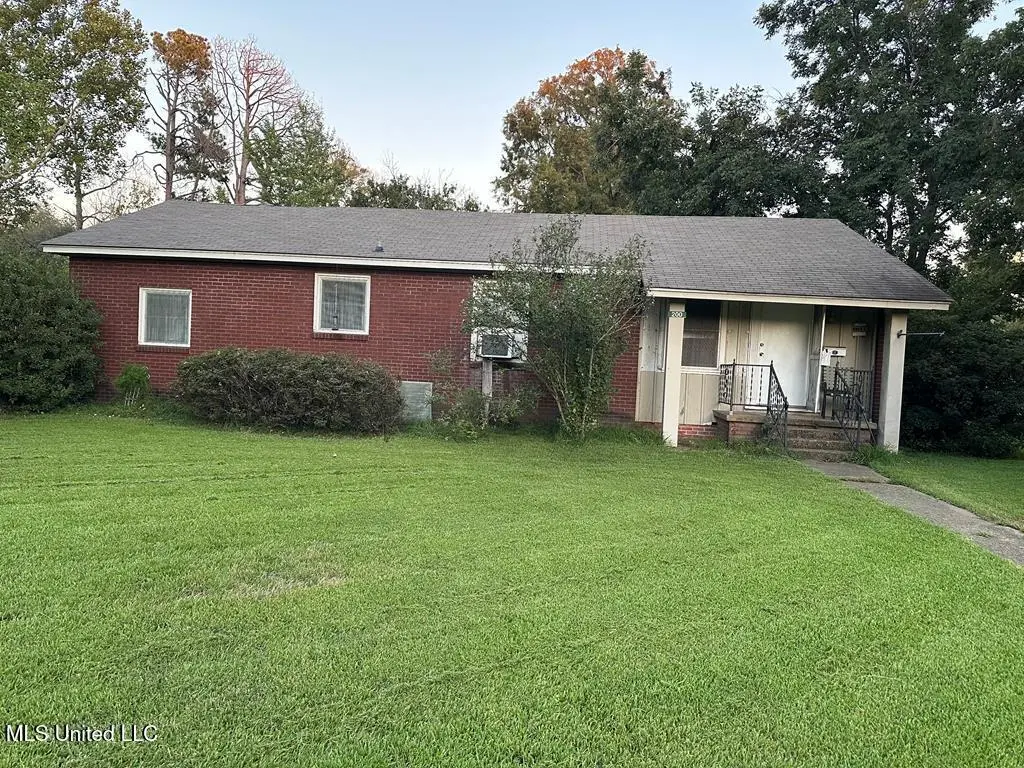
200 Cedar St · Vidalia, LA
Flood risk 1/10 · Minimal
- FEMA flood zone
- X (shaded)
- Chance of flooding over 30 yrs
- 0.0%
- Est. flood insurance / yr
- $507 – $1,088
Fire risk 1/10 · Minimal
- Est. fire insurance / yr
- $1,269 – $2,357
Heat risk 8/10 · Major
- Hot days now (above 109°F)
- 7 days/yr
- Hot days in 30 yrs
- 20 days/yr
Wind risk 8/10 · Major
- Chance of severe wind over 30 yrs
- 92.0%
Air-quality risk 1/10 · Minimal
- Unhealthy air days now
- 0 days/yr
- Unhealthy air days in 30 yrs
- 0 days/yr
Risk factors via First Street. Map © Google.
Why this score? — see what drove the B+ grade
The composite is a weighted blend of 9 inputs, each scored 0–100. Each bar is that input's sub-score; the figure is the points it added to the 100-point composite (weight × sub-score).
- Cash flow +28.0/30.0
- ARV discount +15.0/15.0
- DSCR +9.9/10.0
- Appreciation +8.5/10.0
- 1% rule +7.2/10.0
- Livability +3.3/5.0
- Rent growth +2.5/5.0
- Condition / age +2.5/5.0
- Schools +1.8/10.0
$99,000
🖨 Deal sheet (PDF) 📄 Offer letter ✓ Due diligence
Listing remarks MLS
Located on a corner lot in Vidalia. Three bedrooms and three baths.
Key facts
- 0.4 acre lot
- Built 1962
- Listed 571 days
Neighborhood map
What this means for you Summary
Snapshot
- This is a 3-bed/3.0-bath single-family listed at $99k.
Deal economics
- At list price, monthly cash flow is $309 ($4k/yr) — positive.
- The deal already cash-flows at list — no discount required.
- Meets the 1% rule at list price ($1k rent vs $99k).
- Recommended offer: $87k (12.0% below list) — sets the bar for market timing.
Location & tenants
- Location reads 66/100 on livability (#123 in LA) — a middle-class / working-renter tenant base. Strengths: cost of living A+, housing A+; Watch: health & safety C-, crime D-, amenities F.
- Concordia Parish (town): math 19% / reading 27% proficiency, ranked #65 of 98 in LA (top 66%) — low school quality limits family demand, transient renter base, plan for 1-2y turnover; 74% free/reduced lunch — lower-income household profile, screen leases tightly.
- Market conditions: 40 active listings in the ZIP; 27 units permitted in Concordia Parish in 2024 (0 in 5+ unit buildings).
Forward outlook
- In year one you build about $8k of equity ($684 loan paydown + $7k appreciation (7.0% local appreciation)).
- Concordia County population projected at -20% by 2050 — secular population decline; favor cash flow + early exit over multi-decade hold.
- At projected returns (7.0% appreciation + 3.0% rent growth), your $28k cash investment doubles in ~3 years — after that, you're playing with house money.
- By year 5, paydown + projected appreciation supports a ~$34k cash-out refi (75% LTV) — recoverable capital for the next deal without selling this one.
Negotiation context
- It's been on market 571 days — a 12% lower offer ($87k) is reasonable based on typical stale-listing flexibility.
- 7 sale attempts since 10y ago; this cycle's ask has dropped $11k (10%) from the opening price — seller is motivated, your offer sets the floor, not the list.
Risks & watch-outs
- Climate carrying-cost: severe wind risk, 92% chance of damaging wind over 30y; extreme-heat days projected 7→20/yr by 2055 (HVAC capex compounding) — expect insurance premiums to compound above CPI over the hold.
Questions for the listing agent
- It's been on market 571 days. Have you received any prior offers? Is the seller open to a 12% concession, seller financing, or rate buy-down credit?
- Built in 1962 — when were the roof, HVAC, electrical panel, plumbing, and water heater last replaced?
- Why hasn't it sold? Are there any deal-killer items the seller is aware of (foundation, flood, title, zoning, code violations)?
- Is there a deadline driving the sale (1031 exchange, divorce, estate, relocation)? That informs how much negotiation room exists.
- Crime grade is D in this area — have there been break-ins, vandalism, or insurance claims at this property in the last 3 years? What carrier currently insures it and at what premium?
- What's the average days-on-market for RENTAL listings here right now (not sales)? A rising rental-DOM trend means longer vacancies and softer asking-rent achievability than the comps imply.
- What's the recent tenant-quality profile in this submarket — average credit score on applications, eviction rate, late-payment / NSF rate, and stable-employment percentage? A property-management company in the area should have these aggregated.
- How much new for-sale + rental construction is in the pipeline within 1–3 miles? Heavy new supply typically softens prices + rents 12–24 months out; constrained supply supports both.
Investment metrics
- 1% rule
- 1.22% ✓
- Cap rate
- 10.03%
- Cash-on-cash
- 13.36%
- DSCR
- 1.59
- GRM
- 6.8
CMA / ARV
- ARV (median comp)
- $182,114
- List price
- $99,000
- Delta
- -45.64%
- Verdict
- UNDERPRICED
- Comps
- 20 within 1.0 mi
Show comp detail 11 sales within ~0.75 mi
| Address | Dist | Beds/Ba | Sqft | Sold | Price | $/sf | Match |
|---|---|---|---|---|---|---|---|
| 307 Holly St | 0.53mi | 3/2.0 | 1,626 (-3%) | 4mo | $189,000 | $116 | 63 |
| 113 Riverbend Ave | 0.49mi | 3/2.0 | 1,615 (-4%) | 4mo | $279,000 | $173 | 63 |
| 400 Ash | 0.25mi | 3/1.5 | 1,585 (-5%) | 21mo | $165,000 | $104 | 56 |
| 1105 O'neal | 0.31mi | 3/2.0 | 1,450 (-14%) | 7mo | $115,000 | $79 | 53 |
| 1109 Pear St | 0.40mi | 3/1.5 | 1,624 (-3%) | 21mo | $152,500 | $94 | 53 |
| 12 N Oak St | 0.27mi | 2/1.0 (-1) | 1,479 (-12%) | 4mo | $189,000 | $128 | 51 |
| 1212 Apple St | 0.58mi | 3/2.0 | 1,554 (-7%) | 11mo | $152,000 | $98 | 48 |
| 1611 Azalea Dr | 0.66mi | 4/1.0 (+1) | 1,800 (+7%) | 2mo | $78,500 | $44 | 42 |
| 500 Elm | 0.59mi | 3/2.0 | 1,768 (+6%) | 22mo | $224,900 | $127 | 42 |
| 501 Holly St | 0.59mi | 3/1.0 | 1,548 (-8%) | 15mo | $190,000 | $123 | 40 |
| 1111 Palm | 0.56mi | 4/1.5 (+1) | 1,485 (-11%) | 24mo | $162,000 | $109 | 24 |
Match score weights: distance 35% · size 25% · config 20% · recency 20%. Top-matched comps best support the ARV.
Projected returns pro-forma
6.97% appreciation · 3.0% rent growth · sell at horizon
- IRR
- 28.4%
- Equity multiple
- 2.95×
- Total profit
- $54,063
- Equity at exit
- $68,430
- IRR
- 26.0%
- Equity multiple
- 6.14×
- Total profit
- $142,438
- Equity at exit
- $129,828
Cash invested: $27,720 (down + closing). Projections, not guarantees.
Landlord ↔ Tenant lean methodology
- Overall (STATE)
- 90 Strongly Landlord-Friendly
- State Louisiana
- 90 Strongly Landlord-Friendly · R+12
- County
- — inherits STATE
- City
- — inherits STATE
ZIP-level market 71373
- Home prices YoY
- 6.3%
- Active inventory
- 40
- Price-to-rent
- 6.8×
Monthly cashflow live
- Estimated rent
- $1,210 medium interval (Pro) →
- Mortgage (P&I)
- −$519
- Tax from tax record
- −$87 /mo · $1,039/yr
- Insurance
- −$41
- HOA
- −$0
- Vacancy / Maint / Mgmt
- −$254
- Net cashflow
- $309
Break-even live
Sensitivity live
| Price | -10% $365 | -5% $337 | +0% $309 | +5% $281 | +10% $253 |
|---|---|---|---|---|---|
| Rent | -10% $213 | -5% $261 | +0% $309 | +5% $356 | +10% $404 |
| Rate | -1.0pp $359 | -0.5pp $334 | base $309 | +0.5pp $283 | +1.0pp $257 |
UW: 25.0% down · 7.5% · 30yr · 1.5% tax · 5.0% vac · 8.0% maint · 8.0% mgmt
Financing live
Cash to close
- Down payment
- $24,750
- Closing costs
- $2,970
- Reserves months
- —
- Total cash needed
- —
Loan-product check · same deal, 3 products live
Conventional
25% down · 7.5% · 30yr
- Down + closing
- —
- Monthly P&I
- —
- Monthly cashflow
- —
- DSCR
- —
- Eligible?
- —
Personal DTI + credit; lowest rate.
DSCR
20% down · 8.5% · 30yr
- Down + closing
- —
- Monthly P&I
- —
- Monthly cashflow
- —
- DSCR
- —
- Eligible?
- —
No personal income docs; deal must DSCR.
Hard money
10% down · 12.0% · 12mo
- Down + closing
- —
- Monthly P&I
- —
- Monthly cashflow
- —
- DSCR
- —
- Eligible?
- —
Short-term bridge; refi at stabilization.
Listing history 32 events
-
2026-06-21days on market $99,000 Active 571 DOM
-
2026-06-18days on market $99,000 Active 569 DOM
-
2026-06-17days on market $99,000 Active 568 DOM
-
2026-06-16days on market $99,000 Active 567 DOM
-
2026-06-15days on market $99,000 Active 566 DOM
-
2026-06-13days on market $99,000 Active 564 DOM
-
2026-06-12days on market $99,000 Active 563 DOM
-
2026-06-09days on market $99,000 Active 560 DOM
-
2026-06-08days on market $99,000 Active 559 DOM
-
2026-06-07days on market $99,000 Active 558 DOM
-
2026-06-07days on market $99,000 Active 557 DOM
-
2026-06-04days on market $99,000 Active 554 DOM
-
2026-06-02days on market $99,000 Active 553 DOM
-
2026-06-01days on market $99,000 Active 552 DOM
-
2026-05-31days on market $99,000 Active 551 DOM
-
2026-05-31days on market $99,000 Active 550 DOM
-
2026-05-05status Active 68-char remark
Show marketing remark (68 chars)
Located on a corner lot in Vidalia. Three bedrooms and three baths.
-
2026-04-30historical 68-char remark
Show marketing remark (68 chars)
Located on a corner lot in Vidalia. Three bedrooms and three baths.
-
2026-01-13status Active 68-char remark
Show marketing remark (68 chars)
Located on a corner lot in Vidalia. Three bedrooms and three baths.
-
2025-12-31historical 68-char remark
Show marketing remark (68 chars)
Located on a corner lot in Vidalia. Three bedrooms and three baths.
-
2025-06-17status Active 68-char remark
Show marketing remark (68 chars)
Located on a corner lot in Vidalia. Three bedrooms and three baths.
-
2025-06-15historical 68-char remark
Show marketing remark (68 chars)
Located on a corner lot in Vidalia. Three bedrooms and three baths.
-
2025-04-10price $99,000 68-char remark
Show marketing remark (68 chars)
Located on a corner lot in Vidalia. Three bedrooms and three baths.
-
2025-03-04status Active 68-char remark
Show marketing remark (68 chars)
Located on a corner lot in Vidalia. Three bedrooms and three baths.
-
2025-03-03historical 68-char remark
Show marketing remark (68 chars)
Located on a corner lot in Vidalia. Three bedrooms and three baths.
-
2025-03-03historical
Show marketing remark (68 chars)
Located on a corner lot in Vidalia. Three bedrooms and three baths.
-
2024-09-09$110,000 Active 68-char remark
Show marketing remark (68 chars)
Located on a corner lot in Vidalia. Three bedrooms and three baths.
-
2024-09-09$110,000
Show marketing remark (68 chars)
Located on a corner lot in Vidalia. Three bedrooms and three baths.
-
2016-05-23soldstatus $104,900
-
2016-05-16soldstatus
-
2016-03-07$110,000
-
2003-08-19soldstatus
ⓘ Source: listings_history table (triggers on properties + properties_extension) + one-shot
backfill from property_details.listing_events for pre-trigger history.
Tax reassessment forecast LA · Resets to sale price
- Current annual tax
- $1,039 · $87/mo
- Projected year-2 tax
- $1,039 · $87/mo
- Expected delta
- $0/yr ($0/mo · 0.0%)
ⓘ Screening estimate from a state-policy table — verify with the county assessor before closing.
Climate risk First Street
- Flood 1/10 Low FEMA zone X (shaded) · 0% chance over 30 yrs
- Wildfire 1/10 Low
- Heat 8/10 Severe 7 d/yr ≥109°F today · 20 d/yr by 30 yrs out
- Wind 8/10 Severe 92% chance of damaging wind over 30 yrs
- Air quality 1/10 Low 0 unhealthy d/yr today · 0 by 30 yrs out
Nearby sold comps map
Loading sold comps map…
Walkable amenities ~0.75 mi
Loading nearby amenities…
Taxation est. · year 1
- Rental income
- $14,517
- − Mortgage interest
- −$5,546
- − Property taxes
- −$1,039
- − Insurance
- −$495
- − Repairs & maintenance
- −$1,161
- − Management
- −$1,161
- − Depreciation
- −$2,880
- Taxable income
- $2,235
- Est. tax owed @ 24.0%
- −$536
- After-tax cash flow
- $3,168/yr
For passive investors: Depreciation is non-cash, so a rental often shows a tax loss while cash-flowing — sheltering income. Rental losses are passive: they offset passive income freely, and up to $25,000/yr can offset ordinary (W-2) income if you actively participate and your MAGI is under $100k (phasing out to $0 by $150k); unused losses carry forward. On sale, claimed depreciation is recaptured at up to 25%, and gains may owe capital-gains tax (a 1031 exchange can defer both). Figures are a year-1 estimate at your 24.0% rate — not tax advice; consult a CPA.
Schools (NCES district)
- District
- Concordia Parish
- NCES district ID
- 2200480
- Math proficiency
- 19% ▼ -39.00%
- Reading proficiency
- 27% ▼ -34.00%
- Median HH income
- $29,931
- Composite
- 18.45/100
- National rank
- #8929
- State rank
- #65 of 98 in LA
Livability — Vidalia
- Score
- 66/100
- State rank
- #123
- US rank
- #11620
Category grades
Schools grade is shown separately in the Schools card above.
Census & demographics
- Census place
- Vidalia, LA
- Population (ZIP)
- 5,754
Population outlook (Concordia County) Hauer SSP2
- Today (2025)
- 18,933 people
- By 2030
- 18,157 · -4.1%
- By 2040
- 16,559 · -12.5%
- By 2050
- 15,067 · -20.4%
- By 2075
- 11,770 · -37.8%
- By 2100
- 8,541 · -54.9%
Race, ethnicity, and origin ACS 2023
- Neighborhood character
- Predominantly White (74%)
- Race & ethnicity
- White 74% Black 24% Hispanic / Latino 1%
- Common ancestry
- Lithuanian 2% Slovak 1%
- Foreign-born
- 1% · Canada
- Languages at home
- 98% English-only · Spanish 1% French/Haitian/Cajun 1%
Political lean MEDSL · Concordia
- 2024 margin
- Strong R (+29.4) · D 34.8% · R 64.1% · Other 1.1%
- 2008→2024 swing
- -9.4pp toward R · 2008: -20.0pp · 2024: -29.4pp
- All cycles
- 2024: R+29.4 2020: R+26.9 2016: R+24.8 2012: R+17.2 2008: R+20.0
Not yet ingested
- Civics
- —
Market trends
- HPI YoY
- ▲ 6.97%
- Current HPI
- 117.3895
- Rent YoY
- —
- Metro
- —
- State GDP YoY
- ▲ 3.29%
- F500 in state
- 10
Industry mix (Fortune 500 HQ in LA)
| Industry | F500 HQs | Revenue |
|---|---|---|
| Telecommunications | 2 | $23B |
|
||
| Utilities | 1 | $12B |
|
||
| Wholesale / Distribution | 1 | $5B |
|
||
| Advertising | 1 | $2B |
|
||
Price history
-10.0% since first listed16 events — show timeline
- 2026-05-05 Relisted — MLSU
- 2026-04-30 Listing Removed — MLSU
- 2026-01-13 Relisted — MLSU
- 2025-12-31 Listing Removed — MLSU
- 2025-06-17 Relisted — MLSU
- 2025-06-15 Listing Removed — MLSU
- 2025-04-10 Price Changed $99,000 MLSU
- 2025-03-04 Relisted — MLSU
- 2025-03-03 Listing Removed — MLSU
- 2025-03-03 Listing Removed — MLSU
- 2024-09-09 Listed $110,000 MLSU
- 2024-09-09 Listed $110,000 MLSU
- 2016-05-23 Sold (Public Records) $104,900 Public Records
- 2016-05-16 Sold (MLS) — MLSU
- 2016-03-07 Listed $110,000 MLSU
- 2003-08-19 Sold (Public Records) — Public Records
Property tax history
+5.8%/yrLatest (2025): $1,039 · +0.6% YoY. Source: county tax records.
Cash-flow waterfall
monthlySold comps — $/sqft
last 12 mo · ≤1 miLoading sold comps…