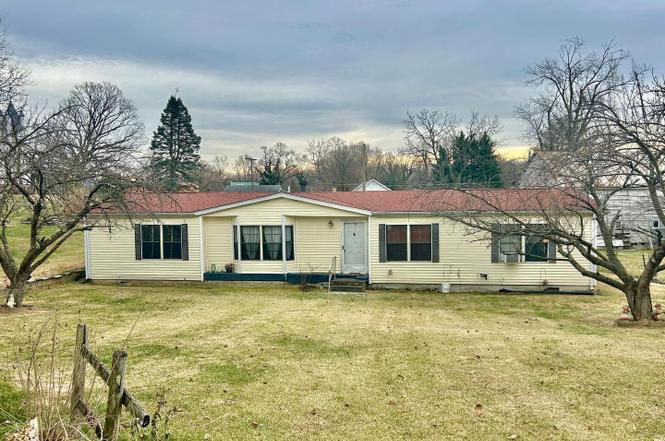
2 Old Chapel Ave · Boyce, VA
Flood risk 6/10 · Moderate
- FEMA flood zone
- X (unshaded)
- Chance of flooding over 30 yrs
- 0.75%
- Est. flood insurance / yr
- $507 – $1,088
Fire risk 3/10 · Minor
- Est. fire insurance / yr
- $666 – $1,236
Heat risk 6/10 · Moderate
- Hot days now (above 102°F)
- 7 days/yr
- Hot days in 30 yrs
- 17 days/yr
Wind risk 2/10 · Minimal
- Chance of severe wind over 30 yrs
- 2.0%
Air-quality risk 2/10 · Minimal
- Unhealthy air days now
- 1 days/yr
- Unhealthy air days in 30 yrs
- 1 days/yr
Risk factors via First Street. Map © Google.
Why this score? — see what drove the C- grade
The composite is a weighted blend of 9 inputs, each scored 0–100. Each bar is that input's sub-score; the figure is the points it added to the 100-point composite (weight × sub-score).
- Cash flow +15.5/30.0
- Appreciation +10.0/10.0
- ARV discount +7.5/15.0
- Schools +5.4/10.0
- DSCR +4.8/10.0
- Livability +3.4/5.0
- 1% rule +3.2/10.0
- Rent growth +2.5/5.0
- Condition / age +2.5/5.0
$299,900
🖨 Deal sheet 📄 Offer letter ✓ Due diligence
Listing remarks
Don't miss this opportunity to own a spacious 3 bed 2 bath home situated on flat lot in Boyce. Features open floor plan, separate dining room and large family room. Each bedroom includes generous walk-in closets for ample storage. Laundry conveniently located at rear entrance includes mud/room or versatile utility and pantry. Primary suite includes bath with large jetted tub and separate stand-up shower with dual sinks. Separate home and barn on property convey, potential rental income.
Key facts
- 0.75 acre lot
- Built 1988
- Listed 76 days
Neighborhood map
What this means for you Summary
Snapshot
- This is a 3-bed/2.0-bath manufactured listed at $300k.
Deal economics
- At list price, monthly cash flow is $124 ($1k/yr) — positive.
- The deal already cash-flows at list — no discount required.
- To meet the 1% rule (rent ≥ 1% of price), the offer needs to be $247k (17.6% below list).
- Recommended offer: $247k (17.6% below list) — sets the bar for 1% rule.
Location & tenants
- Location reads 67/100 on livability (#300 in VA) — a middle-class / working-renter tenant base. Strengths: employment A+, housing A+, crime A-; Watch: cost of living D+, amenities F, commute F.
- Clarke County Public School District (rural): math 52% / reading 69% proficiency, ranked #47 of 131 in VA (top 36%) — acceptable for families but not a draw, mixed tenant base, ~2y average lease; only 18% free/reduced lunch — higher-income household profile.
- Market conditions: 20 active listings in the ZIP; 2 comparable units currently listed for rent nearby; 15 units permitted in Clarke County in 2024 (0 in 5+ unit buildings).
Forward outlook
- In year one you build about $32k of equity ($2k loan paydown + $30k appreciation (10.0% local appreciation)).
- Clarke County population projected at +7% by 2050 — modest demand growth; plan on rents tracking national, not racing it.
- At projected returns (10.0% appreciation + 3.0% rent growth), your $84k cash investment doubles in ~3 years — after that, you're playing with house money.
- By year 2, paydown + projected appreciation supports a ~$52k cash-out refi (75% LTV) — recoverable capital for the next deal without selling this one.
Negotiation context
- It's been on market 76 days — a 6% lower offer ($282k) is reasonable based on typical stale-listing flexibility.
- Current owner paid $198k; list at $300k implies a 52% gain — meaningful room to come down on a strong offer.
Risks & watch-outs
- Climate carrying-cost: major flood risk; extreme-heat days projected 7→17/yr by 2055 (HVAC capex compounding) — expect insurance premiums to compound above CPI over the hold.
Questions for the listing agent
- It's been on market 76 days. Have you received any prior offers? Is the seller open to a 18% concession, seller financing, or rate buy-down credit?
- Why hasn't it sold? Are there any deal-killer items the seller is aware of (foundation, flood, title, zoning, code violations)?
- Is there a deadline driving the sale (1031 exchange, divorce, estate, relocation)? That informs how much negotiation room exists.
- Schools are B-rated — typically a magnet for longer-tenancy family renters. What's the average tenant stay here, and is there a school-zone premium baked into asking?
- What's the average days-on-market for RENTAL listings here right now (not sales)? A rising rental-DOM trend means longer vacancies and softer asking-rent achievability than the comps imply.
- What's the recent tenant-quality profile in this submarket — average credit score on applications, eviction rate, late-payment / NSF rate, and stable-employment percentage? A property-management company in the area should have these aggregated.
- How much new for-sale + rental construction is in the pipeline within 1–3 miles? Heavy new supply typically softens prices + rents 12–24 months out; constrained supply supports both.
Investment metrics
- 1% rule
- 0.82% ✗
- Cap rate
- 6.79%
- Cash-on-cash
- 1.77%
- DSCR
- 1.08
- GRM
- 10.1
CMA / ARV
No comps found within radius.
Projected returns pro-forma
10.0% appreciation · 3.0% rent growth · sell at horizon
- IRR
- 25.5%
- Equity multiple
- 3.04×
- Total profit
- $171,088
- Equity at exit
- $270,174
- IRR
- 22.5%
- Equity multiple
- 6.92×
- Total profit
- $497,416
- Equity at exit
- $582,640
Cash invested: $83,972 (down + closing). Projections, not guarantees.
Landlord ↔ Tenant lean methodology
- Overall (STATE)
- 55 Moderately Landlord-Leaning
- State Virginia
- 55 Moderately Landlord-Leaning · D+2
- County
- — inherits STATE
- City
- — inherits STATE
ZIP-level market 22620
- Home prices YoY
- 14.1%
- Active inventory
- 20
- Price-to-rent
- 10.1×
Monthly cashflow live
- Estimated rent
- $2,472 medium interval (Pro) →
- Mortgage (P&I)
- −$1,573
- Tax from tax record
- −$131 /mo · $1,577/yr
- Insurance
- −$125
- HOA
- −$0
- Vacancy / Maint / Mgmt
- −$519
- Net cashflow
- $124
Break-even live
UW: 25.0% down · 7.5% · 30yr · 1.5% tax · 5.0% vac · 8.0% maint · 8.0% mgmt
Financing live
Cash to close
- Down payment
- $74,975
- Closing costs
- $8,997
- Reserves months
- —
- Total cash needed
- —
Loan-product check · same deal, 3 products live
Conventional
25% down · 7.5% · 30yr
- Down + closing
- —
- Monthly P&I
- —
- Monthly cashflow
- —
- DSCR
- —
- Eligible?
- —
Personal DTI + credit; lowest rate.
DSCR
20% down · 8.5% · 30yr
- Down + closing
- —
- Monthly P&I
- —
- Monthly cashflow
- —
- DSCR
- —
- Eligible?
- —
No personal income docs; deal must DSCR.
Hard money
10% down · 12.0% · 12mo
- Down + closing
- —
- Monthly P&I
- —
- Monthly cashflow
- —
- DSCR
- —
- Eligible?
- —
Short-term bridge; refi at stabilization.
Rent comps 2 comps
| Address | Beds | Baths | Sqft | Rent | $/sqft | DOM | Units | Dist |
|---|---|---|---|---|---|---|---|---|
| 18 E Huntingdon Ln Boyce, VA | 3.0 | 3.0 | 2150 | $2,475 | $1.15 | 18d | 1 | 0.19mi |
| 8122 John Mosby Hwy Boyce, VA | 3.0 | 1.5 | 1600 | $2,450 | $1.53 | 44d | 1 | 1.37mi |
Listing history 9 events
-
2026-04-20status Pending
-
2026-04-08historical Active Under Contract
-
2026-03-27price $299,900
-
2026-03-04price $315,000
-
2026-02-24price $329,000
-
2026-01-22$349,000 Active
-
2025-12-17historical $349,000
-
2023-07-26soldstatus $197,500
-
2023-07-26soldstatus $197,500
ⓘ Source: listings_history table (triggers on properties + properties_extension) + one-shot
backfill from property_details.listing_events for pre-trigger history.
Tax reassessment forecast VA · Resets to sale price
- Current annual tax
- $1,577 · $131/mo
- Projected year-2 tax
- $2,459 · $205/mo
- Expected delta
- +$882/yr (+$74/mo · 55.9%)
ⓘ Screening estimate from a state-policy table — verify with the county assessor before closing.
Climate risk First Street
- Flood 6/10 Major FEMA zone X (unshaded) · 75% chance over 30 yrs
- Wildfire 3/10 Moderate
- Heat 6/10 Major 7 d/yr ≥102°F today · 17 d/yr by 30 yrs out
- Wind 2/10 Low 2% chance of damaging wind over 30 yrs
- Air quality 2/10 Low 1 unhealthy d/yr today · 1 by 30 yrs out
Nearby sold comps map
Loading sold comps map…
Walkable amenities ~0.75 mi
Loading nearby amenities…
Taxation est. · year 1
- Rental income
- $29,660
- − Mortgage interest
- −$16,799
- − Property taxes
- −$1,577
- − Insurance
- −$1,500
- − Repairs & maintenance
- −$2,373
- − Management
- −$2,373
- − Depreciation
- −$8,724
- Taxable loss
- −$3,686
- Est. tax savings @ 24.0%
- +$885
- After-tax cash flow
- $2,367/yr
For passive investors: Depreciation is non-cash, so a rental often shows a tax loss while cash-flowing — sheltering income. Rental losses are passive: they offset passive income freely, and up to $25,000/yr can offset ordinary (W-2) income if you actively participate and your MAGI is under $100k (phasing out to $0 by $150k); unused losses carry forward. On sale, claimed depreciation is recaptured at up to 25%, and gains may owe capital-gains tax (a 1031 exchange can defer both). Figures are a year-1 estimate at your 24.0% rate — not tax advice; consult a CPA.
Schools (NCES district)
- District
- Clarke County Public School District
- NCES district ID
- 5100870
- Math proficiency
- 52% ▼ -28.00%
- Reading proficiency
- 69% ▼ -3.00%
- Median HH income
- $72,709
- Composite
- 53.6/100
- National rank
- #1439
- State rank
- #47 of 131 in VA
Livability — Boyce
- Score
- 67/100
- State rank
- #300
- US rank
- #10749
Category grades
Schools grade is shown separately in the Schools card above.
Census & demographics
- Census place
- Boyce, VA
- Population (ZIP)
- 2,649
Population outlook (Clarke County) Hauer SSP2
- Today (2025)
- 15,102 people
- By 2030
- 15,463 · +2.4%
- By 2040
- 16,014 · +6.0%
- By 2050
- 16,212 · +7.4%
- By 2075
- 17,257 · +14.3%
- By 2100
- 16,631 · +10.1%
Race, ethnicity, and origin ACS 2023
- Neighborhood character
- Predominantly White (83%)
- Race & ethnicity
- White 83% Hispanic / Latino 9% Two or more races 6% Black 2% Native American 1%
- Hispanic origin (detail)
- Mexican 5%
- Common ancestry
- Italian 9% Slovak 4% Romanian 2%
- Foreign-born
- 8% · Canada
- Languages at home
- 91% English-only · Spanish 9%
Political lean MEDSL · Clarke
- 2024 margin
- R (+16.9) · D 40.8% · R 57.7% · Other 1.5%
- 2008→2024 swing
- -11.7pp toward R · 2008: -5.2pp · 2024: -16.9pp
- All cycles
- 2024: R+16.9 2020: R+13.6 2016: R+19.8 2012: R+13.7 2008: R+5.2
Not yet ingested
- Civics
- —
Market trends
- HPI YoY
- ▲ 51.60%
- Current HPI
- 417.207
- Rent YoY
- —
- Metro
- —
- State GDP YoY
- ▲ 2.40%
- F500 in state
- 50
Industry mix (Fortune 500 HQ in VA)
| Industry | F500 HQs | Revenue |
|---|---|---|
| Aerospace / Defense | 4 | $236B |
|
||
| Technology / Defense | 3 | $32B |
|
||
| Financial Services | 2 | $176B |
|
||
| Utilities | 2 | $27B |
|
||
| Insurance | 2 | $25B |
|
||
| Technology | 2 | $15B |
|
||
Price history
+51.8% since first listed9 events — show timeline
- 2026-04-20 Pending — BRIGHT MLS
- 2026-04-08 Contingent — BRIGHT MLS
- 2026-03-27 Price Changed $299,900 BRIGHT MLS
- 2026-03-04 Price Changed $315,000 BRIGHT MLS
- 2026-02-24 Price Changed $329,000 BRIGHT MLS
- 2026-01-22 Listed $349,000 BRIGHT MLS
- 2025-12-17 Coming Soon $349,000 BRIGHT MLS
- 2023-07-26 Sold (Public Records) $197,500 Public Records
- 2023-07-26 Sold (Public Records) $197,500 Public Records
Property tax history
+3.7%/yrLatest (2025): $1,577 · +30.6% YoY. Source: county tax records.
Cash-flow waterfall
monthlySold comps — $/sqft
last 12 mo · ≤1 miLoading sold comps…