 Duplex
5535 Mesa Cir · Dallas, TX
Flood risk 6/10 · Moderate
- FEMA flood zone
- X
- Chance of flooding over 30 yrs
- 0.7%
- Est. flood insurance / yr
- $507 – $1,088
Fire risk 1/10 · Minimal
- Est. fire insurance / yr
- $1,222 – $2,270
Heat risk 7/10 · Major
- Hot days now (above 109°F)
- 7 days/yr
- Hot days in 30 yrs
- 23 days/yr
Wind risk 6/10 · Moderate
- Chance of severe wind over 30 yrs
- 27.0%
Air-quality risk 3/10 · Minor
- Unhealthy air days now
- 3 days/yr
- Unhealthy air days in 30 yrs
- 4 days/yr
Risk factors via First Street. Map © Google.
Why this score? — see what drove the C grade
The composite is a weighted blend of 9 inputs, each scored 0–100. Each bar is that input's sub-score; the figure is the points it added to the 100-point composite (weight × sub-score).
- Cash flow +19.9/30.0
- ARV discount +15.0/15.0
- DSCR +6.3/10.0
- 1% rule +4.6/10.0
- Livability +4.0/5.0
- Schools +2.8/10.0
- Condition / age +2.5/5.0
- Rent growth +2.3/5.0
- Appreciation +0.0/10.0
$599,000
🖨 Deal sheet 📄 Offer letter ✓ Due diligence
Multi-family units
County records classify this as Multi-Family (2-4 Unit). Listing-text estimate: 2 units. confirmed
Listing remarks MLS
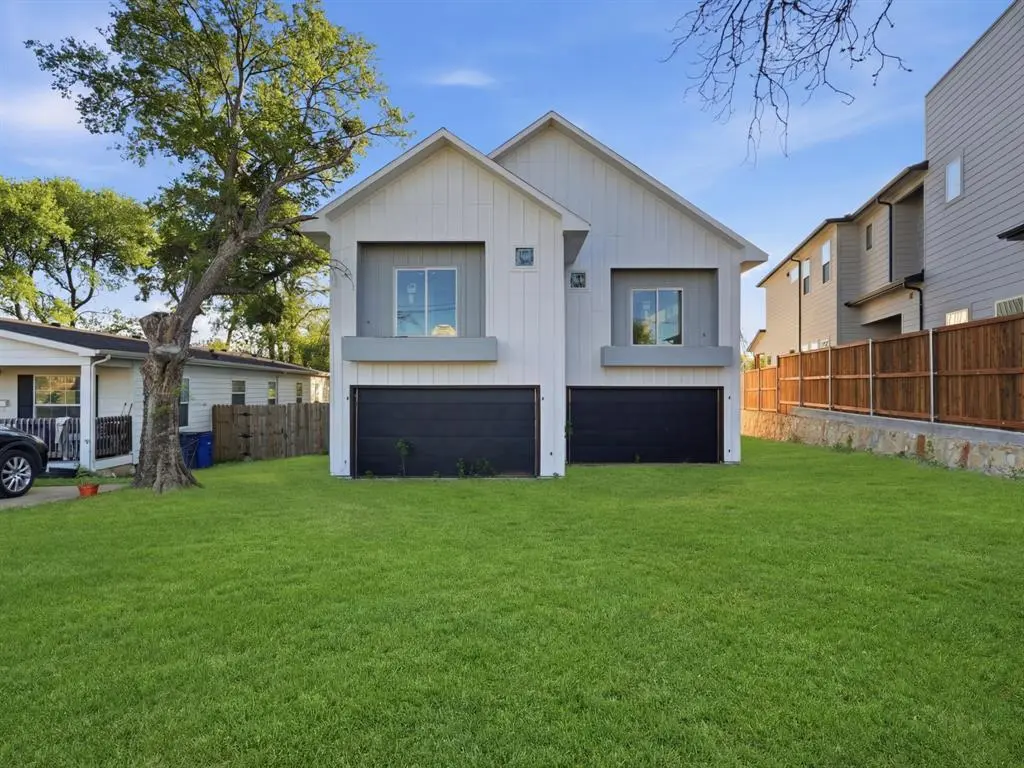
2 Unit full duplex in a rapidly developing Dallas corridor, offering a rare opportunity for investors or owner-occupants to secure immediate equity and strong upside potential. Located at 5535 Mesa Circle, this high-value asset is offered at $650,000, significantly below its prior appraisal, making it an attractive addition to any portfolio. Featuring two spacious units, each of the two units are offering 3 bedrooms, 3.5 baths, and approximately 2,000 square feet. This property is thoughtfully designed with modern living in mind. Construction has been completed through sheetrock and paint, giving the next owner the unique ability to select final finishes and truly customize the space while maximizing future rental income. A rare chance to complete and capitalize on a nearly finished duplex in a high-growth area with built-in equity and significant income potential don’t miss this opportunity.
Key facts
- Modern living
- High-end finishes
- Full duplex
Tags
Neighborhood map
What this means for you Summary
Snapshot
- This is a 2 × 3.0-bed/3.5-bath units multifamily listed at $599k.
Deal economics
- At list price, monthly cash flow is $719 ($9k/yr) — positive. Per door: $360/mo.
- The deal already cash-flows at list — no discount required.
- To meet the 1% rule (rent ≥ 1% of price), the offer needs to be $572k (4.4% below list).
- Recommended offer: $563k (6.0% below list) — sets the bar for market timing.
- Cap rate 7.7% vs local median 2.3% in Dallas — top-decile yield for the area; either an underpriced asset or a hidden risk that comps aren't pricing in. Stress-test before assuming the spread holds.
Location & tenants
- Location reads 81/100 on livability (#24 in TX, #1,380 nationally) — a professional / high-income tenant draw. Strengths: amenities A+, commute A+, housing A+; Watch: schools C-, crime F.
- Dallas ISD (urban): math 31% / reading 36% proficiency, ranked #559 of 826 in TX (top 68%) — families likely to look elsewhere, expect single-tenant / working-renter base with shorter leases; 83% free/reduced lunch — lower-income household profile, screen leases tightly.
- Market conditions: Rents soft (-0.7%/yr); 85 active listings in the ZIP; 12,577 units permitted in Dallas County in 2024 (6,829 in 5+ unit buildings).
- At $5,725/mo this rent would consume 108% of the median local household income ($63k/yr) (locally 1427% of renters already pay >50% of income on rent) — very limited rent-growth headroom before tenants either downsize or default.
Forward outlook
- Local home prices are declining (-3.0%/yr); year-one equity from $4k of loan paydown is wiped out by about $18k of value loss. Plan a longer hold.
- Dallas County population projected at +35% by 2050 — long-run rental-demand tailwind backs the buy-and-hold thesis.
Negotiation context
- It's been on market 81 days — a 6% lower offer ($563k) is reasonable based on typical stale-listing flexibility.
- 2 sale attempts since 5y ago; this cycle's ask has dropped $51k (8%) from the opening price — seller is motivated, your offer sets the floor, not the list.
Risks & watch-outs
- Climate carrying-cost: major flood risk; major wind risk, 27% chance of damaging wind over 30y; extreme-heat days projected 7→23/yr by 2055 (HVAC capex compounding) — expect insurance premiums to compound above CPI over the hold.
Questions for the listing agent
- It's been on market 81 days. Have you received any prior offers? Is the seller open to a 6% concession, seller financing, or rate buy-down credit?
- Can we see the unit-by-unit rent roll, current vacancy, and any below-market leases? What's the average tenancy length?
- What capital expenditures (roof, boiler, parking lot, exteriors) have been made in the last 5 years, and what's planned in the next 2?
- Why hasn't it sold? Are there any deal-killer items the seller is aware of (foundation, flood, title, zoning, code violations)?
- Is there a deadline driving the sale (1031 exchange, divorce, estate, relocation)? That informs how much negotiation room exists.
- Crime grade is F in this area — have there been break-ins, vandalism, or insurance claims at this property in the last 3 years? What carrier currently insures it and at what premium?
- What's the average days-on-market for RENTAL listings here right now (not sales)? A rising rental-DOM trend means longer vacancies and softer asking-rent achievability than the comps imply.
- What's the recent tenant-quality profile in this submarket — average credit score on applications, eviction rate, late-payment / NSF rate, and stable-employment percentage? A property-management company in the area should have these aggregated.
- How much new apartment / multifamily construction is in the pipeline within 1–3 miles? Heavy new supply (>2% of stock underway) typically softens rents 12–24 months out; light construction supports rent growth.
Investment metrics
- 1% rule
- 0.96% ✗
- Cap rate
- 7.73%
- Cash-on-cash
- 5.15%
- DSCR
- 1.23
- GRM
- 8.7
CMA / ARV
- ARV (median comp)
- $935,955
- List price
- $599,000
- Delta
- -36.00%
- Verdict
- UNDERPRICED
- Comps
- 2 within 2.0 mi
Projected returns pro-forma
-3.0% appreciation · 0.0% rent growth · sell at horizon
- IRR
- -11.5%
- Equity multiple
- 0.59×
- Total profit
- $-68,147
- Equity at exit
- $89,313
- IRR
- -7.0%
- Equity multiple
- 0.61×
- Total profit
- $-65,675
- Equity at exit
- $51,791
Cash invested: $167,720 (down + closing). Projections, not guarantees.
Landlord ↔ Tenant lean methodology
- Overall (STATE)
- 87 Strongly Landlord-Friendly
- State Texas
- 87 Strongly Landlord-Friendly · R+5
- County
- — inherits STATE
- City
- — inherits STATE
ZIP-level market 75235
- Home prices YoY
- -25.5%
- Rents YoY
- -0.7%
- Active inventory
- 85
- Price-to-rent
- 17.4×
Monthly cashflow live
- Estimated rent
- $5,725 high interval (Pro) →
- Mortgage (P&I)
- −$3,141
- Tax from tax record
- −$413 /mo · $4,951/yr
- Insurance
- −$250
- HOA
- −$0
- Vacancy / Maint / Mgmt
- −$1,202
- Net cashflow
- $719
Break-even live
2-unit breakdown (identical units grouped — click to expand)
| Units | Beds | Baths | Est. rent |
|---|---|---|---|
| 2× units | 3.0 | 3.5 | $5,724 |
| #1 | 3.0 | 3.5 | $2,862 |
| #2 | 3.0 | 3.5 | $2,862 |
| Total (2 units) | $5,725 | ||
UW: 25.0% down · 7.5% · 30yr · 1.5% tax · 5.0% vac · 8.0% maint · 8.0% mgmt
Financing live
Cash to close
- Down payment
- $149,750
- Closing costs
- $17,970
- Reserves months
- —
- Total cash needed
- —
Loan-product check · same deal, 3 products live
Conventional
25% down · 7.5% · 30yr
- Down + closing
- —
- Monthly P&I
- —
- Monthly cashflow
- —
- DSCR
- —
- Eligible?
- —
Personal DTI + credit; lowest rate.
DSCR
20% down · 8.5% · 30yr
- Down + closing
- —
- Monthly P&I
- —
- Monthly cashflow
- —
- DSCR
- —
- Eligible?
- —
No personal income docs; deal must DSCR.
Hard money
10% down · 12.0% · 12mo
- Down + closing
- —
- Monthly P&I
- —
- Monthly cashflow
- —
- DSCR
- —
- Eligible?
- —
Short-term bridge; refi at stabilization.
Listing history 20 events
-
2026-06-18days on market $599,000 Active 81 DOM
-
2026-06-17days on market $599,000 Active 80 DOM
-
2026-06-16days on market $599,000 Active 79 DOM
-
2026-06-15pricedays on market $599,000 Active 78 DOM
-
2026-06-13days on market $625,000 Active 76 DOM
-
2026-06-09days on market $625,000 Active 72 DOM
-
2026-06-08days on market $625,000 Active 71 DOM
-
2026-06-07days on market $625,000 Active 70 DOM
-
2026-06-04days on market $625,000 Active 67 DOM
-
2026-06-03days on market $625,000 Active 66 DOM
-
2026-06-02days on market $625,000 Active 65 DOM
-
2026-06-01days on market $625,000 Active 64 DOM
-
2026-05-31days on market $625,000 Active 63 DOM
-
2026-04-23price $625,000 920-char remark
Show marketing remark (920 chars)
2 Unit full duplex in a rapidly developing Dallas corridor, offering a rare opportunity for investors or owner-occupants to secure immediate equity and strong upside potential. Located at 5535 Mesa Circle, this high-value asset is offered at $650,000, significantly below its prior appraisal, making it an attractive addition to any portfolio. Featuring two spacious units, each of the two units are offering 3 bedrooms, 3.5 baths, and approximately 2,000 square feet. This property is thoughtfully designed with modern living in mind. Construction has been completed through sheetrock and paint, giving the next owner the unique ability to select final finishes and truly customize the space while maximizing future rental income. A rare chance to complete and capitalize on a nearly finished duplex in a high-growth area with built-in equity and significant income potential don’t miss this opportunity.
-
2026-03-29$650,000 Active 920-char remark
Show marketing remark (920 chars)
2 Unit full duplex in a rapidly developing Dallas corridor, offering a rare opportunity for investors or owner-occupants to secure immediate equity and strong upside potential. Located at 5535 Mesa Circle, this high-value asset is offered at $650,000, significantly below its prior appraisal, making it an attractive addition to any portfolio. Featuring two spacious units, each of the two units are offering 3 bedrooms, 3.5 baths, and approximately 2,000 square feet. This property is thoughtfully designed with modern living in mind. Construction has been completed through sheetrock and paint, giving the next owner the unique ability to select final finishes and truly customize the space while maximizing future rental income. A rare chance to complete and capitalize on a nearly finished duplex in a high-growth area with built-in equity and significant income potential don’t miss this opportunity.
-
2022-03-01soldstatus
-
2022-01-01historical
-
2021-09-10$160,000 Active
-
2017-10-26soldstatus
-
1995-02-01soldstatus
ⓘ Source: listings_history table (triggers on properties + properties_extension) + one-shot
backfill from property_details.listing_events for pre-trigger history.
Tax reassessment forecast TX · Resets to sale price
- Current annual tax
- $4,951 · $413/mo
- Projected year-2 tax
- $10,962 · $913/mo
- Expected delta
- +$6,010/yr (+$501/mo · 121.4%)
ⓘ Screening estimate from a state-policy table — verify with the county assessor before closing.
Climate risk First Street
- Flood 6/10 Major FEMA zone X · 70% chance over 30 yrs
- Wildfire 1/10 Low
- Heat 7/10 Severe 7 d/yr ≥109°F today · 23 d/yr by 30 yrs out
- Wind 6/10 Major 27% chance of damaging wind over 30 yrs
- Air quality 3/10 Moderate 3 unhealthy d/yr today · 4 by 30 yrs out
Nearby sold comps map
Loading sold comps map…
Walkable amenities ~0.75 mi
Loading nearby amenities…
Taxation est. · year 1
- Rental income
- $68,700
- − Mortgage interest
- −$33,553
- − Property taxes
- −$4,951
- − Insurance
- −$2,995
- − Repairs & maintenance
- −$5,496
- − Management
- −$5,496
- − Depreciation
- −$17,425
- Taxable loss
- −$1,217
- Est. tax savings @ 24.0%
- +$292
- After-tax cash flow
- $8,924/yr
For passive investors: Depreciation is non-cash, so a rental often shows a tax loss while cash-flowing — sheltering income. Rental losses are passive: they offset passive income freely, and up to $25,000/yr can offset ordinary (W-2) income if you actively participate and your MAGI is under $100k (phasing out to $0 by $150k); unused losses carry forward. On sale, claimed depreciation is recaptured at up to 25%, and gains may owe capital-gains tax (a 1031 exchange can defer both). Figures are a year-1 estimate at your 24.0% rate — not tax advice; consult a CPA.
Schools (NCES district)
- District
- Dallas ISD
- NCES district ID
- 4816230
- Math proficiency
- 31% ▼ -16.00%
- Reading proficiency
- 36% ▼ -4.00%
- Median HH income
- $42,881
- Composite
- 28.41/100
- National rank
- #6763
- State rank
- #559 of 826 in TX
Livability — Dallas
- Score
- 81/100
- State rank
- #24
- US rank
- #1380
Category grades
Schools grade is shown separately in the Schools card above.
Census & demographics
- Census place
- Dallas, TX
- County
- Dallas County · 2,612,404 people
- City population
- 1,168,437
- Metro
- Dallas-Fort Worth-Arlington, TX
- Population (ZIP)
- 19,637
- Household income
- $63,393
- Rent vs Own
- Severe rent burden
- 1427.0
Population outlook (Dallas County) Hauer SSP2
- Today (2025)
- 2,979,839 people
- By 2030
- 3,191,823 · +7.1%
- By 2040
- 3,619,611 · +21.5%
- By 2050
- 4,026,915 · +35.1%
- By 2075
- 4,957,073 · +66.4%
- By 2100
- 5,508,725 · +84.9%
Race, ethnicity, and origin ACS 2023
- Neighborhood character
- Diverse neighborhood (Simpson 0.68)
- Race & ethnicity
- Hispanic / Latino 48% White 24% Black 15% Two or more races 13% Asian 10% Native American 2%
- Hispanic origin (detail)
- Mexican 41% Puerto Rican 1%
- Common ancestry
- Italian 1% Slovak 1% Iranian 1%
- Foreign-born
- 28% · Canada, China, South Korea
- Languages at home
- 52% English-only · Spanish 39% Chinese 3% Tagalog/Filipino 2%
Political lean MEDSL · Dallas
- 2024 margin
- Strong D (+22.2) · D 60.2% · R 38.0% · Other 1.8%
- 2008→2024 swing
- +6.9pp toward D · 2008: 15.3pp · 2024: 22.2pp
- All cycles
- 2024: D+22.2 2020: D+31.6 2016: D+26.2 2012: D+15.4 2008: D+15.3
Not yet ingested
- Civics
- —
Market trends
- HPI YoY
- ▼ -106.47%
- Current HPI
- 310.5719
- Rent YoY
- ▼ -0.73%
- Metro
- Dallas-Fort Worth-Arlington, TX
- State GDP YoY
- ▲ 3.95%
- F500 in state
- 110
Industry mix (Fortune 500 HQ in TX)
| Industry | F500 HQs | Revenue |
|---|---|---|
| Energy | 16 | $1,198B |
|
||
| Technology | 5 | $198B |
|
||
| Engineering / Construction | 4 | $72B |
|
||
| Energy Services | 3 | $60B |
|
||
| Utilities | 3 | $41B |
|
||
| Healthcare | 2 | $330B |
|
||
Price history
+290.6% since first listed7 events — show timeline
- 2026-04-23 Price Changed $625,000 NTREIS
- 2026-03-29 Listed $650,000 NTREIS
- 2022-03-01 Sold (Public Records) — Public Records
- 2022-01-01 Listing Removed — NTREIS
- 2021-09-10 Listed $160,000 NTREIS
- 2017-10-26 Sold (Public Records) — Public Records
- 1995-02-01 Sold (Public Records) — Public Records
Property tax history
+14.0%/yrLatest (2025): $4,951 · +82.5% YoY. Source: county tax records.
Cash-flow waterfall
monthlySold comps — $/sqft
last 12 mo · ≤1 miLoading sold comps…