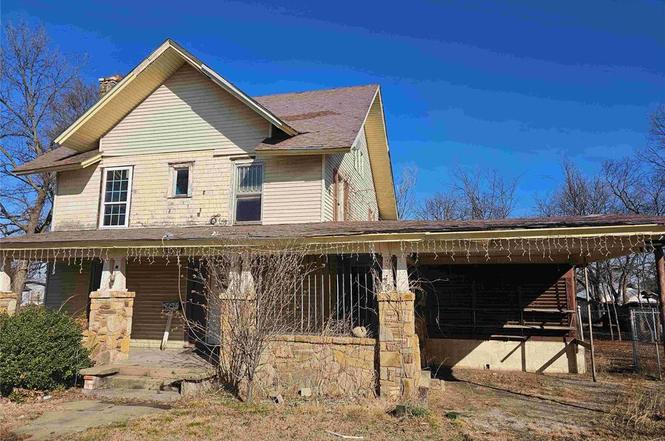
310 E Oklahoma Ave · Sulphur, OK
Flood risk 1/10 · Minimal
- FEMA flood zone
- X (unshaded)
- Chance of flooding over 30 yrs
- 0.0%
- Est. flood insurance / yr
- $507 – $1,088
Fire risk 7/10 · Major
- Est. fire insurance / yr
- $2,463 – $4,575
Heat risk 6/10 · Moderate
- Hot days now (above 108°F)
- 7 days/yr
- Hot days in 30 yrs
- 19 days/yr
Wind risk 4/10 · Minor
- Chance of severe wind over 30 yrs
- 10.0%
Air-quality risk 2/10 · Minimal
- Unhealthy air days now
- 1 days/yr
- Unhealthy air days in 30 yrs
- 1 days/yr
Risk factors via First Street. Map © Google.
Why this score? — see what drove the B+ grade
The composite is a weighted blend of 9 inputs, each scored 0–100. Each bar is that input's sub-score; the figure is the points it added to the 100-point composite (weight × sub-score).
- Cash flow +30.0/30.0
- 1% rule +10.0/10.0
- DSCR +10.0/10.0
- Appreciation +8.0/10.0
- ARV discount +7.5/15.0
- Livability +3.4/5.0
- Schools +2.6/10.0
- Rent growth +2.5/5.0
- Condition / age +2.5/5.0
$61,000
🖨 Deal sheet 📄 Offer letter ✓ Due diligence
Listing remarks
Due to condition, the property may have health/safety risk(s). Prior to entry / access, all parties must sign a Hold Harmless Agreement and the property may only be shown by appointment. Three-bedroom, 2-bath, two-story frame home built in 1968. The home has a lot of potential. Large corner lot (2 full lots). There is the possibility of the buyer splitting back to the original two lots. Large trees, alley access, and fully fenced. All offers must be submitted at www. vrmproperties. (SEE Realtor Remarks for website. ) Agents must register as a User, enter the property address, and click on "Start Offer". This property may qualify for Seller Financing (Vendee). If property was built
Key facts
- Alley access
- Fully fenced
- Large corner lot
Tags
Property features AI
Finance
- Other: Living area reported as 1,938 (assessor)
- Financial info: REO / Bank-owned condition; Not assumable
- HOA & community: No mandatory association dues
Exterior
- Parking: Detached or attached 2-car garage
- Utilities: No flood insurance indicated
- Home design: Single family residence; Residential property; Two levels; Faces west
- Construction: Frame construction; Composition roof; Conventional foundation; Built status listed as dilapidated
- Exterior features: Storage; Corner lot
Interior
- Bedrooms: 3 bedrooms
- Bathrooms: 2 full bathrooms
- Heating & cooling: Electric heating
- Interior features: No fireplace; No in-law plan
Neighborhood map
What this means for you Summary
Snapshot
- This is a 3-bed/2.0-bath single-family listed at $61k.
Deal economics
- At list price, monthly cash flow is $550 ($7k/yr) — positive.
- The deal already cash-flows at list — no discount required.
- Meets the 1% rule at list price ($1k rent vs $61k).
- Recommended offer: $59k (3.0% below list) — sets the bar for market timing.
- Cap rate 17.1% vs local median 3.4% in Sulphur — top-decile yield for the area; either an underpriced asset or a hidden risk that comps aren't pricing in. Stress-test before assuming the spread holds.
Location & tenants
- Location reads 68/100 on livability (#60 in OK) — a middle-class / working-renter tenant base. Strengths: cost of living A+, housing A+, crime B+; Watch: employment C-, amenities F, commute F.
- Sulphur (town): math 30% / reading 32% proficiency, ranked #56 of 270 in OK (top 21%) — families likely to look elsewhere, expect single-tenant / working-renter base with shorter leases.
- Zoned schools: Sulphur Intermediate Es (math 34% / reading 27%, grade F, #247 of 845 statewide, top 30%, 299 students, 0% FRL); Sulphur Hs (math 32% / reading 32%, grade F, #67 of 447 statewide, top 16%, 436 students, 0% FRL) — zoned schools average 0% FRL vs 50% district-wide (50 pts lower); this property's tenant base skews higher-income than the district average.
- Market conditions: 147 active listings in the ZIP; 20 units permitted in Murray County in 2024 (0 in 5+ unit buildings).
Forward outlook
- In year one you build about $4k of equity ($422 loan paydown + $4k appreciation (5.9% local appreciation)).
- Murray County population projected at +16% by 2050 — long-run rental-demand tailwind backs the buy-and-hold thesis.
- At projected returns (5.9% appreciation + 3.0% rent growth), your $17k cash investment doubles in ~2 years — after that, you're playing with house money.
- By year 8, paydown + projected appreciation supports a ~$31k cash-out refi (75% LTV) — recoverable capital for the next deal without selling this one.
Negotiation context
- It's been on market 49 days — a 3% lower offer ($59k) is reasonable based on typical stale-listing flexibility.
Risks & watch-outs
- Climate carrying-cost: major wildfire risk; extreme-heat days projected 7→19/yr by 2055 (HVAC capex compounding) — expect insurance premiums to compound above CPI over the hold.
Questions for the listing agent
- It's been on market 49 days. Have you received any prior offers? Is the seller open to a 3% concession, seller financing, or rate buy-down credit?
- Built in 1968 — when were the roof, HVAC, electrical panel, plumbing, and water heater last replaced?
- Is there a deadline driving the sale (1031 exchange, divorce, estate, relocation)? That informs how much negotiation room exists.
- Schools are D-rated, which usually means shorter tenancies and higher turnover. Who's the typical renter profile here, and what's been the actual vacancy rate?
- What's the average days-on-market for RENTAL listings here right now (not sales)? A rising rental-DOM trend means longer vacancies and softer asking-rent achievability than the comps imply.
- What's the recent tenant-quality profile in this submarket — average credit score on applications, eviction rate, late-payment / NSF rate, and stable-employment percentage? A property-management company in the area should have these aggregated.
- How much new for-sale + rental construction is in the pipeline within 1–3 miles? Heavy new supply typically softens prices + rents 12–24 months out; constrained supply supports both.
Investment metrics
- 1% rule
- 2.01% ✓
- Cap rate
- 17.12%
- Cash-on-cash
- 38.66%
- DSCR
- 2.72
- GRM
- 4.2
CMA / ARV
- ARV (on-the-fly)
- $160,854
- Comps found
- 5
Show comp detail 5 sales within ~0.75 mi
| Address | Dist | Beds/Ba | Sqft | Sold | Price | $/sf | Match |
|---|---|---|---|---|---|---|---|
| 310 E Oklahoma Ave | 0.00mi | 3/2.0 | 1,938 (0%) | 0mo | $59,500 | $31 | 100 |
| 1200 E 4th St | 0.07mi | 4/2.0 (+1) | 2,160 (+12%) | 2mo | $180,000 | $83 | 71 |
| 1214 E 2nd | 0.13mi | 3/2.0 | 1,805 (-7%) | 15mo | $235,000 | $130 | 70 |
| 921 E Wynnewood | 0.46mi | 2/2.0 (-1) | 2,024 (+4%) | 13mo | $160,000 | $79 | 55 |
| 1221 E 2nd | 0.10mi | 4/2.5 (+1) | 2,184 (+13%) | 19mo | $228,400 | $105 | 51 |
Match score weights: distance 35% · size 25% · config 20% · recency 20%. Top-matched comps best support the ARV.
Projected returns pro-forma
5.9% appreciation · 3.0% rent growth · sell at horizon
- IRR
- 48.4%
- Equity multiple
- 4.06×
- Total profit
- $52,317
- Equity at exit
- $37,966
- IRR
- 45.4%
- Equity multiple
- 8.41×
- Total profit
- $126,573
- Equity at exit
- $68,522
Cash invested: $17,080 (down + closing). Projections, not guarantees.
Landlord ↔ Tenant lean methodology
- Overall (STATE)
- 83 Strongly Landlord-Friendly
- State Oklahoma
- 83 Strongly Landlord-Friendly · R+20
- County
- — inherits STATE
- City
- — inherits STATE
ZIP-level market 73086
- Home prices YoY
- 1.8%
- Active inventory
- 147
- Price-to-rent
- 4.2×
Monthly cashflow live
- Estimated rent
- $1,225 medium interval (Pro) →
- Mortgage (P&I)
- −$320
- Tax from tax record
- −$72 /mo · $864/yr
- Insurance
- −$25
- HOA
- −$0
- Vacancy / Maint / Mgmt
- −$257
- Net cashflow
- $550
Break-even live
UW: 25.0% down · 7.5% · 30yr · 1.5% tax · 5.0% vac · 8.0% maint · 8.0% mgmt
Financing live
Cash to close
- Down payment
- $15,250
- Closing costs
- $1,830
- Reserves months
- —
- Total cash needed
- —
Loan-product check · same deal, 3 products live
Conventional
25% down · 7.5% · 30yr
- Down + closing
- —
- Monthly P&I
- —
- Monthly cashflow
- —
- DSCR
- —
- Eligible?
- —
Personal DTI + credit; lowest rate.
DSCR
20% down · 8.5% · 30yr
- Down + closing
- —
- Monthly P&I
- —
- Monthly cashflow
- —
- DSCR
- —
- Eligible?
- —
No personal income docs; deal must DSCR.
Hard money
10% down · 12.0% · 12mo
- Down + closing
- —
- Monthly P&I
- —
- Monthly cashflow
- —
- DSCR
- —
- Eligible?
- —
Short-term bridge; refi at stabilization.
Listing history 5 events
-
2026-04-24status Pending
-
2026-04-07price $61,000
-
2026-03-06$76,000 Active
-
2009-11-25soldstatus $72,000
-
2003-09-11soldstatus $70,000
ⓘ Source: listings_history table (triggers on properties + properties_extension) + one-shot
backfill from property_details.listing_events for pre-trigger history.
Tax reassessment forecast OK · Resets to sale price
- Current annual tax
- $864 · $72/mo
- Projected year-2 tax
- $864 · $72/mo
- Expected delta
- $0/yr ($0/mo · 0.0%)
ⓘ Screening estimate from a state-policy table — verify with the county assessor before closing.
Climate risk First Street
- Flood 1/10 Low FEMA zone X (unshaded) · 0% chance over 30 yrs
- Wildfire 7/10 Severe
- Heat 6/10 Major 7 d/yr ≥108°F today · 19 d/yr by 30 yrs out
- Wind 4/10 Moderate 10% chance of damaging wind over 30 yrs
- Air quality 2/10 Low 1 unhealthy d/yr today · 1 by 30 yrs out
Nearby sold comps map
Loading sold comps map…
Walkable amenities ~0.75 mi
Loading nearby amenities…
Taxation est. · year 1
- Rental income
- $14,698
- − Mortgage interest
- −$3,417
- − Property taxes
- −$864
- − Insurance
- −$305
- − Repairs & maintenance
- −$1,176
- − Management
- −$1,176
- − Depreciation
- −$1,775
- Taxable income
- $5,985
- Est. tax owed @ 24.0%
- −$1,437
- After-tax cash flow
- $5,167/yr
For passive investors: Depreciation is non-cash, so a rental often shows a tax loss while cash-flowing — sheltering income. Rental losses are passive: they offset passive income freely, and up to $25,000/yr can offset ordinary (W-2) income if you actively participate and your MAGI is under $100k (phasing out to $0 by $150k); unused losses carry forward. On sale, claimed depreciation is recaptured at up to 25%, and gains may owe capital-gains tax (a 1031 exchange can defer both). Figures are a year-1 estimate at your 24.0% rate — not tax advice; consult a CPA.
Schools (NCES district)
- District
- Sulphur
- NCES district ID
- 4029160
- Math proficiency
- 30% ▼ -11.00%
- Reading proficiency
- 32% ▼ -9.00%
- Median HH income
- $44,116
- Composite
- 26.47/100
- National rank
- #7214
- State rank
- #56 of 270 in OK
Livability — Sulphur
- Score
- 68/100
- State rank
- #60
- US rank
- #9249
Category grades
Schools grade is shown separately in the Schools card above.
Census & demographics
- Census place
- Sulphur, OK
- City population
- 8,504
- Population (ZIP)
- 8,504
Population outlook (Murray County) Hauer SSP2
- Today (2025)
- 14,976 people
- By 2030
- 15,487 · +3.4%
- By 2040
- 16,455 · +9.9%
- By 2050
- 17,308 · +15.6%
- By 2075
- 19,421 · +29.7%
- By 2100
- 20,335 · +35.8%
Race, ethnicity, and origin ACS 2023
- Neighborhood character
- Predominantly White (68%)
- Race & ethnicity
- White 68% Two or more races 14% Native American 12% Hispanic / Latino 8%
- Hispanic origin (detail)
- Mexican 6%
- Common ancestry
- Slovak 4% Portuguese 2% Italian 1%
- Foreign-born
- 2% · Canada
- Languages at home
- 97% English-only · Spanish 2%
Political lean MEDSL · Murray
- 2024 margin
- Solid R (+61.3) · D 18.4% · R 79.7% · Other 2.0%
- 2008→2024 swing
- -21.0pp toward R · 2008: -40.4pp · 2024: -61.3pp
- All cycles
- 2024: R+61.3 2020: R+58.6 2016: R+55.9 2012: R+40.1 2008: R+40.4
Not yet ingested
- Civics
- —
Market trends
- HPI YoY
- ▲ 5.90%
- Current HPI
- 331.8646
- Rent YoY
- —
- Metro
- —
- State GDP YoY
- ▲ 1.55%
- F500 in state
- 6
Industry mix (Fortune 500 HQ in OK)
| Industry | F500 HQs | Revenue |
|---|---|---|
| Energy | 3 | $48B |
|
||
Price history
-12.9% since first listed5 events — show timeline
- 2026-04-24 Pending — MLSOK
- 2026-04-07 Price Changed $61,000 MLSOK
- 2026-03-06 Listed $76,000 MLSOK
- 2009-11-25 Sold (Public Records) $72,000 Public Records
- 2003-09-11 Sold (Public Records) $70,000 Public Records
Cash-flow waterfall
monthlySold comps — $/sqft
last 12 mo · ≤1 miLoading sold comps…