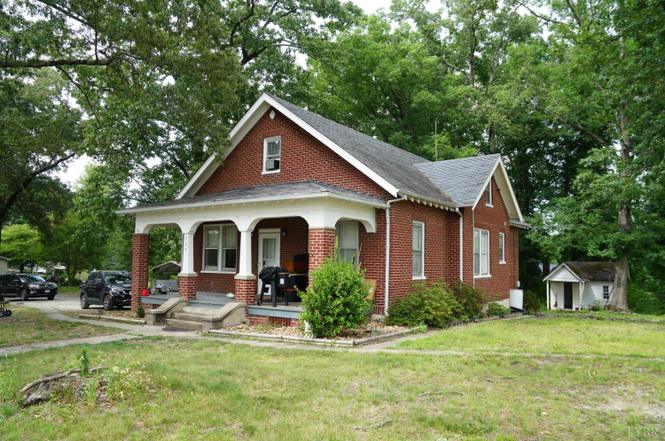
704 Lynchburg Ave · Brookneal, VA
Flood risk 1/10 · Minimal
- FEMA flood zone
- X (unshaded)
- Chance of flooding over 30 yrs
- 0.0%
- Est. flood insurance / yr
- $473 – $860
Fire risk 4/10 · Minor
- Est. fire insurance / yr
- $666 – $1,236
Heat risk 6/10 · Moderate
- Hot days now (above 104°F)
- 7 days/yr
- Hot days in 30 yrs
- 17 days/yr
Wind risk 3/10 · Minor
- Chance of severe wind over 30 yrs
- 6.0%
Air-quality risk 1/10 · Minimal
- Unhealthy air days now
- 0 days/yr
- Unhealthy air days in 30 yrs
- 0 days/yr
Risk factors via First Street. Map © Google.
Why this score? — see what drove the D+ grade
The composite is a weighted blend of 9 inputs, each scored 0–100. Each bar is that input's sub-score; the figure is the points it added to the 100-point composite (weight × sub-score).
- ARV discount +13.7/15.0
- Cash flow +8.4/30.0
- Appreciation +7.4/10.0
- Schools +5.2/10.0
- Livability +3.5/5.0
- Rent growth +2.5/5.0
- Condition / age +2.5/5.0
- DSCR +2.3/10.0
- 1% rule +1.3/10.0
$210,000
🖨 Deal sheet 📄 Offer letter ✓ Due diligence
Listing remarks MLS
Great solid brick 1 1/2 Story Home on a corner lot. 0.98 +/- acres. When you step into this home, you will find hardwood floors, 9' ceilings, spacious rooms, updated kitchen, 5 bedrooms (one without a closet), & fireplace with gas logs. HVAC system (2025). Slate roof. Property has a garage/workshop, 2-Car metal Carshed, & a playhouse. Located a short distance from the scenic Staunton River and Patrick Henry's Red Hill. Make your appointment today to see this nice home!
Key facts
- Solid brick
- Updated kitchen
- Hvac system
Tags
Property features AI
Finance
- Other: Residential property
Exterior
- Parking: Garage (1 space); Carport (2 spaces); Off-street parking
- Utilities: Public water; Public sewer
- Home design: Single-family residence; One story
- Construction: Brick construction; Slate roof
- Exterior features: Porch with screened area; Storm door(s); Lot is approximately 0.98 acres; R1 zoning
Interior
- Kitchen: Dishwasher; Electric range; Refrigerator
- Flooring: Hardwood; Tile; Vinyl; Wood
- Bathrooms: 1 full bathroom
- Heating & cooling: Heat pump heating; Window unit cooling
- Interior features: Pantry; Storm windows; Gas log fireplace
- Laundry & utility: Washer hookup in basement; Electric water heater; Partial basement
Neighborhood map
What this means for you Summary
Snapshot
- This is a 3-bed/1.0-bath single-family listed at $210k.
Deal economics
- At list price, monthly cash flow is $-188 ($-2k/yr) — negative.
- To cash-flow at today's rent, offer at most $177k (15.8% below list).
- To meet the 1% rule (rent ≥ 1% of price), the offer needs to be $133k (36.7% below list).
- Recommended offer: $133k (36.7% below list) — sets the bar for 1% rule.
- Cap rate 5.2% vs local median 3.9% in Brookneal — top-decile yield for the area; either an underpriced asset or a hidden risk that comps aren't pricing in. Stress-test before assuming the spread holds.
Location & tenants
- Location reads 69/100 on livability (#248 in VA) — a middle-class / working-renter tenant base. Strengths: crime A+, cost of living A+, housing A+; Watch: health & safety C-, amenities F, commute F.
- Campbell County Public School District (rural): math 55% / reading 68% proficiency, ranked #55 of 131 in VA (top 42%) — acceptable for families but not a draw, mixed tenant base, ~2y average lease.
- Zoned schools: Brookneal Elementary (math 52% / reading 62%, grade C+, #597 of 1,108 statewide, top 57%, 411 students, 74% FRL); William Campbell High (math 45% / reading 61%, grade C-, #291 of 319 statewide, top 92%, 397 students, 70% FRL) — zoned schools average 72% FRL vs 37% district-wide (35 pts higher); higher-poverty schools than district average — tighter screening recommended.
- Market conditions: 35 active listings in the ZIP; 315 units permitted in Campbell County in 2024 (51 in 5+ unit buildings).
Forward outlook
- In year one you build about $11k of equity ($1k loan paydown + $10k appreciation (4.8% local appreciation)).
- Campbell County population projected to shrink 6% by 2050 — rents likely to lag national; underwrite the cash flow, not the appreciation.
- By year 4, paydown + projected appreciation supports a ~$39k cash-out refi (75% LTV) — recoverable capital for the next deal without selling this one.
Negotiation context
- Only 9 days on market — expect competitive offers; lowballing is unlikely to land.
- 3 sale attempts since 2y ago with the ask held roughly flat each time — persistent listings suggest the price (not the market) is what's stuck; bring a comps-based counter.
Risks & watch-outs
- Watch-outs: built in 1936 — expect roof / HVAC / electrical / plumbing capex.
- Climate carrying-cost: extreme-heat days projected 7→17/yr by 2055 (HVAC capex compounding) — expect insurance premiums to compound above CPI over the hold.
Questions for the listing agent
- What do current leases actually rent for vs. the listed asking? Can we see a recent rent roll and the last 12 months of T-12 income?
- Built in 1936 — when were the roof, HVAC, electrical panel, plumbing, and water heater last replaced?
- Is there a deadline driving the sale (1031 exchange, divorce, estate, relocation)? That informs how much negotiation room exists.
- Schools are B-rated — typically a magnet for longer-tenancy family renters. What's the average tenant stay here, and is there a school-zone premium baked into asking?
- The area grade is low — what's the realistic commute time and amenity access for the typical tenant pool here? Any planned neighborhood developments (good or bad) we should know about?
- What's the average days-on-market for RENTAL listings here right now (not sales)? A rising rental-DOM trend means longer vacancies and softer asking-rent achievability than the comps imply.
- What's the recent tenant-quality profile in this submarket — average credit score on applications, eviction rate, late-payment / NSF rate, and stable-employment percentage? A property-management company in the area should have these aggregated.
- How much new for-sale + rental construction is in the pipeline within 1–3 miles? Heavy new supply typically softens prices + rents 12–24 months out; constrained supply supports both.
Investment metrics
- 1% rule
- 0.63% ✗
- Cap rate
- 5.22%
- Cash-on-cash
- -3.83%
- DSCR
- 0.83
- GRM
- 13.2
CMA / ARV
- ARV (on-the-fly)
- $243,600
- Comps found
- 3
Show comp detail 3 sales within ~0.75 mi
| Address | Dist | Beds/Ba | Sqft | Sold | Price | $/sf | Match |
|---|---|---|---|---|---|---|---|
| 209 Earl St St | 0.20mi | 4/2.0 (+1) | 2,552 (+5%) | 14mo | $254,500 | $100 | 62 |
| 308 Virginia Ave | 0.41mi | 4/2.0 (+1) | 2,353 (-3%) | 18mo | $205,000 | $87 | 51 |
| 136 Clark ST St | 0.56mi | 3/3.0 | 2,335 (-4%) | 21mo | $306,900 | $131 | 42 |
Match score weights: distance 35% · size 25% · config 20% · recency 20%. Top-matched comps best support the ARV.
Projected returns pro-forma
4.77% appreciation · 3.0% rent growth · sell at horizon
- IRR
- 9.0%
- Equity multiple
- 1.57×
- Total profit
- $33,547
- Equity at exit
- $116,040
- IRR
- 10.7%
- Equity multiple
- 2.92×
- Total profit
- $112,933
- Equity at exit
- $197,860
Cash invested: $58,800 (down + closing). Projections, not guarantees.
Landlord ↔ Tenant lean methodology
- Overall (STATE)
- 55 Moderately Landlord-Leaning
- State Virginia
- 55 Moderately Landlord-Leaning · D+2
- County
- — inherits STATE
- City
- — inherits STATE
ZIP-level market 24528
- Home prices YoY
- 2.7%
- Active inventory
- 35
- Price-to-rent
- 13.2×
Monthly cashflow live
- Estimated rent
- $1,330 medium interval (Pro) →
- Mortgage (P&I)
- −$1,101
- Tax from tax record
- −$50 /mo · $595/yr
- Insurance
- −$88
- HOA
- −$0
- Vacancy / Maint / Mgmt
- −$279
- Net cashflow
- $-188
Break-even live
UW: 25.0% down · 7.5% · 30yr · 1.5% tax · 5.0% vac · 8.0% maint · 8.0% mgmt
Financing live
Cash to close
- Down payment
- $52,500
- Closing costs
- $6,300
- Reserves months
- —
- Total cash needed
- —
Loan-product check · same deal, 3 products live
Conventional
25% down · 7.5% · 30yr
- Down + closing
- —
- Monthly P&I
- —
- Monthly cashflow
- —
- DSCR
- —
- Eligible?
- —
Personal DTI + credit; lowest rate.
DSCR
20% down · 8.5% · 30yr
- Down + closing
- —
- Monthly P&I
- —
- Monthly cashflow
- —
- DSCR
- —
- Eligible?
- —
No personal income docs; deal must DSCR.
Hard money
10% down · 12.0% · 12mo
- Down + closing
- —
- Monthly P&I
- —
- Monthly cashflow
- —
- DSCR
- —
- Eligible?
- —
Short-term bridge; refi at stabilization.
Listing history 8 events
-
2026-06-19days on market $210,000 Active 9 DOM
-
2026-06-18days on market $210,000 Active 8 DOM
-
2026-06-17days on market $210,000 Active 7 DOM
-
2026-06-16days on market $210,000 Active 6 DOM
-
2026-06-15days on market $210,000 Active 5 DOM
-
2026-06-14days on market $210,000 Active 3 DOM
-
2026-06-13remarks 475-char remark
-
2026-06-13$210,000 Active 2 DOM
ⓘ Source: listings_history table (triggers on properties + properties_extension) + one-shot
backfill from property_details.listing_events for pre-trigger history.
Tax reassessment forecast VA · Resets to sale price
- Current annual tax
- $595 · $50/mo
- Projected year-2 tax
- $1,722 · $144/mo
- Expected delta
- +$1,127/yr (+$94/mo · 189.5%)
ⓘ Screening estimate from a state-policy table — verify with the county assessor before closing.
Climate risk First Street
- Flood 1/10 Low FEMA zone X (unshaded) · 0% chance over 30 yrs
- Wildfire 4/10 Moderate
- Heat 6/10 Major 7 d/yr ≥104°F today · 17 d/yr by 30 yrs out
- Wind 3/10 Moderate 6% chance of damaging wind over 30 yrs
- Air quality 1/10 Low 0 unhealthy d/yr today · 0 by 30 yrs out
Nearby sold comps map
Loading sold comps map…
Walkable amenities ~0.75 mi
Loading nearby amenities…
Taxation est. · year 1
- Rental income
- $15,958
- − Mortgage interest
- −$11,763
- − Property taxes
- −$595
- − Insurance
- −$1,050
- − Repairs & maintenance
- −$1,277
- − Management
- −$1,277
- − Depreciation
- −$6,109
- Taxable loss
- −$6,112
- Est. tax savings @ 24.0%
- +$1,467
- After-tax cash flow
- $-786/yr
For passive investors: Depreciation is non-cash, so a rental often shows a tax loss while cash-flowing — sheltering income. Rental losses are passive: they offset passive income freely, and up to $25,000/yr can offset ordinary (W-2) income if you actively participate and your MAGI is under $100k (phasing out to $0 by $150k); unused losses carry forward. On sale, claimed depreciation is recaptured at up to 25%, and gains may owe capital-gains tax (a 1031 exchange can defer both). Figures are a year-1 estimate at your 24.0% rate — not tax advice; consult a CPA.
Schools (NCES district)
- District
- Campbell County Public School District
- NCES district ID
- 5100600
- Math proficiency
- 55% ▼ -29.00%
- Reading proficiency
- 68% ▼ -11.00%
- Median HH income
- $45,915
- Composite
- 51.88/100
- National rank
- #1656
- State rank
- #55 of 131 in VA
Livability — Brookneal
- Score
- 69/100
- State rank
- #248
- US rank
- #8283
Category grades
Schools grade is shown separately in the Schools card above.
Census & demographics
- Census place
- Brookneal, VA
- Population (ZIP)
- 3,793
Population outlook (Campbell County) Hauer SSP2
- Today (2025)
- 56,306 people
- By 2030
- 56,366 · +0.1%
- By 2040
- 55,406 · -1.6%
- By 2050
- 53,011 · -5.9%
- By 2075
- 45,932 · -18.4%
- By 2100
- 36,029 · -36.0%
Race, ethnicity, and origin ACS 2023
- Neighborhood character
- Predominantly White (70%)
- Race & ethnicity
- White 70% Black 24% Two or more races 5% Hispanic / Latino 1%
- Common ancestry
- Serbian 3% Slovak 2% Romanian 1%
- Foreign-born
- 1% · Canada
- Languages at home
- 98% English-only · Spanish 2%
Political lean MEDSL · Campbell
- 2024 margin
- Solid R (+48.6) · D 25.3% · R 73.9%
- 2008→2024 swing
- -12.3pp toward R · 2008: -36.2pp · 2024: -48.6pp
- All cycles
- 2024: R+48.6 2020: R+44.1 2016: R+47.2 2012: R+39.4 2008: R+36.2
Not yet ingested
- Civics
- —
Market trends
- HPI YoY
- ▲ 4.77%
- Current HPI
- 181.6064
- Rent YoY
- —
- Metro
- —
- State GDP YoY
- ▲ 2.40%
- F500 in state
- 50
Industry mix (Fortune 500 HQ in VA)
| Industry | F500 HQs | Revenue |
|---|---|---|
| Aerospace / Defense | 4 | $236B |
|
||
| Technology / Defense | 3 | $32B |
|
||
| Financial Services | 2 | $176B |
|
||
| Utilities | 2 | $27B |
|
||
| Insurance | 2 | $25B |
|
||
| Technology | 2 | $15B |
|
||
Price history
+0.0% since first listed8 events — show timeline
- 2026-06-10 Listed $210,000 SPLLAR
- 2026-06-10 Listed $210,000 LMLS
- 2024-12-03 Sold (Public Records) $205,000 Public Records
- 2024-12-03 Sold (MLS) $205,000 LMLS
- 2024-10-22 Pending — LMLS
- 2024-08-27 Pending — LMLS
- 2024-08-23 Price Changed $199,900 LMLS
- 2024-08-04 Listed $210,000 LMLS
Property tax history
+6.9%/yrLatest (2024): $595 · +0.0% YoY. Source: county tax records.
Cash-flow waterfall
monthlySold comps — $/sqft
last 12 mo · ≤1 miLoading sold comps…