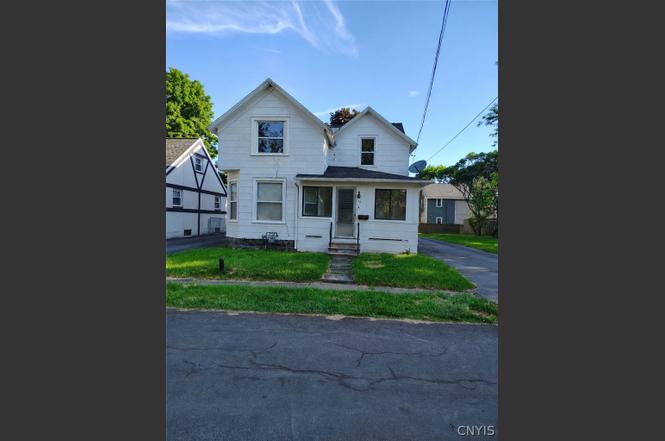
142 Warrington Road West · Syracuse, NY
Flood risk 1/10 · Minimal
- FEMA flood zone
- X (unshaded)
- Chance of flooding over 30 yrs
- 0.0%
- Est. flood insurance / yr
- $473 – $860
Fire risk 1/10 · Minimal
- Est. fire insurance / yr
- $691 – $1,283
Heat risk 3/10 · Minor
- Hot days now (above 95°F)
- 7 days/yr
- Hot days in 30 yrs
- 16 days/yr
Wind risk 1/10 · Minimal
- Chance of severe wind over 30 yrs
- 0.0%
Air-quality risk 2/10 · Minimal
- Unhealthy air days now
- 0 days/yr
- Unhealthy air days in 30 yrs
- 1 days/yr
Risk factors via First Street. Map © Google.
Why this score? — see what drove the C- grade
The composite is a weighted blend of 9 inputs, each scored 0–100. Each bar is that input's sub-score; the figure is the points it added to the 100-point composite (weight × sub-score).
- Cash flow +20.4/30.0
- Appreciation +10.0/10.0
- DSCR +6.5/10.0
- 1% rule +4.4/10.0
- Livability +3.9/5.0
- Rent growth +2.5/5.0
- Condition / age +2.5/5.0
- Schools +1.8/10.0
- ARV discount +1.6/15.0
$220,000
🖨 Deal sheet 📄 Offer letter ✓ Due diligence
Listing remarks MLS
Four bedroom home with convenient access to shopping, schools and parks. The home features large rooms and a detached garage.
Key facts
- Large yard
- Updated kitchen
- Deep driveway
Tags
Property features AI
Exterior
- Parking: No garage
- Utilities: Public water connected; Sewer connected
- Home design: 2-story property; Existing construction
- Construction: Composite siding; Stone foundation
- Exterior features: Blacktop driveway; Enclosed porch; Porch; Rectangular lot; Road frontage on a main thoroughfare; Lot dimensions approximately 100 x 100
Interior
- Kitchen: Gas oven; Gas range; Microwave; Refrigerator
- Bedrooms: Total of 9 rooms (bedroom count not specified)
- Flooring: Laminate; Varies
- Bathrooms: 1 full bathroom (main level)
- Heating & cooling: Gas heating; Baseboard heating; Forced air
- Interior features: Eat-in kitchen; Enclosed porch; Porch
- Laundry & utility: Main-level laundry
Neighborhood map
What this means for you Summary
Snapshot
- This is a 4-bed/1.0-bath single-family listed at $220k.
Deal economics
- At list price, monthly cash flow is $284 ($3k/yr) — positive.
- The deal already cash-flows at list — no discount required.
- To meet the 1% rule (rent ≥ 1% of price), the offer needs to be $207k (5.8% below list).
- Recommended offer: $207k (5.8% below list) — sets the bar for 1% rule.
Location & tenants
- Location reads 77/100 on livability (#187 in NY, #2,869 nationally) — a middle-class / working-renter tenant base. Strengths: amenities A+, commute A+, cost of living A+; Watch: schools D+, crime F, employment D-.
- Syracuse City School District (urban): math 18% / reading 26% proficiency, ranked #590 of 590 in NY (top 100%) — low school quality limits family demand, transient renter base, plan for 1-2y turnover; 74% free/reduced lunch — lower-income household profile, screen leases tightly.
- Market conditions: 67 active listings in the ZIP; 2 comparable units currently listed for rent nearby; 616 units permitted in Onondaga County in 2024 (256 in 5+ unit buildings).
Forward outlook
- In year one you build about $24k of equity ($2k loan paydown + $22k appreciation (10.0% local appreciation)).
- Onondaga County population projected to shrink 9% by 2050 — rents likely to lag national; underwrite the cash flow, not the appreciation.
- At projected returns (10.0% appreciation + 3.0% rent growth), your $62k cash investment doubles in ~3 years — after that, you're playing with house money.
- By year 2, paydown + projected appreciation supports a ~$38k cash-out refi (75% LTV) — recoverable capital for the next deal without selling this one.
Negotiation context
- Only 3 days on market — expect competitive offers; lowballing is unlikely to land.
- 2 sale attempts since 11y ago with the ask held roughly flat each time — persistent listings suggest the price (not the market) is what's stuck; bring a comps-based counter.
- Current owner paid $120k; list at $220k implies a 83% gain — meaningful room to come down on a strong offer.
Risks & watch-outs
- Watch-outs: built in 1890 — expect roof / HVAC / electrical / plumbing capex.
Questions for the listing agent
- Built in 1890 — when were the roof, HVAC, electrical panel, plumbing, and water heater last replaced?
- Is there a deadline driving the sale (1031 exchange, divorce, estate, relocation)? That informs how much negotiation room exists.
- Schools are D-rated, which usually means shorter tenancies and higher turnover. Who's the typical renter profile here, and what's been the actual vacancy rate?
- Crime grade is F in this area — have there been break-ins, vandalism, or insurance claims at this property in the last 3 years? What carrier currently insures it and at what premium?
- What's the average days-on-market for RENTAL listings here right now (not sales)? A rising rental-DOM trend means longer vacancies and softer asking-rent achievability than the comps imply.
- What's the recent tenant-quality profile in this submarket — average credit score on applications, eviction rate, late-payment / NSF rate, and stable-employment percentage? A property-management company in the area should have these aggregated.
- How much new for-sale + rental construction is in the pipeline within 1–3 miles? Heavy new supply typically softens prices + rents 12–24 months out; constrained supply supports both.
Investment metrics
- 1% rule
- 0.94% ✗
- Cap rate
- 7.84%
- Cash-on-cash
- 5.54%
- DSCR
- 1.25
- GRM
- 8.8
CMA / ARV
- ARV (on-the-fly)
- $194,590
- Comps found
- 12
Show comp detail 12 sales within ~0.75 mi
| Address | Dist | Beds/Ba | Sqft | Sold | Price | $/sf | Match |
|---|---|---|---|---|---|---|---|
| 221 Weymouth Rd | 0.33mi | 3/1.5 (-1) | 1,313 (-2%) | 3mo | $203,000 | $155 | 72 |
| 305 Academy Pl | 0.30mi | 3/2.0 (-1) | 1,336 (-0%) | 10mo | $225,000 | $168 | 68 |
| 154 Seeley Ave | 0.53mi | 3/1.0 (-1) | 1,321 (-2%) | 3mo | $70,000 | $53 | 66 |
| 209 Richfield Ave | 0.41mi | 4/2.0 | 1,462 (+9%) | 1mo | $250,000 | $171 | 61 |
| 197 Merritt Ave | 0.64mi | 4/1.0 | 1,320 (-2%) | 9mo | $92,000 | $70 | 60 |
| 127 Roney Rd | 0.59mi | 3/1.0 (-1) | 1,344 (+0%) | 9mo | $149,000 | $111 | 60 |
| 136 Weymouth Rd | 0.20mi | 3/1.5 (-1) | 1,508 (+12%) | 6mo | $230,000 | $153 | 58 |
| 127 Thurlow Dr | 0.45mi | 3/2.0 (-1) | 1,256 (-6%) | 7mo | $190,800 | $152 | 53 |
| 130 Cortland Pl | 0.69mi | 3/2.5 (-1) | 1,344 (+0%) | 6mo | $194,250 | $145 | 52 |
| 120 Maplewood Ave | 0.47mi | 3/1.0 (-1) | 1,221 (-9%) | 8mo | $95,000 | $78 | 51 |
| 206 Brampton Rd | 0.33mi | 3/1.5 (-1) | 1,532 (+14%) | 6mo | $177,160 | $116 | 49 |
| 3633 Midland Ave | 0.69mi | 3/1.5 (-1) | 1,536 (+14%) | 2mo | $190,000 | $124 | 35 |
Match score weights: distance 35% · size 25% · config 20% · recency 20%. Top-matched comps best support the ARV.
Projected returns pro-forma
10.0% appreciation · 3.0% rent growth · sell at horizon
- IRR
- 28.3%
- Equity multiple
- 3.24×
- Total profit
- $137,845
- Equity at exit
- $198,193
- IRR
- 24.6%
- Equity multiple
- 7.36×
- Total profit
- $391,557
- Equity at exit
- $427,412
Cash invested: $61,600 (down + closing). Projections, not guarantees.
Landlord ↔ Tenant lean methodology
- Overall (STATE)
- 15 Strongly Tenant-Friendly
- State New York
- 15 Strongly Tenant-Friendly · D+10
- County
- — inherits STATE
- City
- — inherits STATE
ZIP-level market 13205
- Home prices YoY
- 3.0%
- Active inventory
- 67
- Price-to-rent
- 8.8×
Monthly cashflow live
- Estimated rent
- $2,073 medium interval (Pro) →
- Mortgage (P&I)
- −$1,154
- Tax from tax record
- −$108 /mo · $1,300/yr
- Insurance
- −$92
- HOA
- −$0
- Vacancy / Maint / Mgmt
- −$435
- Net cashflow
- $284
Break-even live
UW: 25.0% down · 7.5% · 30yr · 1.5% tax · 5.0% vac · 8.0% maint · 8.0% mgmt
Financing live
Cash to close
- Down payment
- $55,000
- Closing costs
- $6,600
- Reserves months
- —
- Total cash needed
- —
Loan-product check · same deal, 3 products live
Conventional
25% down · 7.5% · 30yr
- Down + closing
- —
- Monthly P&I
- —
- Monthly cashflow
- —
- DSCR
- —
- Eligible?
- —
Personal DTI + credit; lowest rate.
DSCR
20% down · 8.5% · 30yr
- Down + closing
- —
- Monthly P&I
- —
- Monthly cashflow
- —
- DSCR
- —
- Eligible?
- —
No personal income docs; deal must DSCR.
Hard money
10% down · 12.0% · 12mo
- Down + closing
- —
- Monthly P&I
- —
- Monthly cashflow
- —
- DSCR
- —
- Eligible?
- —
Short-term bridge; refi at stabilization.
Rent comps 2 comps
| Address | Beds | Baths | Sqft | Rent | $/sqft | DOM | Units | Dist |
|---|---|---|---|---|---|---|---|---|
| 154 Seeley Ave Syracuse, NY | 4.0 | 1.0 | 1312 | $2,100 | $1.60 | 13d | 1 | 0.50mi |
| 147 E Matson Ave Syracuse, NY | 3.0 | 2.5 | 1421 | $2,000 | $1.41 | 21d | 1 | 1.31mi |
Listing history 4 events
-
2026-06-18days on market $220,000 Active 3 DOM
-
2026-06-17days on market $220,000 Active 2 DOM
-
2026-06-15remarks 699-char remark
-
2026-06-15$220,000 Active 1 DOM
ⓘ Source: listings_history table (triggers on properties + properties_extension) + one-shot
backfill from property_details.listing_events for pre-trigger history.
Tax reassessment forecast NY · Partial reset (capped growth)
- Current annual tax
- $1,300 · $108/mo
- Projected year-2 tax
- $2,509 · $209/mo
- Expected delta
- +$1,209/yr (+$101/mo · 93.0%)
ⓘ Screening estimate from a state-policy table — verify with the county assessor before closing.
Climate risk First Street
- Flood 1/10 Low FEMA zone X (unshaded) · 0% chance over 30 yrs
- Wildfire 1/10 Low
- Heat 3/10 Moderate 7 d/yr ≥95°F today · 16 d/yr by 30 yrs out
- Wind 1/10 Low 0% chance of damaging wind over 30 yrs
- Air quality 2/10 Low 0 unhealthy d/yr today · 1 by 30 yrs out
Nearby sold comps map
Loading sold comps map…
Walkable amenities ~0.75 mi
Loading nearby amenities…
Taxation est. · year 1
- Rental income
- $24,879
- − Mortgage interest
- −$12,323
- − Property taxes
- −$1,300
- − Insurance
- −$1,100
- − Repairs & maintenance
- −$1,990
- − Management
- −$1,990
- − Depreciation
- −$6,400
- Taxable loss
- −$225
- Est. tax savings @ 24.0%
- +$54
- After-tax cash flow
- $3,464/yr
For passive investors: Depreciation is non-cash, so a rental often shows a tax loss while cash-flowing — sheltering income. Rental losses are passive: they offset passive income freely, and up to $25,000/yr can offset ordinary (W-2) income if you actively participate and your MAGI is under $100k (phasing out to $0 by $150k); unused losses carry forward. On sale, claimed depreciation is recaptured at up to 25%, and gains may owe capital-gains tax (a 1031 exchange can defer both). Figures are a year-1 estimate at your 24.0% rate — not tax advice; consult a CPA.
Schools (NCES district)
- District
- Syracuse City School District
- NCES district ID
- 3628590
- Math proficiency
- 18% ▼ -5.00%
- Reading proficiency
- 26% ▬ 0.00%
- Median HH income
- $32,097
- Composite
- 17.83/100
- National rank
- #9007
- State rank
- #590 of 590 in NY
Livability — Syracuse
- Score
- 77/100
- State rank
- #187
- US rank
- #2869
Category grades
Schools grade is shown separately in the Schools card above.
Census & demographics
- Census place
- Syracuse, NY
- City population
- 152,627
- Population (ZIP)
- 18,562
Population outlook (Onondaga County) Hauer SSP2
- Today (2025)
- 467,894 people
- By 2030
- 463,381 · -1.0%
- By 2040
- 447,697 · -4.3%
- By 2050
- 426,399 · -8.9%
- By 2075
- 373,661 · -20.1%
- By 2100
- 307,967 · -34.2%
Race, ethnicity, and origin ACS 2023
- Neighborhood character
- Diverse neighborhood (Simpson 0.67)
- Race & ethnicity
- Black 44% White 37% Two or more races 10% Hispanic / Latino 6% Asian 3%
- Hispanic origin (detail)
- Puerto Rican 4%
- Common ancestry
- Romanian 2% Italian 2% Swiss 1%
- Foreign-born
- 9% · Canada, China, Vietnam
- Languages at home
- 87% English-only · Spanish 5% Arabic 1% Other Indo-European 1%
Political lean MEDSL · Onondaga
- 2024 margin
- D (+17.3) · D 58.6% · R 41.4%
- 2008→2024 swing
- -3.0pp toward R · 2008: 20.3pp · 2024: 17.3pp
- All cycles
- 2024: D+17.3 2020: D+20.6 2016: D+12.8 2012: D+21.1 2008: D+20.3
Not yet ingested
- Civics
- —
Market trends
- HPI YoY
- ▲ 10.12%
- Current HPI
- 345.8854
- Rent YoY
- —
- Metro
- —
- State GDP YoY
- ▲ 2.60%
- F500 in state
- 92
Industry mix (Fortune 500 HQ in NY)
| Industry | F500 HQs | Revenue |
|---|---|---|
| Financial Services | 10 | $950B |
|
||
| Consumer Goods | 9 | $162B |
|
||
| Insurance | 4 | $225B |
|
||
| Telecommunications | 2 | $144B |
|
||
| Pharmaceuticals | 2 | $112B |
|
||
| Media / Entertainment | 2 | $69B |
|
||
Price history
+411.6% since first listed8 events — show timeline
- 2026-06-15 Listed $220,000 CNYIS
- 2026-05-01 Sold (Public Records) $120,000 Public Records
- 2016-11-14 Sold (Public Records) $40,000 Public Records
- 2016-06-28 Sold (MLS) $13,000 CNYIS
- 2016-01-29 Pending — CNYIS
- 2016-01-25 Price Changed $15,000 CNYIS
- 2015-11-24 Price Changed $30,000 CNYIS
- 2015-10-06 Listed $43,000 CNYIS
Property tax history
+0.4%/yrLatest (2025): $1,300 · -0.9% YoY. Source: county tax records.
Cash-flow waterfall
monthlySold comps — $/sqft
last 12 mo · ≤1 miLoading sold comps…