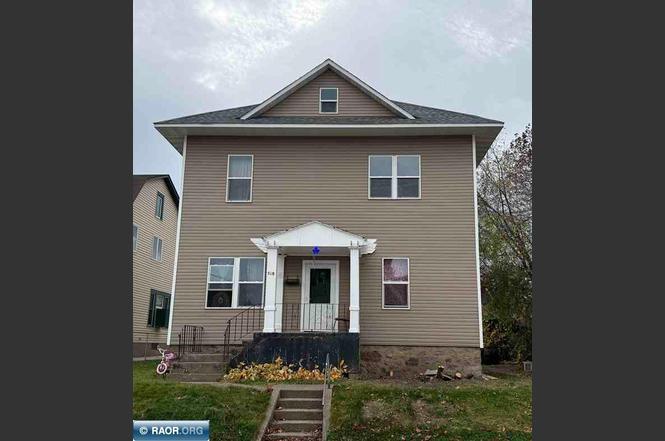
518 8 1/2 St S · Virginia, MN
Flood risk 1/10 · Minimal
- FEMA flood zone
- —
- Chance of flooding over 30 yrs
- 0.0%
- Est. flood insurance / yr
- —
Fire risk 4/10 · Minor
- Est. fire insurance / yr
- $888 – $1,650
Heat risk 1/10 · Minimal
- Hot days now (above 91°F)
- 7 days/yr
- Hot days in 30 yrs
- 12 days/yr
Wind risk 1/10 · Minimal
- Chance of severe wind over 30 yrs
- —
Air-quality risk 2/10 · Minimal
- Unhealthy air days now
- 2 days/yr
- Unhealthy air days in 30 yrs
- 2 days/yr
Risk factors via First Street. Map © Google.
Why this score? — see what drove the C grade
The composite is a weighted blend of 9 inputs, each scored 0–100. Each bar is that input's sub-score; the figure is the points it added to the 100-point composite (weight × sub-score).
- Cash flow +23.5/30.0
- DSCR +7.5/10.0
- ARV discount +7.5/15.0
- 1% rule +5.5/10.0
- Schools +5.0/10.0
- Livability +3.2/5.0
- Rent growth +2.5/5.0
- Condition / age +2.5/5.0
- Appreciation +0.0/10.0
$160,000
🖨 Deal sheet 📄 Offer letter ✓ Due diligence
Listing remarks
This duplex, situated in the southside of Virginia, is a must-see. It has undergone a complete steam conversion without any conversion loan to be assumed by the buyer. Other recent upgrades include a new roof and fascia, new siding, and new windows. Come and check out this fantastic income property and all it has to offer. The rental units are licensed with the city of Virginia.
Key facts
- New siding
- Income property
- New roof
Tags
Property features AI
Exterior
- Parking: On-street parking
- Utilities: Public water; Public sewer
- Home design: Residential income property (duplex)
- Construction: Frame construction with vinyl siding; Asphalt shingle roof
- Exterior features: Irregular lot; Lot dimensions approximately 115 x 57
Interior
- Heating & cooling: Natural gas heating; Hot water heating
- Interior features: Full basement
Neighborhood map
What this means for you Summary
Snapshot
- This is a 4-bed/2.0-bath other listed at $160k.
Deal economics
- At list price, monthly cash flow is $298 ($4k/yr) — positive.
- The deal already cash-flows at list — no discount required.
- Meets the 1% rule at list price ($2k rent vs $160k).
- Recommended offer: $141k (12.0% below list) — sets the bar for market timing.
Location & tenants
- Location reads 63/100 on livability (#664 in MN) — a middle-class / working-renter tenant base. Strengths: cost of living A+, housing A+; Watch: schools C-, crime D, health & safety D.
- Market conditions: 64 active listings in the ZIP; 639 units permitted in St. Louis County in 2024 (338 in 5+ unit buildings).
- This rent runs 37% of the median local income ($54k/yr) — at the standard rent-burdened threshold; future hikes will face affordability resistance.
Forward outlook
- Local home prices are declining (-3.0%/yr); year-one equity from $1k of loan paydown is wiped out by about $5k of value loss. Plan a longer hold.
Negotiation context
- It's been on market 161 days — a 12% lower offer ($141k) is reasonable based on typical stale-listing flexibility.
- 3 sale attempts with the ask held roughly flat each time — persistent listings suggest the price (not the market) is what's stuck; bring a comps-based counter.
- Current owner paid $45k; list at $160k implies a 256% gain — meaningful room to come down on a strong offer.
Risks & watch-outs
- Watch-outs: built in 1912 — expect roof / HVAC / electrical / plumbing capex.
Questions for the listing agent
- It's been on market 161 days. Have you received any prior offers? Is the seller open to a 12% concession, seller financing, or rate buy-down credit?
- Built in 1912 — when were the roof, HVAC, electrical panel, plumbing, and water heater last replaced?
- Why hasn't it sold? Are there any deal-killer items the seller is aware of (foundation, flood, title, zoning, code violations)?
- Is there a deadline driving the sale (1031 exchange, divorce, estate, relocation)? That informs how much negotiation room exists.
- Crime grade is D in this area — have there been break-ins, vandalism, or insurance claims at this property in the last 3 years? What carrier currently insures it and at what premium?
- What's the average days-on-market for RENTAL listings here right now (not sales)? A rising rental-DOM trend means longer vacancies and softer asking-rent achievability than the comps imply.
- What's the recent tenant-quality profile in this submarket — average credit score on applications, eviction rate, late-payment / NSF rate, and stable-employment percentage? A property-management company in the area should have these aggregated.
- How much new for-sale + rental construction is in the pipeline within 1–3 miles? Heavy new supply typically softens prices + rents 12–24 months out; constrained supply supports both.
Investment metrics
- 1% rule
- 1.05% ✓
- Cap rate
- 8.53%
- Cash-on-cash
- 7.98%
- DSCR
- 1.35
- GRM
- 8.0
CMA / ARV
No comps found within radius.
Projected returns pro-forma
-3.0% appreciation · 3.0% rent growth · sell at horizon
- IRR
- -4.2%
- Equity multiple
- 0.84×
- Total profit
- $-6,985
- Equity at exit
- $23,857
- IRR
- 5.5%
- Equity multiple
- 1.41×
- Total profit
- $18,242
- Equity at exit
- $13,834
Cash invested: $44,800 (down + closing). Projections, not guarantees.
Landlord ↔ Tenant lean methodology
- Overall (STATE)
- 46 Balanced
- State Minnesota
- 46 Balanced · D+2
- County
- — inherits STATE
- City
- — inherits STATE
ZIP-level market 55792
- Home prices YoY
- -26.5%
- Active inventory
- 64
- Price-to-rent
- 8.0×
Monthly cashflow live
- Estimated rent
- $1,675 medium interval (Pro) →
- Mortgage (P&I)
- −$839
- Tax from tax record
- −$120 /mo · $1,440/yr
- Insurance
- −$67
- HOA
- −$0
- Vacancy / Maint / Mgmt
- −$352
- Net cashflow
- $298
Break-even live
UW: 25.0% down · 7.5% · 30yr · 1.5% tax · 5.0% vac · 8.0% maint · 8.0% mgmt
Financing live
Cash to close
- Down payment
- $40,000
- Closing costs
- $4,800
- Reserves months
- —
- Total cash needed
- —
Loan-product check · same deal, 3 products live
Conventional
25% down · 7.5% · 30yr
- Down + closing
- —
- Monthly P&I
- —
- Monthly cashflow
- —
- DSCR
- —
- Eligible?
- —
Personal DTI + credit; lowest rate.
DSCR
20% down · 8.5% · 30yr
- Down + closing
- —
- Monthly P&I
- —
- Monthly cashflow
- —
- DSCR
- —
- Eligible?
- —
No personal income docs; deal must DSCR.
Hard money
10% down · 12.0% · 12mo
- Down + closing
- —
- Monthly P&I
- —
- Monthly cashflow
- —
- DSCR
- —
- Eligible?
- —
Short-term bridge; refi at stabilization.
Listing history 27 events
-
2026-06-19days on market $160,000 Active 161 DOM
-
2026-06-18days on market $160,000 Active 160 DOM
-
2026-06-17days on market $160,000 Active 159 DOM
-
2026-06-16days on market $160,000 Active 158 DOM
-
2026-06-15days on market $160,000 Active 157 DOM
-
2026-06-14days on market $160,000 Active 155 DOM
-
2026-06-13days on market $160,000 Active 154 DOM
-
2026-06-10days on market $160,000 Active 152 DOM
-
2026-06-09days on market $160,000 Active 151 DOM
-
2026-06-08days on market $160,000 Active 150 DOM
-
2026-06-07days on market $160,000 Active 149 DOM
-
2026-06-05days on market $160,000 Active 146 DOM
-
2026-06-03days on market $160,000 Active 145 DOM
-
2026-06-02days on market $160,000 Active 144 DOM
-
2026-06-01days on market $160,000 Active 143 DOM
-
2026-05-31days on market $160,000 Active 142 DOM
-
2026-05-30days on market $160,000 Active 141 DOM
-
2026-04-29status Active
-
2026-04-28historical
-
2026-03-26status Active
-
2026-01-06historical
-
2025-10-22$160,000 Active
-
2006-03-02soldstatus $45,000
-
2004-09-17soldstatus $38,622
-
2003-02-19soldstatus $28,000
-
2003-01-21soldstatus $45,000
-
2000-04-12soldstatus $28,000
ⓘ Source: listings_history table (triggers on properties + properties_extension) + one-shot
backfill from property_details.listing_events for pre-trigger history.
Tax reassessment forecast MN · Partial reset (capped growth)
- Current annual tax
- $1,440 · $120/mo
- Projected year-2 tax
- $1,616 · $135/mo
- Expected delta
- +$176/yr (+$15/mo · 12.2%)
ⓘ Screening estimate from a state-policy table — verify with the county assessor before closing.
Climate risk First Street
- Flood 1/10 Low 0% chance over 30 yrs
- Wildfire 4/10 Moderate
- Heat 1/10 Low 7 d/yr ≥91°F today · 12 d/yr by 30 yrs out
- Wind 1/10 Low
- Air quality 2/10 Low 2 unhealthy d/yr today · 2 by 30 yrs out
Nearby sold comps map
Loading sold comps map…
Walkable amenities ~0.75 mi
Loading nearby amenities…
Taxation est. · year 1
- Rental income
- $20,104
- − Mortgage interest
- −$8,962
- − Property taxes
- −$1,440
- − Insurance
- −$800
- − Repairs & maintenance
- −$1,608
- − Management
- −$1,608
- − Depreciation
- −$4,655
- Taxable income
- $1,030
- Est. tax owed @ 24.0%
- −$247
- After-tax cash flow
- $3,326/yr
For passive investors: Depreciation is non-cash, so a rental often shows a tax loss while cash-flowing — sheltering income. Rental losses are passive: they offset passive income freely, and up to $25,000/yr can offset ordinary (W-2) income if you actively participate and your MAGI is under $100k (phasing out to $0 by $150k); unused losses carry forward. On sale, claimed depreciation is recaptured at up to 25%, and gains may owe capital-gains tax (a 1031 exchange can defer both). Figures are a year-1 estimate at your 24.0% rate — not tax advice; consult a CPA.
Schools (NCES district)
No district data.
Livability — Virginia
- Score
- 63/100
- State rank
- #664
- US rank
- #15991
Category grades
Schools grade is shown separately in the Schools card above.
Census & demographics
- Census place
- Virginia, MN
- County
- Saint Louis County · 115,152 people
- City population
- 9,663
- Metro
- Duluth, MN-WI
- Population (ZIP)
- 9,663
- Household income
- $53,750
- Rent vs Own
- Severe rent burden
- 286.0
Population outlook (St. Louis County) Hauer SSP2
- Today (2025)
- 202,411 people
- By 2030
- 203,234 · +0.4%
- By 2040
- 202,520 · +0.1%
- By 2050
- 200,853 · -0.8%
- By 2075
- 200,943 · -0.7%
- By 2100
- 192,058 · -5.1%
Race, ethnicity, and origin ACS 2023
- Neighborhood character
- Predominantly White (90%)
- Race & ethnicity
- White 90% Two or more races 4% Native American 3% Asian 1%
- Common ancestry
- Portuguese 12% Romanian 4% Lithuanian 2%
- Foreign-born
- 2% · Canada, Vietnam
- Languages at home
- 96% English-only · Spanish 1% Other Asian/Pacific 1%
Political lean MEDSL · St. Louis
- 2024 margin
- D (+13.7) · D 55.9% · R 42.2% · Other 1.8%
- 2008→2024 swing
- -18.8pp toward R · 2008: 32.5pp · 2024: 13.7pp
- All cycles
- 2024: D+13.7 2020: D+15.6 2016: D+11.8 2012: D+29.6 2008: D+32.5
Not yet ingested
- Civics
- —
Market trends
- HPI YoY
- ▼ -72.05%
- Current HPI
- 199.7165
- Rent YoY
- —
- Metro
- Duluth, MN-WI
- State GDP YoY
- ▲ 2.41%
- F500 in state
- 34
Industry mix (Fortune 500 HQ in MN)
| Industry | F500 HQs | Revenue |
|---|---|---|
| Healthcare | 2 | $407B |
|
||
| Retail | 2 | $150B |
|
||
| Consumer Goods | 2 | $32B |
|
||
| Industrial Machinery | 2 | $6B |
|
||
| Agriculture | 1 | $40B |
|
||
| Healthcare / Medical Devices | 1 | $32B |
|
||
Price history
+471.4% since first listed10 events — show timeline
- 2026-04-29 Relisted — RAOR
- 2026-04-28 Delisted — RAOR
- 2026-03-26 Relisted — RAOR
- 2026-01-06 Delisted — RAOR
- 2025-10-22 Listed $160,000 RAOR
- 2006-03-02 Sold (Public Records) $45,000 Public Records
- 2004-09-17 Sold (Public Records) $38,622 Public Records
- 2003-02-19 Sold (Public Records) $28,000 Public Records
- 2003-01-21 Sold (Public Records) $45,000 Public Records
- 2000-04-12 Sold (Public Records) $28,000 Public Records
Property tax history
+0.5%/yrLatest (2025): $1,440 · +7.0% YoY. Source: county tax records.
Cash-flow waterfall
monthlySold comps — $/sqft
last 12 mo · ≤1 miLoading sold comps…