29323 Deschamp Rd · Kiln, MS
Flood risk No data
- FEMA flood zone
- —
- Chance of flooding over 30 yrs
- —
- Est. flood insurance / yr
- —
Fire risk No data
- Est. fire insurance / yr
- —
Heat risk No data
- Hot days now (above threshold)
- —
- Hot days in 30 yrs
- —
Wind risk No data
- Chance of severe wind over 30 yrs
- —
Air-quality risk No data
- Unhealthy air days now
- —
- Unhealthy air days in 30 yrs
- —
Risk factors via First Street. Map © Google.
Why this score? — see what drove the B- grade
The composite is a weighted blend of 9 inputs, each scored 0–100. Each bar is that input's sub-score; the figure is the points it added to the 100-point composite (weight × sub-score).
- Cash flow +30.0/30.0
- 1% rule +10.0/10.0
- DSCR +10.0/10.0
- ARV discount +7.5/15.0
- Schools +4.2/10.0
- Livability +3.4/5.0
- Rent growth +2.5/5.0
- Condition / age +1.0/5.0
- Appreciation +0.0/10.0
$95,000
🖨 Deal sheet 📄 Offer letter ✓ Due diligence
Listing remarks MLS
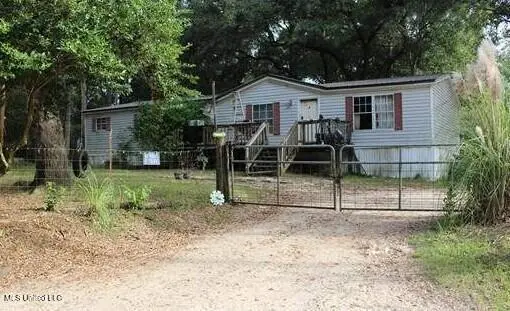
* This property is occupied; buyer will be responsible for obtaining possession after closing. Do not disturb occupants or trespass.* Mobile home on 1.2 acre parcel, fenced yard and side gravel parking. rear of parcel is wooded.
Key facts
- Fenced yard
- Side gravel parking
- Wooded
Tags
Neighborhood map
What this means for you Summary
Snapshot
- This is a 4-bed/2.0-bath single-family listed at $95k. Condition is rated poor.
Deal economics
- At list price, monthly cash flow is $697 ($8k/yr) — positive.
- The deal already cash-flows at list — no discount required.
- Meets the 1% rule at list price ($2k rent vs $95k).
- Recommended offer: $84k (12.0% below list) — sets the bar for market timing.
- Cap rate 15.1% vs local median 3.0% in Kiln — top-decile yield for the area; either an underpriced asset or a hidden risk that comps aren't pricing in. Stress-test before assuming the spread holds.
Location & tenants
- Location reads 68/100 on livability (#69 in MS) — a middle-class / working-renter tenant base. Strengths: crime A+, cost of living A+, housing A; Watch: schools C-, amenities F, commute F.
- Harrison County School District (rural): math 52% / reading 46% proficiency, ranked #14 of 130 in MS (top 11%) — families likely to look elsewhere, expect single-tenant / working-renter base with shorter leases; 62% free/reduced lunch — lower-income household profile, screen leases tightly.
- Market conditions: 481 active listings in the ZIP; 2,194 units permitted in Harrison County in 2024 (0 in 5+ unit buildings).
Forward outlook
- Local home prices are declining (-3.0%/yr); year-one equity from $657 of loan paydown is wiped out by about $3k of value loss. Plan a longer hold.
- Harrison County population projected at +27% by 2050 — long-run rental-demand tailwind backs the buy-and-hold thesis.
- At projected returns (-3.0% appreciation + 3.0% rent growth), your $27k cash investment doubles in ~4 years — after that, you're playing with house money.
Negotiation context
- It's been on market 230 days — a 12% lower offer ($84k) is reasonable based on typical stale-listing flexibility.
- 2 sale attempts with the ask held roughly flat each time — persistent listings suggest the price (not the market) is what's stuck; bring a comps-based counter.
Questions for the listing agent
- It's been on market 230 days. Have you received any prior offers? Is the seller open to a 12% concession, seller financing, or rate buy-down credit?
- Have any recent inspections been done? Can we get a copy of the seller's disclosures and any deferred-maintenance estimates?
- Why hasn't it sold? Are there any deal-killer items the seller is aware of (foundation, flood, title, zoning, code violations)?
- Is there a deadline driving the sale (1031 exchange, divorce, estate, relocation)? That informs how much negotiation room exists.
- What's the average days-on-market for RENTAL listings here right now (not sales)? A rising rental-DOM trend means longer vacancies and softer asking-rent achievability than the comps imply.
- What's the recent tenant-quality profile in this submarket — average credit score on applications, eviction rate, late-payment / NSF rate, and stable-employment percentage? A property-management company in the area should have these aggregated.
- How much new for-sale + rental construction is in the pipeline within 1–3 miles? Heavy new supply typically softens prices + rents 12–24 months out; constrained supply supports both.
Investment metrics
- 1% rule
- 1.80% ✓
- Cap rate
- 15.10%
- Cash-on-cash
- 31.44%
- DSCR
- 2.40
- GRM
- 4.6
CMA / ARV
No comps found within radius.
Projected returns pro-forma
-3.0% appreciation · 3.0% rent growth · sell at horizon
- IRR
- 26.3%
- Equity multiple
- 2.09×
- Total profit
- $29,024
- Equity at exit
- $14,165
- IRR
- 34.0%
- Equity multiple
- 4.10×
- Total profit
- $82,541
- Equity at exit
- $8,214
Cash invested: $26,600 (down + closing). Projections, not guarantees.
Landlord ↔ Tenant lean methodology
- Overall (STATE)
- 90 Strongly Landlord-Friendly
- State Mississippi
- 90 Strongly Landlord-Friendly · R+11
- County
- — inherits STATE
- City
- — inherits STATE
ZIP-level market 39571
- Active inventory
- 481
- Price-to-rent
- 4.6×
Monthly cashflow live
- Estimated rent
- $1,713 medium interval (Pro) →
- Mortgage (P&I)
- −$498
- Tax est. 1.5%
- −$119 /mo · $1,425/yr
- Insurance
- −$40
- HOA
- −$0
- Vacancy / Maint / Mgmt
- −$360
- Net cashflow
- $697
Break-even live
UW: 25.0% down · 7.5% · 30yr · 1.5% tax · 5.0% vac · 8.0% maint · 8.0% mgmt
Financing live
Cash to close
- Down payment
- $23,750
- Closing costs
- $2,850
- Reserves months
- —
- Total cash needed
- —
Loan-product check · same deal, 3 products live
Conventional
25% down · 7.5% · 30yr
- Down + closing
- —
- Monthly P&I
- —
- Monthly cashflow
- —
- DSCR
- —
- Eligible?
- —
Personal DTI + credit; lowest rate.
DSCR
20% down · 8.5% · 30yr
- Down + closing
- —
- Monthly P&I
- —
- Monthly cashflow
- —
- DSCR
- —
- Eligible?
- —
No personal income docs; deal must DSCR.
Hard money
10% down · 12.0% · 12mo
- Down + closing
- —
- Monthly P&I
- —
- Monthly cashflow
- —
- DSCR
- —
- Eligible?
- —
Short-term bridge; refi at stabilization.
Listing history 17 events
-
2026-06-18days on market $95,000 Active 230 DOM
-
2026-06-17days on market $95,000 Active 229 DOM
-
2026-06-16days on market $95,000 Active 228 DOM
-
2026-06-15days on market $95,000 Active 227 DOM
-
2026-06-14days on market $95,000 Active 225 DOM
-
2026-06-13days on market $95,000 Active 224 DOM
-
2026-06-10days on market $95,000 Active 222 DOM
-
2026-06-09days on market $95,000 Active 221 DOM
-
2026-06-08days on market $95,000 Active 220 DOM
-
2026-06-07days on market $95,000 Active 219 DOM
-
2026-06-02days on market $95,000 Active 214 DOM
-
2026-06-01days on market $95,000 Active 213 DOM
-
2026-05-31days on market $95,000 Active 212 DOM
-
2026-05-30days on market $95,000 Active 211 DOM
-
2026-04-02status Active 230-char remark
Show marketing remark (230 chars)
* This property is occupied; buyer will be responsible for obtaining possession after closing. Do not disturb occupants or trespass.* Mobile home on 1.2 acre parcel, fenced yard and side gravel parking. rear of parcel is wooded.
-
2026-03-31historical 230-char remark
Show marketing remark (230 chars)
* This property is occupied; buyer will be responsible for obtaining possession after closing. Do not disturb occupants or trespass.* Mobile home on 1.2 acre parcel, fenced yard and side gravel parking. rear of parcel is wooded.
-
2025-10-28$95,000 Active 230-char remark
Show marketing remark (230 chars)
* This property is occupied; buyer will be responsible for obtaining possession after closing. Do not disturb occupants or trespass.* Mobile home on 1.2 acre parcel, fenced yard and side gravel parking. rear of parcel is wooded.
ⓘ Source: listings_history table (triggers on properties + properties_extension) + one-shot
backfill from property_details.listing_events for pre-trigger history.
Nearby sold comps map
Loading sold comps map…
Walkable amenities ~0.75 mi
Loading nearby amenities…
Taxation est. · year 1
- Rental income
- $20,560
- − Mortgage interest
- −$5,321
- − Property taxes
- −$1,425
- − Insurance
- −$475
- − Repairs & maintenance
- −$1,645
- − Management
- −$1,645
- − Depreciation
- −$2,764
- Taxable income
- $7,285
- Est. tax owed @ 24.0%
- −$1,748
- After-tax cash flow
- $6,616/yr
For passive investors: Depreciation is non-cash, so a rental often shows a tax loss while cash-flowing — sheltering income. Rental losses are passive: they offset passive income freely, and up to $25,000/yr can offset ordinary (W-2) income if you actively participate and your MAGI is under $100k (phasing out to $0 by $150k); unused losses carry forward. On sale, claimed depreciation is recaptured at up to 25%, and gains may owe capital-gains tax (a 1031 exchange can defer both). Figures are a year-1 estimate at your 24.0% rate — not tax advice; consult a CPA.
Condition & rehab AI · 1 photo
This mobile home requires extensive repairs and maintenance, including painting, landscaping, and roof replacement. Significant improvements can be made to increase its resale and rental value.
Repairs flagged
- Major exterior siding — Significant wear and tear
- Major roof — Aged appearance
- Major paint — Needs fresh paint
- Major landscaping — Overgrown vegetation
Value-add opportunities
- Both paint the exterior and interior — Fresh paint can improve curb appeal and interior aesthetics
- Both landscaping and yard maintenance — A well-maintained yard can increase both resale and rental value
- Both repair and replace the roof — A new roof can significantly increase the home's value and reduce maintenance costs
Renovation cost estimate screening
| Repair item | Severity | Est. cost |
|---|---|---|
| exterior siding · Significant wear and tear | Major | $15,000–50,000 |
| roof · Aged appearance | Major | $15,000–50,000 |
| paint · Needs fresh paint | Major | $15,000–50,000 |
| landscaping · Overgrown vegetation | Major | $15,000–50,000 |
| Total estimated repair cost · 4 items | $60,000–200,000 |
Value-add ROI direction
- Both paint the exterior and interior — Fresh paint can improve curb appeal and interior aesthetics ↑
- Both landscaping and yard maintenance — A well-maintained yard can increase both resale and rental value ↑
- Both repair and replace the roof — A new roof can significantly increase the home's value and reduce maintenance costs ↑
ⓘ Cost ranges are severity-bucket heuristics (US national rule-of-thumb). Get contractor quotes + a written scope before underwriting a rehab budget.
Schools (NCES district)
- District
- Harrison County School District
- NCES district ID
- 2801770
- Math proficiency
- 52% ▼ -4.00%
- Reading proficiency
- 46% ▼ -4.00%
- Median HH income
- $46,504
- Composite
- 41.66/100
- National rank
- #3419
- State rank
- #14 of 130 in MS
Livability — Kiln
- Score
- 68/100
- State rank
- #69
- US rank
- #9853
Category grades
Schools grade is shown separately in the Schools card above.
Census & demographics
- City population
- 7,583
- Population (ZIP)
- 13,942
Population outlook (Harrison County) Hauer SSP2
- Today (2025)
- 228,444 people
- By 2030
- 241,942 · +5.9%
- By 2040
- 267,531 · +17.1%
- By 2050
- 291,062 · +27.4%
- By 2075
- 346,711 · +51.8%
- By 2100
- 378,165 · +65.5%
Race, ethnicity, and origin ACS 2023
- Neighborhood character
- Predominantly White (73%)
- Race & ethnicity
- White 73% Black 17% Hispanic / Latino 7% Two or more races 6%
- Hispanic origin (detail)
- Mexican 2%
- Common ancestry
- Lithuanian 10% Slovak 2% Italian 2%
- Foreign-born
- 2% · Canada, Vietnam
- Languages at home
- 95% English-only · Spanish 3% French/Haitian/Cajun 0%
Political lean MEDSL · Harrison
- 2024 margin
- Strong R (+28.9) · D 35.0% · R 63.9% · Other 1.1%
- 2008→2024 swing
- -2.9pp toward R · 2008: -26.0pp · 2024: -28.9pp
- All cycles
- 2024: R+28.9 2020: R+25.2 2016: R+30.7 2012: R+26.6 2008: R+26.0
Not yet ingested
- Civics
- —
Market trends
- HPI YoY
- ▼ -107.22%
- Current HPI
- 183.8701
- Rent YoY
- —
- Metro
- —
- State GDP YoY
- —
- F500 in state
- 0
Price history
3 events — show timeline
- 2026-04-02 Relisted — MLSU
- 2026-03-31 Listing Removed — MLSU
- 2025-10-28 Listed $95,000 MLSU
Cash-flow waterfall
monthlySold comps — $/sqft
last 12 mo · ≤1 miLoading sold comps…