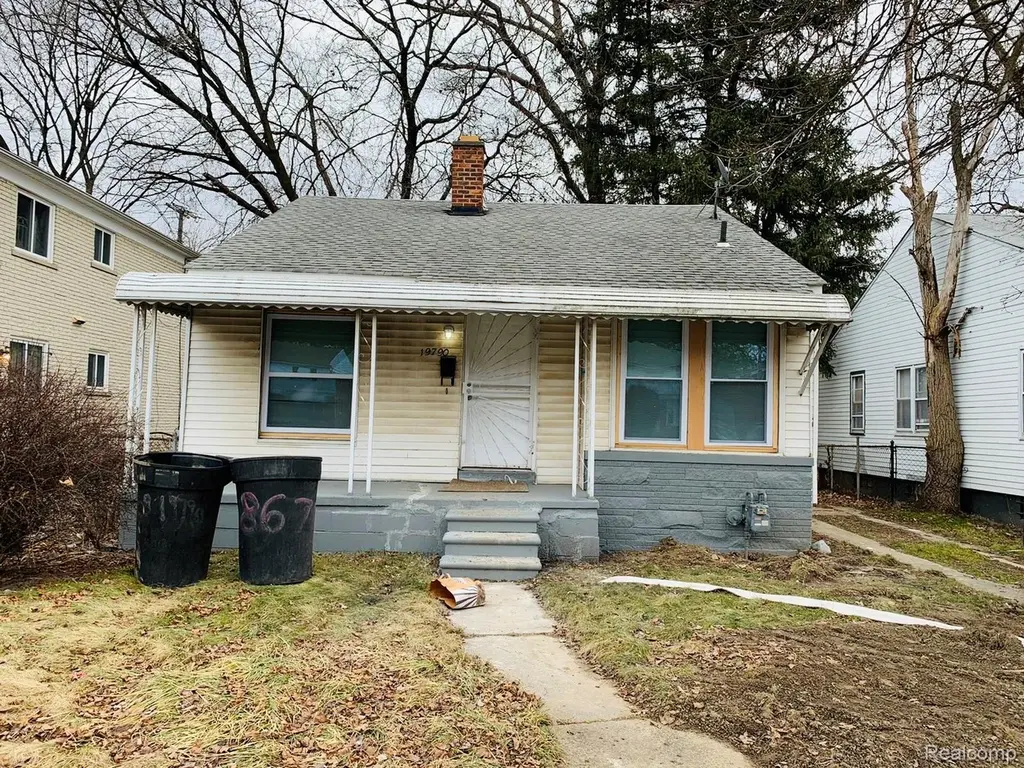
19790 Lahser Rd · Detroit, MI
Flood risk 1/10 · Minimal
- FEMA flood zone
- X (unshaded)
- Chance of flooding over 30 yrs
- 0.0%
- Est. flood insurance / yr
- $473 – $860
Fire risk 1/10 · Minimal
- Est. fire insurance / yr
- $784 – $1,456
Heat risk 2/10 · Minimal
- Hot days now (above 98°F)
- 7 days/yr
- Hot days in 30 yrs
- 14 days/yr
Wind risk 2/10 · Minimal
- Chance of severe wind over 30 yrs
- —
Air-quality risk 3/10 · Minor
- Unhealthy air days now
- 2 days/yr
- Unhealthy air days in 30 yrs
- 3 days/yr
Risk factors via First Street. Map © Google.
Why this score? — see what drove the B+ grade
The composite is a weighted blend of 9 inputs, each scored 0–100. Each bar is that input's sub-score; the figure is the points it added to the 100-point composite (weight × sub-score).
- Cash flow +30.0/30.0
- ARV discount +10.5/15.0
- 1% rule +10.0/10.0
- DSCR +10.0/10.0
- Appreciation +5.0/10.0
- Livability +3.7/5.0
- Rent growth +2.5/5.0
- Condition / age +2.5/5.0
- Schools +1.3/10.0
$67,000
🖨 Deal sheet 📄 Offer letter ✓ Due diligence
Listing remarks MLS
three-bedroom, one-bathroom home located in Detroit, on the city's west side. The property offers a spacious layout * * PROPERTY IS RENTED WITH A GOOD PAYING TENNAT * * * * !!!DO NOT DISTURB THE TENANTS * * * SHOWINGS WILL BE DONE AFTER OFFERS IS ACCPTED * *
Key facts
- Strong rental demand
- Spacious lot
- Nearby parks
Tags
Neighborhood map
What this means for you Summary
Snapshot
- This is a 3-bed/1.0-bath single-family listed at $67k.
Deal economics
- At list price, monthly cash flow is $470 ($6k/yr) — positive.
- The deal already cash-flows at list — no discount required.
- Meets the 1% rule at list price ($1k rent vs $67k).
- Cap rate 14.7% vs local median 10.2% in Detroit — top-decile yield for the area; either an underpriced asset or a hidden risk that comps aren't pricing in. Stress-test before assuming the spread holds.
Location & tenants
- Location reads 73/100 on livability (#218 in MI) — a middle-class / working-renter tenant base. Strengths: amenities A+, commute A+, cost of living A+; Watch: schools F, crime F, employment F.
- Detroit Public Schools Community District (urban): math 10% / reading 24% proficiency, ranked #499 of 540 in MI (top 92%) — low school quality limits family demand, transient renter base, plan for 1-2y turnover; 90% free/reduced lunch — lower-income household profile, screen leases tightly.
- Market conditions: 2 active listings in the ZIP; 40 comparable units currently listed for rent nearby; rentals at typical pace (median 24d on market — plan ~3-4 weeks tenant-placement turnaround); 45% of comp listings sitting > 30 days — soft ceiling on asking rent; 2,639 units permitted in Wayne County in 2024 (1,216 in 5+ unit buildings).
Forward outlook
- In year one you build about $2k of equity ($463 loan paydown + $2k appreciation (3.0% local appreciation)).
- Wayne County population projected at -17% by 2050 — secular population decline; favor cash flow + early exit over multi-decade hold.
- At projected returns (3.0% appreciation + 3.0% rent growth), your $19k cash investment doubles in ~3 years — after that, you're playing with house money.
Negotiation context
- Only 4 days on market — expect competitive offers; lowballing is unlikely to land.
- 18 sale attempts since 25y ago; this cycle's ask has dropped $8k (11%) from the opening price — seller is motivated, your offer sets the floor, not the list.
Risks & watch-outs
- Watch-outs: property tax is 3.1% of price; built in 1950 — expect roof / HVAC / electrical / plumbing capex.
Questions for the listing agent
- Built in 1950 — when were the roof, HVAC, electrical panel, plumbing, and water heater last replaced?
- Property tax is high relative to price — has the assessment been appealed recently, and will the sale trigger a re-assessment?
- Is there a deadline driving the sale (1031 exchange, divorce, estate, relocation)? That informs how much negotiation room exists.
- Schools are F-rated, which usually means shorter tenancies and higher turnover. Who's the typical renter profile here, and what's been the actual vacancy rate?
- Crime grade is F in this area — have there been break-ins, vandalism, or insurance claims at this property in the last 3 years? What carrier currently insures it and at what premium?
- What's the average days-on-market for RENTAL listings here right now (not sales)? A rising rental-DOM trend means longer vacancies and softer asking-rent achievability than the comps imply.
- What's the recent tenant-quality profile in this submarket — average credit score on applications, eviction rate, late-payment / NSF rate, and stable-employment percentage? A property-management company in the area should have these aggregated.
- How much new for-sale + rental construction is in the pipeline within 1–3 miles? Heavy new supply typically softens prices + rents 12–24 months out; constrained supply supports both.
Investment metrics
- 1% rule
- 1.93% ✓
- Cap rate
- 14.70%
- Cash-on-cash
- 30.04%
- DSCR
- 2.34
- GRM
- 4.3
CMA / ARV
- ARV (median comp)
- $71,823
- List price
- $67,000
- Delta
- -6.72%
- Verdict
- FAIR
- Comps
- 20 within 1.0 mi
Show comp detail 12 sales within ~0.75 mi
| Address | Dist | Beds/Ba | Sqft | Sold | Price | $/sf | Match |
|---|---|---|---|---|---|---|---|
| 21338 Pembroke Ave | 0.26mi | 3/1.0 | 930 (+0%) | 1mo | $115,000 | $124 | 87 |
| 19734 Westbrook St | 0.31mi | 3/1.0 | 950 (+2%) | 2mo | $63,500 | $67 | 80 |
| 19711 Chapel St | 0.17mi | 3/1.0 | 1,014 (+9%) | 1mo | $120,000 | $118 | 76 |
| 19212 Northrop St | 0.40mi | 3/1.0 | 981 (+6%) | 2mo | $65,000 | $66 | 70 |
| 18924 Bentler St | 0.68mi | 3/1.0 | 920 (-1%) | 3mo | $74,900 | $81 | 64 |
| 22530 Leewin St | 0.40mi | 3/1.0 | 832 (-10%) | 2mo | $78,600 | $94 | 62 |
| 18925 Bentler St | 0.67mi | 3/2.0 | 937 (+1%) | 1mo | $79,900 | $85 | 62 |
| 20300 Chapel St | 0.41mi | 3/1.0 | 1,043 (+12%) | 1mo | $122,500 | $117 | 60 |
| 19971 Patton St | 0.67mi | 2/1.5 (-1) | 901 (-3%) | 3mo | $54,000 | $60 | 55 |
| 20089 Trinity St | 0.47mi | 3/2.0 | 1,025 (+10%) | 4mo | $201,349 | $196 | 53 |
| 20061 Pierson St | 0.57mi | 2/1.5 (-1) | 869 (-6%) | 4mo | $50,000 | $58 | 53 |
| 19515 Patton St | 0.65mi | 3/1.0 | 822 (-11%) | 4mo | $95,000 | $116 | 47 |
Match score weights: distance 35% · size 25% · config 20% · recency 20%. Top-matched comps best support the ARV.
Projected returns pro-forma
3.0% appreciation · 3.0% rent growth · sell at horizon
- IRR
- 35.9%
- Equity multiple
- 3.03×
- Total profit
- $38,055
- Equity at exit
- $30,126
- IRR
- 36.1%
- Equity multiple
- 5.99×
- Total profit
- $93,670
- Equity at exit
- $46,428
Cash invested: $18,760 (down + closing). Projections, not guarantees.
Landlord ↔ Tenant lean methodology
- Overall (STATE)
- 62 Landlord-Friendly
- State Michigan
- 62 Landlord-Friendly · EVEN
- County
- — inherits STATE
- City
- — inherits STATE
ZIP-level market 48219 1837
- Active inventory
- 2
- Price-to-rent
- 4.3×
Monthly cashflow live
- Estimated rent
- $1,295 high interval (Pro) →
- Mortgage (P&I)
- −$351
- Tax from tax record
- −$174 /mo · $2,094/yr
- Insurance
- −$28
- HOA
- −$0
- Vacancy / Maint / Mgmt
- −$272
- Net cashflow
- $470
Break-even live
UW: 25.0% down · 7.5% · 30yr · 1.5% tax · 5.0% vac · 8.0% maint · 8.0% mgmt
Financing live
Cash to close
- Down payment
- $16,750
- Closing costs
- $2,010
- Reserves months
- —
- Total cash needed
- —
Loan-product check · same deal, 3 products live
Conventional
25% down · 7.5% · 30yr
- Down + closing
- —
- Monthly P&I
- —
- Monthly cashflow
- —
- DSCR
- —
- Eligible?
- —
Personal DTI + credit; lowest rate.
DSCR
20% down · 8.5% · 30yr
- Down + closing
- —
- Monthly P&I
- —
- Monthly cashflow
- —
- DSCR
- —
- Eligible?
- —
No personal income docs; deal must DSCR.
Hard money
10% down · 12.0% · 12mo
- Down + closing
- —
- Monthly P&I
- —
- Monthly cashflow
- —
- DSCR
- —
- Eligible?
- —
Short-term bridge; refi at stabilization.
Rent comps 40 comps
| Address | Beds | Baths | Sqft | Rent | $/sqft | DOM | Units | Dist |
|---|---|---|---|---|---|---|---|---|
| 19928 Houghton St Detroit, MI | 3.0 | 1.0 | 880 | $1,495 | $1.70 | 10d | 1 | 0.16mi |
| 21422 Pembroke Ave Detroit, MI | 3.0 | 1.5 | 1000 | $1,695 | $1.70 | 16d | 1 | 0.20mi |
| 22238 Pembroke Ave Detroit, MI | 3.0 | 1.5 | 1100 | $1,500 | $1.36 | 43d | 1 | 0.20mi |
| 20555 Lahser Rd Detroit, MI | 1.0–2.0 | 1.0 | 737 | $975 | $1.32 | 43d | 2 | 0.43mi |
| 22649 Frisbee St Detroit, MI | 3.0 | 1.0 | 1100 | $1,495 | $1.36 | 43d | 1 | 0.48mi |
| 19800 Berg Rd Detroit, MI | 3.0 | 1.0 | 1000 | $1,550 | $1.55 | 16d | 1 | 0.50mi |
| 22570 Seven Mile W Detroit, MI | 2.0 | 1.0 | 890 | $875 | $0.98 | 43d | 1 | 0.60mi |
| 19781 Fielding St Detroit, MI | 3.0 | 1.0 | 1000 | $1,294 | $1.29 | 4d | 1 | 0.68mi |
| 47129 Wedgewood Southfield, MI | 1.0–2.0 | 1.0–2.0 | 1000 | $1,275 | $1.27 | 43d | 1 | 0.70mi |
| 19301 Shiawassee Dr Detroit, MI | 1.0–2.0 | 1.0 | 740 | $1,150 | $1.55 | 43d | 2 | 0.83mi |
| 21455 Pickford St Detroit, MI | 2.0 | 1.0 | 1000 | $1,275 | $1.27 | 43d | 1 | 0.85mi |
| 18437 Trinity St Detroit, MI | 3.0 | 1.0 | 875 | $1,364 | $1.56 | 14d | 1 | 0.88mi |
| 21434 Karl St Detroit, MI | 2.0 | 1.0 | 1000 | $1,350 | $1.35 | 43d | 1 | 0.88mi |
| 23411 W Eight Mile Rd Detroit, MI | 1.0–2.0 | 1.0 | 742 | $1,000 | $1.35 | 43d | 1 | 0.90mi |
| 19800 Telegraph Rd Detroit, MI | 2.0 | 1.0 | 855 | $1,020 | $1.19 | 43d | 1 | 0.93mi |
| 19457 Evergreen Rd Detroit, MI | 2.0 | 1.0 | 1100 | $1,200 | $1.09 | 43d | 1 | 0.96mi |
| 17721 Westbrook St Detroit, MI | 4.0 | 1.0 | 1040 | $1,125 | $1.08 | 24d | 1 | 1.02mi |
| 19276 Telegraph Rd Detroit, MI | 2.0 | 1.0 | 820 | $975 | $1.19 | 43d | 1 | 1.03mi |
| 19248 Telegraph Rd Unit P7 Detroit, MI | 2.0 | 1.0 | 820 | $975 | $1.19 | 24d | 1 | 1.03mi |
| 19264 Telegraph Rd Unit G7 Detroit, MI | 2.0 | 1.0 | 820 | $975 | $1.19 | 43d | 1 | 1.04mi |
| 21451 Glenco St Detroit, MI | 3.0 | 1.0 | 1026 | $1,400 | $1.36 | 16d | 1 | 1.04mi |
| 19250 Telegraph Rd Unit O7 Detroit, MI | 2.0 | 1.0 | 820 | $975 | $1.19 | 24d | 1 | 1.04mi |
| 18025 Bentler St Detroit, MI | 3.0 | 1.0 | 728 | $1,250 | $1.72 | 24d | 1 | 1.06mi |
| 18556 Kentfield St Detroit, MI | 3.0 | 1.0 | 952 | $1,250 | $1.31 | 2d | 1 | 1.06mi |
| 18274 Fielding St Detroit, MI | 2.0 | 1.0 | 700 | $1,200 | $1.71 | 16d | 1 | 1.11mi |
| 21440 Bennett St Detroit, MI | 3.0 | 1.0 | 1037 | $1,394 | $1.34 | 16d | 1 | 1.13mi |
| 18461 Heyden St Detroit, MI | 2.0 | 1.0 | 1000 | $1,050 | $1.05 | 4d | 1 | 1.15mi |
| 18205 Stout St Detroit, MI | 3.0 | 1.0 | 901 | $1,078 | $1.20 | 24d | 1 | 1.17mi |
| 24224 W 7 Mile Rd Detroit, MI | 1.0–2.0 | 1.0 | 600 | $875 | $1.46 | 43d | 3 | 1.19mi |
| 18191 Heyden St Detroit, MI | 2.0 | 1.0 | 917 | $1,100 | $1.20 | 24d | 1 | 1.26mi |
| 20271 Grandville Ave Detroit, MI | 3.0 | 1.0 | 1010 | $1,550 | $1.53 | 23d | 1 | 1.31mi |
| 17270 Bentler St Detroit, MI | 2.0 | 1.0 | 650 | $850 | $1.31 | 43d | 1 | 1.31mi |
| 17274 Bentler St #46 Detroit, MI | 2.0 | 1.0 | 700 | $850 | $1.21 | 16d | 1 | 1.32mi |
| 17274 Bentler St Detroit, MI | 2.0 | 1.0 | 700 | $850 | $1.21 | 43d | 2 | 1.33mi |
| 17274 Bentler St Detroit, MI | 2.0 | 1.0 | 700 | $838 | $1.20 | 24d | 2 | 1.33mi |
| 19372 Grandville Ave Detroit, MI | 2.0 | 1.5 | 733 | $1,050 | $1.43 | 14d | 1 | 1.34mi |
| 18134 Vaughan St Detroit, MI | 3.0 | 1.0 | 1060 | $1,150 | $1.08 | 16d | 1 | 1.35mi |
| 19176 Grandville Ave Detroit, MI | 3.0 | 1.0 | 941 | $1,300 | $1.38 | 4d | 1 | 1.38mi |
| 18302 Wormer St Detroit, MI | 3.0 | 1.0 | 1046 | $1,475 | $1.41 | 43d | 1 | 1.42mi |
| 18450 Edinborough Rd Detroit, MI | 3.0 | 1.0 | 1000 | $1,500 | $1.50 | 43d | 1 | 1.43mi |
Listing history 50 events
-
2026-06-18days on market $67,000 Active 4 DOM
-
2026-06-17days on market $67,000 Active 3 DOM
-
2026-06-16days on market $67,000 Active 2 DOM
-
2026-06-15remarks 699-char remark
-
2026-06-15days on market $67,000 Active 1 DOM
-
2026-06-13days on market $67,000 Active 313 DOM
-
2026-06-13days on market $67,000 Active 312 DOM
-
2026-06-09days on market $67,000 Active 309 DOM
-
2026-06-08days on market $67,000 Active 308 DOM
-
2026-06-07days on market $67,000 Active 307 DOM
-
2026-06-04days on market $67,000 Active 304 DOM
-
2026-06-03days on market $67,000 Active 303 DOM
-
2026-06-01days on market $67,000 Active 301 DOM
-
2026-05-31days on market $67,000 Active 300 DOM
-
2026-03-02price $67,000 268-char remark
Show marketing remark (268 chars)
three-bedroom, one-bathroom home located in Detroit, on the city's west side. The property offers a spacious layout * * PROPERTY IS RENTED WITH A GOOD PAYING TENNAT * * * * !!!DO NOT DISTURB THE TENANTS * * * SHOWINGS WILL BE DONE AFTER OFFERS IS ACCPTED * *
-
2025-12-27price $74,000 268-char remark
Show marketing remark (268 chars)
three-bedroom, one-bathroom home located in Detroit, on the city's west side. The property offers a spacious layout * * PROPERTY IS RENTED WITH A GOOD PAYING TENNAT * * * * !!!DO NOT DISTURB THE TENANTS * * * SHOWINGS WILL BE DONE AFTER OFFERS IS ACCPTED * *
-
2025-12-26price $74,000 268-char remark
Show marketing remark (268 chars)
three-bedroom, one-bathroom home located in Detroit, on the city's west side. The property offers a spacious layout * * PROPERTY IS RENTED WITH A GOOD PAYING TENNAT * * * * !!!DO NOT DISTURB THE TENANTS * * * SHOWINGS WILL BE DONE AFTER OFFERS IS ACCPTED * *
-
2025-08-04$75,000 Active 268-char remark
Show marketing remark (268 chars)
three-bedroom, one-bathroom home located in Detroit, on the city's west side. The property offers a spacious layout * * PROPERTY IS RENTED WITH A GOOD PAYING TENNAT * * * * !!!DO NOT DISTURB THE TENANTS * * * SHOWINGS WILL BE DONE AFTER OFFERS IS ACCPTED * *
-
2021-01-28soldstatus $69,900
-
2020-02-11historical
-
2020-02-11historical
-
2019-11-09price $30,000
-
2019-11-08price $30,000
-
2019-10-25$35,000 Active
-
2019-10-25$35,000 Active
-
2019-10-06historical
-
2019-10-05historical
-
2019-07-16$30,000 Active
-
2019-07-16$30,000 Active
-
2016-05-23historical
-
2016-05-23historical
-
2016-05-11historical
-
2016-05-04status Pending
-
2016-05-04status Pending
-
2016-05-04status Pending
-
2016-05-04historical
-
2016-05-04historical
-
2016-05-02$35,000 Active
-
2016-05-02$35,000 Active
-
2016-05-02$35,000 Active
-
2016-05-02$35,000
-
2015-04-20historical
-
2015-04-20historical
-
2015-03-07price $25,000
-
2014-12-12$26,500 Active
-
2014-09-04$25,000
-
2010-09-30historical
-
2010-06-03$10,917
ⓘ Source: listings_history table (triggers on properties + properties_extension) + one-shot
backfill from property_details.listing_events for pre-trigger history.
Tax reassessment forecast MI · Partial reset (capped growth)
- Current annual tax
- $2,094 · $174/mo
- Projected year-2 tax
- $2,094 · $174/mo
- Expected delta
- $0/yr ($0/mo · 0.0%)
ⓘ Screening estimate from a state-policy table — verify with the county assessor before closing.
Climate risk First Street
- Flood 1/10 Low FEMA zone X (unshaded) · 0% chance over 30 yrs
- Wildfire 1/10 Low
- Heat 2/10 Low 7 d/yr ≥98°F today · 14 d/yr by 30 yrs out
- Wind 2/10 Low
- Air quality 3/10 Moderate 2 unhealthy d/yr today · 3 by 30 yrs out
Nearby sold comps map
Loading sold comps map…
Walkable amenities ~0.75 mi
Loading nearby amenities…
Taxation est. · year 1
- Rental income
- $15,544
- − Mortgage interest
- −$3,753
- − Property taxes
- −$2,094
- − Insurance
- −$335
- − Repairs & maintenance
- −$1,244
- − Management
- −$1,244
- − Depreciation
- −$1,949
- Taxable income
- $4,926
- Est. tax owed @ 24.0%
- −$1,182
- After-tax cash flow
- $4,453/yr
For passive investors: Depreciation is non-cash, so a rental often shows a tax loss while cash-flowing — sheltering income. Rental losses are passive: they offset passive income freely, and up to $25,000/yr can offset ordinary (W-2) income if you actively participate and your MAGI is under $100k (phasing out to $0 by $150k); unused losses carry forward. On sale, claimed depreciation is recaptured at up to 25%, and gains may owe capital-gains tax (a 1031 exchange can defer both). Figures are a year-1 estimate at your 24.0% rate — not tax advice; consult a CPA.
Schools (NCES district)
- District
- Detroit Public Schools Community District
- NCES district ID
- 2601103
- Math proficiency
- 10% ▼ -2.00%
- Reading proficiency
- 24% ▲ 6.00%
- Median HH income
- $25,815
- Composite
- 13.06/100
- National rank
- #9564
- State rank
- #499 of 540 in MI
Livability — Detroit
- Score
- 73/100
- State rank
- #218
- US rank
- #5427
Category grades
Schools grade is shown separately in the Schools card above.
Census & demographics
- Census place
- Detroit, MI
Population outlook (Wayne County) Hauer SSP2
- Today (2025)
- 1,675,273 people
- By 2030
- 1,620,300 · -3.3%
- By 2040
- 1,502,341 · -10.3%
- By 2050
- 1,384,039 · -17.4%
- By 2075
- 1,124,592 · -32.9%
- By 2100
- 881,193 · -47.4%
Not yet ingested
- Political lean
- —
- Race & ethnicity
- —
- Common origin
- —
- Civics
- —
Market trends
- HPI YoY
- —
- Current HPI
- —
- Rent YoY
- —
- Metro
- —
- State GDP YoY
- ▲ 1.37%
- F500 in state
- 28
Industry mix (Fortune 500 HQ in MI)
| Industry | F500 HQs | Revenue |
|---|---|---|
| Automotive Parts | 3 | $48B |
|
||
| Automotive | 2 | $372B |
|
||
| Chemicals | 1 | $45B |
|
||
| Automotive Retail | 1 | $29B |
|
||
| Healthcare / Medical Devices | 1 | $23B |
|
||
| Automotive Technology | 1 | $20B |
|
||
Price history
+191.3% since first listed48 events — show timeline
- 2026-03-02 Price Changed $67,000 MiRealSource-MiMLS
- 2026-03-02 Price Changed $67,000 REALCOMP
- 2025-12-27 Price Changed $74,000 MiRealSource-MiMLS
- 2025-12-26 Price Changed $74,000 REALCOMP
- 2025-08-04 Listed $75,000 REALCOMP
- 2025-08-04 Listed $75,000 MiRealSource-MiMLS
- 2021-01-28 Sold (Public Records) $69,900 Public Records
- 2020-02-11 Listing Removed — REALCOMP
- 2020-02-11 Listing Removed — MiRealSource-MiMLS
- 2019-11-09 Price Changed $30,000 MiRealSource-MiMLS
- 2019-11-08 Price Changed $30,000 REALCOMP
- 2019-10-25 Listed $35,000 MiRealSource-MiMLS
- 2019-10-25 Listed $35,000 REALCOMP
- 2019-10-06 Listing Removed — REALCOMP
- 2019-10-05 Listing Removed — MiRealSource-MiMLS
- 2019-07-16 Listed $30,000 MiRealSource-MiMLS
- 2019-07-16 Listed $30,000 REALCOMP
- 2016-05-23 Listing Removed — MiRealSource-MiMLS
- 2016-05-23 Listing Removed — REALCOMP
- 2016-05-11 Listing Removed — REALCOMP
- 2016-05-04 Pending — MiRealSource-MiMLS
- 2016-05-04 Pending — REALCOMP
- 2016-05-04 Pending — MiRealSource-MiMLS
- 2016-05-04 Listing Removed — MiRealSource-MiMLS
- 2016-05-04 Listing Removed — REALCOMP
- 2016-05-02 Listed $35,000 MiRealSource-MiMLS
- 2016-05-02 Listed $35,000 MiRealSource-MiMLS
- 2016-05-02 Listed $35,000 REALCOMP
- 2016-05-02 Listed $35,000 REALCOMP
- 2015-04-20 Listing Removed — MiRealSource-MiMLS
- 2015-04-20 Listing Removed — REALCOMP
- 2015-03-07 Price Changed $25,000 MiRealSource-MiMLS
- 2014-12-12 Listed $26,500 MiRealSource-MiMLS
- 2014-09-04 Listed $25,000 REALCOMP
- 2010-09-30 Listing Removed — REALCOMP
- 2010-06-03 Listed $10,917 REALCOMP
- 2009-05-18 Listing Removed — REALCOMP
- 2008-04-25 Listed $11,900 REALCOMP
- 2006-04-24 Listing Removed — REALCOMP
- 2006-04-20 Sold (Public Records) $75,000 Public Records
- 2006-01-24 Listed $65,000 REALCOMP
- 2006-01-20 Sold (MLS) $35,500 REALCOMP
- 2005-09-02 Listed $38,000 REALCOMP
- 2002-08-31 Listing Removed — REALCOMP
- 2002-08-06 Listed $71,500 REALCOMP
- 2002-01-02 Listing Removed — REALCOMP
- 2001-10-19 Listed $74,900 REALCOMP
- 1997-06-14 Sold (Public Records) $23,000 Public Records
Property tax history
+5.0%/yrLatest (2025): $2,094 · -11.3% YoY. Source: county tax records.
Cash-flow waterfall
monthlySold comps — $/sqft
last 12 mo · ≤1 miLoading sold comps…