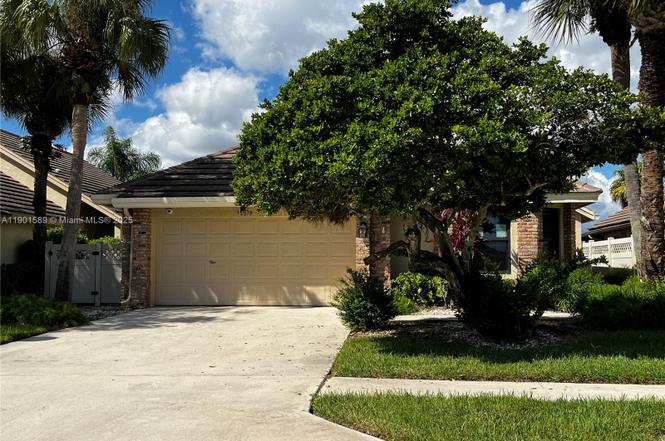
8079 Popash Ct · Boynton Beach, FL
Flood risk 1/10 · Minimal
- FEMA flood zone
- X (unshaded)
- Chance of flooding over 30 yrs
- 0.0%
- Est. flood insurance / yr
- $507 – $1,088
Fire risk 1/10 · Minimal
- Est. fire insurance / yr
- $947 – $1,759
Heat risk 9/10 · Severe
- Hot days now (above 106°F)
- 7 days/yr
- Hot days in 30 yrs
- 26 days/yr
Wind risk 10/10 · Severe
- Chance of severe wind over 30 yrs
- 99.0%
Air-quality risk 2/10 · Minimal
- Unhealthy air days now
- 0 days/yr
- Unhealthy air days in 30 yrs
- 2 days/yr
Risk factors via First Street. Map © Google.
Why this score? — see what drove the B+ grade
The composite is a weighted blend of 9 inputs, each scored 0–100. Each bar is that input's sub-score; the figure is the points it added to the 100-point composite (weight × sub-score).
- Cash flow +30.0/30.0
- 1% rule +10.0/10.0
- DSCR +10.0/10.0
- ARV discount +7.5/15.0
- Appreciation +5.1/10.0
- Schools +4.3/10.0
- Livability +3.6/5.0
- Rent growth +2.5/5.0
- Condition / age +2.5/5.0
$150,000
🖨 Deal sheet 📄 Offer letter ✓ Due diligence
Listing remarks
Great value and create equity with this CBS home on a small lake where homeowners can enjoy a great set of amenities and a lifestyle you deserve. Updated kitchen with SS appliances. Two bedrooms, den/office and two car garage. Investor program in place to save membership costs. Mandatory Club Membership to Aberdeen.
Key facts
- Ss appliances
- Updated kitchen
- Small lake
Tags
Property features AI
Finance
- HOA & community: Monthly association fee ($519) covering common area maintenance and grounds maintenance; Community features include golf, golf course community, maintained community, and sidewalks
Exterior
- Parking: Attached garage with automatic door opener; Two covered garage spaces; Driveway
- Security: Smoke detector(s)
- Utilities: Public water; Public sewer; Cable available; Underground utilities
- Home design: Single-story home; Faces east; Resale property
- Construction: Block construction; Flat and tile roof
- Exterior features: Deck; Patio; Enclosed / screened porch; Exterior lighting; Lakefront view; Sprinkler system (automatic); City street frontage; Paved road
Interior
- Kitchen: Dishwasher; Electric range; Self-cleaning oven; Microwave; Refrigerator; Icemaker; Disposal; Pantry; Breakfast bar
- Bedrooms: Bedroom on main level; One additional bedroom (13 x 12)
- Flooring: Carpet; Tile
- Bathrooms: Two full bathrooms; One half bathroom
- Heating & cooling: Central heating; Central air conditioning; Ceiling fans
- Interior features: Blinds and sliding windows; Skylights; Breakfast bar; Entrance foyer; Family/Dining area; First floor entry; Vaulted ceilings; Garden tub / Roman tub; Pantry; Walk-in closets; Unfurnished
- Laundry & utility: Laundry room; Utility room (6 x 5); Electric water heater
Neighborhood map
What this means for you Summary
Snapshot
- This is a 3-bed/2.5-bath single-family listed at $150k.
Deal economics
- At list price, monthly cash flow is $1k ($14k/yr) — positive.
- The deal already cash-flows at list — no discount required.
- Meets the 1% rule at list price ($4k rent vs $150k).
- Recommended offer: $132k (12.0% below list) — sets the bar for market timing.
- Cap rate 15.5% vs local median 4.3% in Boynton Beach — top-decile yield for the area; either an underpriced asset or a hidden risk that comps aren't pricing in. Stress-test before assuming the spread holds.
Location & tenants
- Location reads 72/100 on livability (#351 in FL) — a middle-class / working-renter tenant base. Strengths: housing A+, health & safety B+, cost of living B; Watch: amenities D+, crime D-, commute F.
- Palm Beach (suburban): math 46% / reading 53% proficiency, ranked #34 of 73 in FL (top 47%) — families likely to look elsewhere, expect single-tenant / working-renter base with shorter leases.
- Market conditions: 169 active listings in the ZIP; 35 comparable units currently listed for rent nearby; rentals at typical pace (median 19d on market — plan ~3-4 weeks tenant-placement turnaround); 3,974 units permitted in Palm Beach County in 2024 (1,012 in 5+ unit buildings).
Forward outlook
- In year one you build about $1k of equity ($1k loan paydown + $297 appreciation (0.2% local appreciation)).
- Palm Beach County population projected at +30% by 2050 — long-run rental-demand tailwind backs the buy-and-hold thesis.
- At projected returns (0.2% appreciation + 3.0% rent growth), your $42k cash investment doubles in ~3 years — after that, you're playing with house money.
Negotiation context
- It's been on market 196 days — a 12% lower offer ($132k) is reasonable based on typical stale-listing flexibility.
Risks & watch-outs
- Climate carrying-cost: severe wind risk, 99% chance of damaging wind over 30y; extreme-heat days projected 7→26/yr by 2055 (HVAC capex compounding) — expect insurance premiums to compound above CPI over the hold.
Questions for the listing agent
- It's been on market 196 days. Have you received any prior offers? Is the seller open to a 12% concession, seller financing, or rate buy-down credit?
- What does the HOA fee cover, when was the last increase, and are there any pending special assessments or reserve-fund shortfalls?
- Why hasn't it sold? Are there any deal-killer items the seller is aware of (foundation, flood, title, zoning, code violations)?
- Is there a deadline driving the sale (1031 exchange, divorce, estate, relocation)? That informs how much negotiation room exists.
- Crime grade is D in this area — have there been break-ins, vandalism, or insurance claims at this property in the last 3 years? What carrier currently insures it and at what premium?
- What's the average days-on-market for RENTAL listings here right now (not sales)? A rising rental-DOM trend means longer vacancies and softer asking-rent achievability than the comps imply.
- What's the recent tenant-quality profile in this submarket — average credit score on applications, eviction rate, late-payment / NSF rate, and stable-employment percentage? A property-management company in the area should have these aggregated.
- How much new for-sale + rental construction is in the pipeline within 1–3 miles? Heavy new supply typically softens prices + rents 12–24 months out; constrained supply supports both.
Investment metrics
- 1% rule
- 2.38% ✓
- Cap rate
- 15.52%
- Cash-on-cash
- 32.94%
- DSCR
- 2.47
- GRM
- 3.5
CMA / ARV
No comps found within radius.
Projected returns pro-forma
0.2% appreciation · 3.0% rent growth · sell at horizon
- IRR
- 34.1%
- Equity multiple
- 2.69×
- Total profit
- $70,896
- Equity at exit
- $45,047
- IRR
- 37.4%
- Equity multiple
- 5.27×
- Total profit
- $179,373
- Equity at exit
- $55,354
Cash invested: $42,000 (down + closing). Projections, not guarantees.
Landlord ↔ Tenant lean methodology
- Overall (STATE)
- 87 Strongly Landlord-Friendly
- State Florida
- 87 Strongly Landlord-Friendly · R+3
- County
- — inherits STATE
- City
- — inherits STATE
ZIP-level market 33472
- Home prices YoY
- 0.1%
- Active inventory
- 169
- Price-to-rent
- 3.5×
Monthly cashflow live
- Estimated rent
- $3,572 high interval (Pro) →
- Mortgage (P&I)
- −$787
- Tax from tax record
- −$301 /mo · $3,612/yr
- Insurance
- −$62
- HOA
- −$519
- Vacancy / Maint / Mgmt
- −$750
- Net cashflow
- $1,153
Break-even live
UW: 25.0% down · 7.5% · 30yr · 1.5% tax · 5.0% vac · 8.0% maint · 8.0% mgmt
Financing live
Cash to close
- Down payment
- $37,500
- Closing costs
- $4,500
- Reserves months
- —
- Total cash needed
- —
Loan-product check · same deal, 3 products live
Conventional
25% down · 7.5% · 30yr
- Down + closing
- —
- Monthly P&I
- —
- Monthly cashflow
- —
- DSCR
- —
- Eligible?
- —
Personal DTI + credit; lowest rate.
DSCR
20% down · 8.5% · 30yr
- Down + closing
- —
- Monthly P&I
- —
- Monthly cashflow
- —
- DSCR
- —
- Eligible?
- —
No personal income docs; deal must DSCR.
Hard money
10% down · 12.0% · 12mo
- Down + closing
- —
- Monthly P&I
- —
- Monthly cashflow
- —
- DSCR
- —
- Eligible?
- —
Short-term bridge; refi at stabilization.
Rent comps 35 comps
| Address | Beds | Baths | Sqft | Rent | $/sqft | DOM | Units | Dist |
|---|---|---|---|---|---|---|---|---|
| 7705 Thornlee Dr Lake Worth, FL | 4.0 | 2.5 | 2382 | $3,500 | $1.47 | 2d | 1 | 0.27mi |
| 8082 Aberdeen Dr #102 Boynton Beach, FL | 2.0 | 2.0 | 1619 | $8,500 | $5.25 | 24d | 1 | 0.33mi |
| 7418 Wescott Ter Lake Worth, FL | 3.0 | 2.5 | 2170 | $3,250 | $1.50 | 7d | 1 | 0.40mi |
| 6581 Marissa Cir Lake Worth, FL | 3.0 | 2.0 | 1414 | $3,300 | $2.33 | 18d | 1 | 0.68mi |
| 6731 Southport Dr Boynton Beach, FL | 3.0 | 2.0 | 1727 | $3,600 | $2.08 | 24d | 1 | 0.69mi |
| 7366 Ashley Shores Cir Lake Worth, FL | 3.0 | 2.5 | 1945 | $4,200 | $2.16 | 7d | 1 | 0.80mi |
| 6143 Windlass Cir Boynton Beach, FL | 4.0 | 2.5 | 2245 | $4,200 | $1.87 | 18d | 1 | 0.90mi |
| 6836 Long Key St Lake Worth, FL | 3.0 | 2.5 | 1637 | $2,950 | $1.80 | 17d | 1 | 0.90mi |
| 7816 Bridlington Dr Boynton Beach, FL | 3.0 | 3.0 | 2330 | $12,000 | $5.15 | 24d | 1 | 1.02mi |
| 7218 Michigan Isle Rd Lake Worth, FL | 3.0 | 2.0 | 1656 | $3,500 | $2.11 | 14d | 1 | 1.05mi |
| 7218 Michigan Isle Rd Lake Worth, FL | 3.0 | 2.0 | 1656 | $3,500 | $2.11 | 13d | 1 | 1.05mi |
| 8884 Shoal Creek Ln Boynton Beach, FL | 3.0 | 2.0 | 1936 | $4,900 | $2.53 | 24d | 1 | 1.06mi |
| 8884 Shoal Creek Ln Boynton Beach, FL | 3.0 | 2.0 | 1936 | $5,000 | $2.58 | 10d | 1 | 1.06mi |
| 7821 Dorchester Rd Boynton Beach, FL | 3.0 | 3.0 | 2325 | $11,000 | $4.73 | 24d | 1 | 1.08mi |
| 7725 Rockford Rd Boynton Beach, FL | 3.0 | 2.5 | 2249 | $10,000 | $4.45 | 2d | 1 | 1.08mi |
| 7975 Rockford Rd Boynton Beach, FL | 2.0 | 2.0 | 1720 | $3,700 | $2.15 | 24d | 1 | 1.12mi |
| 7354 Michigan Isle Rd Lake Worth, FL | 4.0 | 3.0 | 2050 | $3,295 | $1.61 | 24d | 1 | 1.16mi |
| 6365 Lansdowne Cir Boynton Beach, FL | 3.0 | 2.0 | 1769 | $3,200 | $1.81 | 2d | 1 | 1.17mi |
| 7142 Davit Cir Lake Worth, FL | 3.0 | 2.5 | 2050 | $3,545 | $1.73 | 17d | 1 | 1.20mi |
| 7936 Rockford Rd Boynton Beach, FL | 3.0 | 2.0 | 1871 | $9,000 | $4.81 | 22d | 1 | 1.22mi |
| 7832 Rockford Rd Boynton Beach, FL | 3.0 | 2.0 | 1598 | $3,800 | $2.38 | 22d | 1 | 1.23mi |
| 9121 Paragon Way Boynton Beach, FL | 4.0 | 2.0 | 2154 | $4,950 | $2.30 | 24d | 1 | 1.25mi |
| 7577 Caprio Dr Boynton Beach, FL | 3.0 | 2.0 | 1884 | $3,200 | $1.70 | 3d | 1 | 1.26mi |
| 7577 Caprio Dr Boynton Beach, FL | 3.0 | 2.0 | 1884 | $3,200 | $1.70 | 13d | 1 | 1.26mi |
| 7273 Burgess Dr Lake Worth, FL | 3.0 | 2.0 | 1385 | $2,630 | $1.90 | 7d | 1 | 1.26mi |
| 6974 Oak Bridge Ln Lake Worth, FL | 2.0 | 2.5 | 1310 | $2,650 | $2.02 | 14d | 1 | 1.26mi |
| 7192 Summer Tree Dr Boynton Beach, FL | 2.0 | 2.0 | 1722 | $3,000 | $1.74 | 24d | 1 | 1.27mi |
| 7600 Edisto Dr Lake Worth, FL | 3.0 | 2.5 | 1764 | $2,700 | $1.53 | 20d | 1 | 1.28mi |
| 8451 Siciliano St Boynton Beach, FL | 3.0 | 2.0 | 1627 | $3,200 | $1.97 | 12d | 1 | 1.30mi |
| 6880 Brook Hollow Rd Lake Worth, FL | 3.0 | 2.5 | 1428 | $2,850 | $2.00 | 24d | 1 | 1.30mi |
| 7275 Summer Tree Dr Boynton Beach, FL | 2.0 | 2.0 | 1722 | $4,300 | $2.50 | 24d | 1 | 1.31mi |
| 8481 Siciliano St Unit 8481 Boynton Beach, FL | 3.0 | 2.0 | 1774 | $3,650 | $2.06 | 24d | 1 | 1.33mi |
| 8520 Tourmaline Blvd Boynton Beach, FL | 4.0 | 2.0 | 1699 | $4,000 | $2.35 | 18d | 1 | 1.33mi |
| 9336 Water Course Way Boynton Beach, FL | 3.0 | 2.0 | 1779 | $3,600 | $2.02 | 22d | 1 | 1.46mi |
| 9336 Water Course Way Boynton Beach, FL | 3.0 | 2.0 | 1779 | $3,600 | $2.02 | 24d | 1 | 1.46mi |
HOA detail
- Monthly dues
- $519 · $6,228/yr
Listing history 11 events
-
2026-05-07status Pending
-
2026-04-24price $150,000
-
2026-03-26price $170,000
-
2026-02-27price $180,000
-
2026-02-11price $190,000
-
2026-01-07price $229,000
-
2025-12-09price $245,000
-
2025-10-23$257,500 Active
-
2022-07-14soldstatus $480,000
-
1991-12-30soldstatus $160,000
-
1987-08-01soldstatus $160,000
ⓘ Source: listings_history table (triggers on properties + properties_extension) + one-shot
backfill from property_details.listing_events for pre-trigger history.
Tax reassessment forecast FL · Resets to sale price
- Current annual tax
- $3,612 · $301/mo
- Projected year-2 tax
- $3,612 · $301/mo
- Expected delta
- $0/yr ($0/mo · 0.0%)
ⓘ Screening estimate from a state-policy table — verify with the county assessor before closing.
Climate risk First Street
- Flood 1/10 Low FEMA zone X (unshaded) · 0% chance over 30 yrs
- Wildfire 1/10 Low
- Heat 9/10 Extreme 7 d/yr ≥106°F today · 26 d/yr by 30 yrs out
- Wind 10/10 Extreme 99% chance of damaging wind over 30 yrs
- Air quality 2/10 Low 0 unhealthy d/yr today · 2 by 30 yrs out
Nearby sold comps map
Loading sold comps map…
Walkable amenities ~0.75 mi
Loading nearby amenities…
Taxation est. · year 1
- Rental income
- $42,869
- − Mortgage interest
- −$8,402
- − Property taxes
- −$3,612
- − Insurance
- −$750
- − Repairs & maintenance
- −$3,430
- − Management
- −$3,430
- − HOA
- −$6,228
- − Depreciation
- −$4,364
- Taxable income
- $12,654
- Est. tax owed @ 24.0%
- −$3,037
- After-tax cash flow
- $10,800/yr
For passive investors: Depreciation is non-cash, so a rental often shows a tax loss while cash-flowing — sheltering income. Rental losses are passive: they offset passive income freely, and up to $25,000/yr can offset ordinary (W-2) income if you actively participate and your MAGI is under $100k (phasing out to $0 by $150k); unused losses carry forward. On sale, claimed depreciation is recaptured at up to 25%, and gains may owe capital-gains tax (a 1031 exchange can defer both). Figures are a year-1 estimate at your 24.0% rate — not tax advice; consult a CPA.
Schools (NCES district)
- District
- Palm Beach
- NCES district ID
- 1201500
- Math proficiency
- 46% ▼ -16.00%
- Reading proficiency
- 53% ▼ -4.00%
- Median HH income
- $53,943
- Composite
- 42.72/100
- National rank
- #3160
- State rank
- #34 of 73 in FL
Livability — Boynton Beach
- Score
- 72/100
- State rank
- #351
- US rank
- #6098
Category grades
Schools grade is shown separately in the Schools card above.
Census & demographics
- City population
- 148,060
- Population (ZIP)
- 18,689
Population outlook (Palm Beach County) Hauer SSP2
- Today (2025)
- 1,637,487 people
- By 2030
- 1,743,255 · +6.5%
- By 2040
- 1,948,712 · +19.0%
- By 2050
- 2,132,979 · +30.3%
- By 2075
- 2,530,027 · +54.5%
- By 2100
- 2,706,979 · +65.3%
Race, ethnicity, and origin ACS 2023
- Neighborhood character
- Diverse neighborhood (Simpson 0.56)
- Race & ethnicity
- White 63% Hispanic / Latino 18% Two or more races 14% Black 10% Asian 4%
- Hispanic origin (detail)
- Mexican 2% Puerto Rican 2% Cuban 7%
- Common ancestry
- Romanian 5% Scotch-Irish 4% Hispanic 3%
- Foreign-born
- 24% · Canada, China, Jamaica
- Languages at home
- 77% English-only · Spanish 11% Other Indo-European 4% French/Haitian/Cajun 3%
Political lean MEDSL · Palm Beach
- 2024 margin
- Toss-up / Even · D 50.0% · R 49.2%
- 2008→2024 swing
- -22.1pp toward R · 2008: 22.9pp · 2024: 0.8pp
- All cycles
- 2024: D+0.8 2020: D+12.8 2016: D+15.3 2012: D+17.0 2008: D+22.9
Not yet ingested
- Civics
- —
Market trends
- HPI YoY
- ▲ 0.20%
- Current HPI
- 268.1142
- Rent YoY
- —
- Metro
- —
- State GDP YoY
- ▲ 3.28%
- F500 in state
- 36
Industry mix (Fortune 500 HQ in FL)
| Industry | F500 HQs | Revenue |
|---|---|---|
| Industrial Technology | 2 | $29B |
|
||
| Insurance | 2 | $17B |
|
||
| Retail | 1 | $60B |
|
||
| Technology Distribution | 1 | $58B |
|
||
| Homebuilding | 1 | $35B |
|
||
| Technology Manufacturing | 1 | $35B |
|
||
Price history
-6.2% since first listed11 events — show timeline
- 2026-05-07 Pending — MARMLS
- 2026-04-24 Price Changed $150,000 MARMLS
- 2026-03-26 Price Changed $170,000 MARMLS
- 2026-02-27 Price Changed $180,000 MARMLS
- 2026-02-11 Price Changed $190,000 MARMLS
- 2026-01-07 Price Changed $229,000 MARMLS
- 2025-12-09 Price Changed $245,000 MARMLS
- 2025-10-23 Listed $257,500 MARMLS
- 2022-07-14 Sold (Public Records) $480,000 Public Records
- 1991-12-30 Sold (Public Records) $160,000 Public Records
- 1987-08-01 Sold (Public Records) $160,000 Public Records
Property tax history
+7.5%/yrLatest (2025): $3,612 · +3.3% YoY. Source: county tax records.
Cash-flow waterfall
monthlySold comps — $/sqft
last 12 mo · ≤1 miLoading sold comps…