2845 E Hatch Rd #5 · Ceres, CA
Flood risk 1/10 · Minimal
- FEMA flood zone
- X (unshaded)
- Chance of flooding over 30 yrs
- 0.0%
- Est. flood insurance / yr
- $507 – $1,088
Fire risk 4/10 · Minor
- Est. fire insurance / yr
- $659 – $1,223
Heat risk 6/10 · Moderate
- Hot days now (above 102°F)
- 6 days/yr
- Hot days in 30 yrs
- 13 days/yr
Wind risk 1/10 · Minimal
- Chance of severe wind over 30 yrs
- —
Air-quality risk 10/10 · Severe
- Unhealthy air days now
- 34 days/yr
- Unhealthy air days in 30 yrs
- 37 days/yr
Risk factors via First Street. Map © Google.
Why this score? — see what drove the B+ grade
The composite is a weighted blend of 9 inputs, each scored 0–100. Each bar is that input's sub-score; the figure is the points it added to the 100-point composite (weight × sub-score).
- Cash flow +30.0/30.0
- ARV discount +15.0/15.0
- 1% rule +10.0/10.0
- DSCR +10.0/10.0
- Condition / age +4.0/5.0
- Schools +2.8/10.0
- Livability +2.7/5.0
- Rent growth +2.5/5.0
- Appreciation +0.0/10.0
$95,000
🖨 Deal sheet 📄 Offer letter ✓ Due diligence
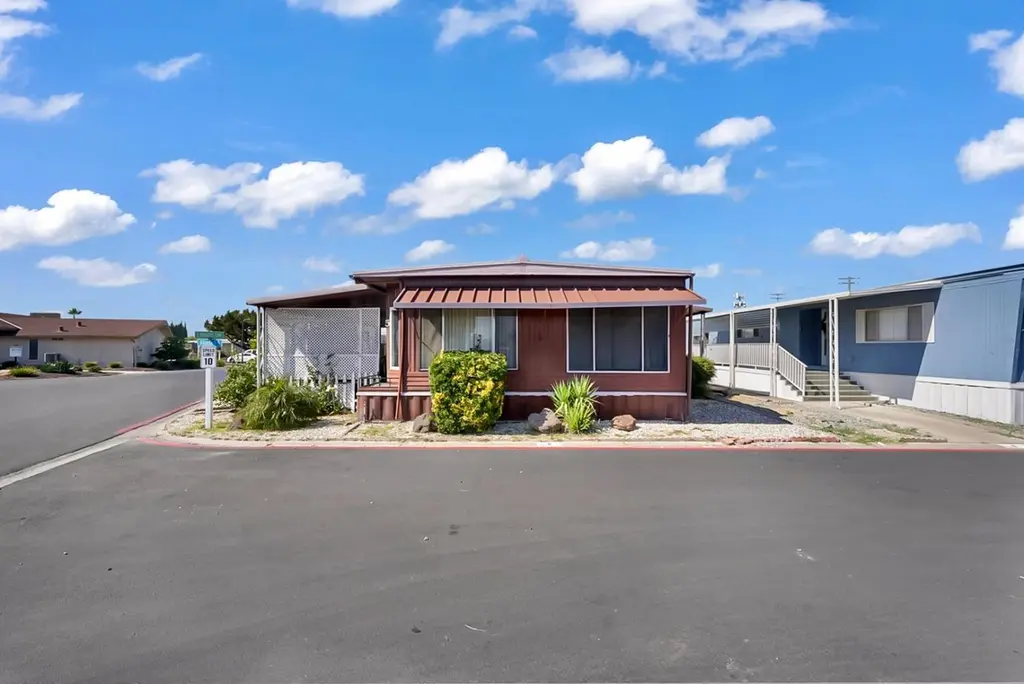
Listing remarks
Spacious double-wide mobile home located in an all-ages community! This well-designed home features two separate living areas, offering plenty of space for entertaining or everyday living. Enjoy the covered patio/porch, perfect for relaxing or hosting gatherings year-round. The large primary bedroom includes a double sink vanity and a soaking tub, adding comfort and convenience. With a functional layout and generous space throughout, this home is a must see!
Key facts
- Soaking tub
- Covered patio
- Double sink vanity
Tags
Property features AI
Finance
- Other: Located near Mitchell Rd; address 2845 E Hatch Rd #5, Modesto, CA 95351
- Financial info: Land lease: No
- HOA & community: No homeowners association; Not a senior community
Exterior
- Parking: Covered parking; Deck parking; Guest parking available
- Utilities: Public water; Public sewer; Cable available; Internet available; 220-volt outlet in laundry
- Home design: Manufactured in park; Double wide; Built in 1970
- Construction: Metal skirting; Lakewood manufactured home
- Exterior features: Corner location; Close to clubhouse; Roof: see remarks
Interior
- Kitchen: Built-in electric oven; Built-in gas range; Range hood
- Bedrooms: Two bedrooms
- Flooring: Vinyl
- Bathrooms: Two full bathrooms; Jetted tub; Shower stall(s)
- Heating & cooling: Wall units; Window units; Other heating
- Interior features: Laminate countertops; Dining and family room combined; Living room with flexible/other features
- Laundry & utility: Indoor laundry room; Gas hookup in laundry
Neighborhood map
What this means for you Summary
Snapshot
- This is a 2-bed/2.0-bath manufactured listed at $95k. Condition is rated good.
Deal economics
- At list price, monthly cash flow is $1k ($14k/yr) — positive.
- The deal already cash-flows at list — no discount required.
- Meets the 1% rule at list price ($2k rent vs $95k).
- Recommended offer: $92k (3.0% below list) — sets the bar for market timing.
- Cap rate 21.5% vs local median 3.8% in Ceres — top-decile yield for the area; either an underpriced asset or a hidden risk that comps aren't pricing in. Stress-test before assuming the spread holds.
Location & tenants
- Location reads 54/100 on livability (#923 in CA) — a working-class tenant base; expect higher turnover. Strengths: housing A+; Watch: employment C-, crime D+, schools D-.
- Ceres Unified (suburban): math 15% / reading 50% proficiency, ranked #303 of 517 in CA (top 59%) — families likely to look elsewhere, expect single-tenant / working-renter base with shorter leases; 69% free/reduced lunch — lower-income household profile, screen leases tightly.
- Market conditions: 109 active listings in the ZIP; 5 comparable units currently listed for rent nearby; rentals at typical pace (median 21d on market — plan ~3-4 weeks tenant-placement turnaround); 923 units permitted in Stanislaus County in 2024 (63 in 5+ unit buildings).
- At $2,360/mo this rent would consume 49% of the median local household income ($58k/yr) (locally 1964% of renters already pay >50% of income on rent) — very limited rent-growth headroom before tenants either downsize or default.
Forward outlook
- Local home prices are declining (-3.0%/yr); year-one equity from $657 of loan paydown is wiped out by about $3k of value loss. Plan a longer hold.
- Stanislaus County population projected at +14% by 2050 — modest demand growth; plan on rents tracking national, not racing it.
- At projected returns (-3.0% appreciation + 3.0% rent growth), your $27k cash investment doubles in ~3 years — after that, you're playing with house money.
Negotiation context
- It's been on market 34 days — a 3% lower offer ($92k) is reasonable based on typical stale-listing flexibility.
Risks & watch-outs
- Climate carrying-cost: extreme-heat days projected 6→13/yr by 2055 (HVAC capex compounding) — expect insurance premiums to compound above CPI over the hold.
Questions for the listing agent
- It's been on market 34 days. Have you received any prior offers? Is the seller open to a 3% concession, seller financing, or rate buy-down credit?
- Built in 1970 — when were the roof, HVAC, electrical panel, plumbing, and water heater last replaced?
- Is there a deadline driving the sale (1031 exchange, divorce, estate, relocation)? That informs how much negotiation room exists.
- Schools are D-rated, which usually means shorter tenancies and higher turnover. Who's the typical renter profile here, and what's been the actual vacancy rate?
- Crime grade is D in this area — have there been break-ins, vandalism, or insurance claims at this property in the last 3 years? What carrier currently insures it and at what premium?
- What's the average days-on-market for RENTAL listings here right now (not sales)? A rising rental-DOM trend means longer vacancies and softer asking-rent achievability than the comps imply.
- What's the recent tenant-quality profile in this submarket — average credit score on applications, eviction rate, late-payment / NSF rate, and stable-employment percentage? A property-management company in the area should have these aggregated.
- How much new for-sale + rental construction is in the pipeline within 1–3 miles? Heavy new supply typically softens prices + rents 12–24 months out; constrained supply supports both.
Investment metrics
- 1% rule
- 2.48% ✓
- Cap rate
- 21.55%
- Cash-on-cash
- 54.49%
- DSCR
- 3.42
- GRM
- 3.4
CMA / ARV
- ARV (median comp)
- $128,000
- List price
- $95,000
- Delta
- -25.78%
- Verdict
- UNDERPRICED
- Comps
- 7 within 1.0 mi
Show comp detail 6 sales within ~0.75 mi
| Address | Dist | Beds/Ba | Sqft | Sold | Price | $/sf | Match |
|---|---|---|---|---|---|---|---|
| 2845 E Hatch Rd #78 | 0.05mi | 2/2.0 | 1,440 (-6%) | 3mo | $67,500 | $47 | 85 |
| 2845 E Hatch Rd #84 | 0.00mi | 3/2.0 (+1) | 1,440 (-6%) | 1mo | $128,000 | $89 | 84 |
| 2845 E Hatch Rd #71 | 0.05mi | 3/2.0 (+1) | 1,440 (-6%) | 22mo | $110,000 | $76 | 64 |
| 2845 E Hatch Rd #44 | 0.07mi | 3/2.0 (+1) | 1,400 (-9%) | 23mo | $160,000 | $114 | 58 |
| 2841 Fowler #37 | 0.55mi | 2/2.0 | 1,440 (-6%) | 9mo | $105,000 | $73 | 57 |
| 2841 Fowler #141 | 0.55mi | 3/2.0 (+1) | 1,620 (+6%) | 12mo | $185,000 | $114 | 50 |
Match score weights: distance 35% · size 25% · config 20% · recency 20%. Top-matched comps best support the ARV.
Projected returns pro-forma
-3.0% appreciation · 3.0% rent growth · sell at horizon
- IRR
- 52.7%
- Equity multiple
- 3.31×
- Total profit
- $61,566
- Equity at exit
- $14,165
- IRR
- 57.9%
- Equity multiple
- 6.74×
- Total profit
- $152,808
- Equity at exit
- $8,214
Cash invested: $26,600 (down + closing). Projections, not guarantees.
Landlord ↔ Tenant lean methodology
- Overall (STATE)
- 18 Strongly Tenant-Friendly
- State California
- 18 Strongly Tenant-Friendly · D+13
- County
- — inherits STATE
- City
- — inherits STATE
ZIP-level market 95351
- Active inventory
- 109
- Price-to-rent
- 3.4×
Monthly cashflow live
- Estimated rent
- $2,360 medium interval (Pro) →
- Mortgage (P&I)
- −$498
- Tax est. 1.5%
- −$119 /mo · $1,425/yr
- Insurance
- −$40
- HOA
- −$0
- Vacancy / Maint / Mgmt
- −$496
- Net cashflow
- $1,208
Break-even live
UW: 25.0% down · 7.5% · 30yr · 1.5% tax · 5.0% vac · 8.0% maint · 8.0% mgmt
Financing live
Cash to close
- Down payment
- $23,750
- Closing costs
- $2,850
- Reserves months
- —
- Total cash needed
- —
Loan-product check · same deal, 3 products live
Conventional
25% down · 7.5% · 30yr
- Down + closing
- —
- Monthly P&I
- —
- Monthly cashflow
- —
- DSCR
- —
- Eligible?
- —
Personal DTI + credit; lowest rate.
DSCR
20% down · 8.5% · 30yr
- Down + closing
- —
- Monthly P&I
- —
- Monthly cashflow
- —
- DSCR
- —
- Eligible?
- —
No personal income docs; deal must DSCR.
Hard money
10% down · 12.0% · 12mo
- Down + closing
- —
- Monthly P&I
- —
- Monthly cashflow
- —
- DSCR
- —
- Eligible?
- —
Short-term bridge; refi at stabilization.
Rent comps 5 comps
| Address | Beds | Baths | Sqft | Rent | $/sqft | DOM | Units | Dist |
|---|---|---|---|---|---|---|---|---|
| 2808 Canyon Dr Modesto, CA | 3.0 | 2.0 | 1366 | $2,495 | $1.83 | 21d | 1 | 0.21mi |
| 2685 Parkway Ceres, CA | 2.0 | 2.0 | 1150 | $795 | $0.69 | 43d | 1 | 0.35mi |
| 1120 Landreth Ct Modesto, CA | 3.0 | 2.0 | 1559 | $3,395 | $2.18 | 13d | 1 | 0.53mi |
| 2232 Ridgeway Dr Ceres, CA | 3.0 | 2.0 | 1432 | $2,295 | $1.60 | 13d | 1 | 0.72mi |
| 2029 Venus Dr Ceres, CA | 3.0 | 2.0 | 1336 | $2,500 | $1.87 | 23d | 1 | 0.79mi |
Listing history 17 events
-
2026-06-18days on market $95,000 Active 34 DOM
-
2026-06-18price $95,000 Active 33 DOM
-
2026-06-17days on market $105,000 Active 33 DOM
-
2026-06-16days on market $105,000 Active 32 DOM
-
2026-06-15days on market $105,000 Active 31 DOM
-
2026-06-14days on market $105,000 Active 29 DOM
-
2026-06-13days on market $105,000 Active 28 DOM
-
2026-06-10days on market $105,000 Active 26 DOM
-
2026-06-09days on market $105,000 Active 25 DOM
-
2026-06-08days on market $105,000 Active 24 DOM
-
2026-06-07days on market $105,000 Active 23 DOM
-
2026-06-05days on market $105,000 Active 20 DOM
-
2026-06-03days on market $105,000 Active 19 DOM
-
2026-06-02pricedays on market $105,000 Active 18 DOM
-
2026-06-01days on market $115,000 Active 17 DOM
-
2026-05-31days on market $115,000 Active 16 DOM
-
2026-05-30days on market $115,000 Active 15 DOM
ⓘ Source: listings_history table (triggers on properties + properties_extension) + one-shot
backfill from property_details.listing_events for pre-trigger history.
Climate risk First Street
- Flood 1/10 Low FEMA zone X (unshaded) · 0% chance over 30 yrs
- Wildfire 4/10 Moderate
- Heat 6/10 Major 6 d/yr ≥102°F today · 13 d/yr by 30 yrs out
- Wind 1/10 Low
- Air quality 10/10 Extreme 34 unhealthy d/yr today · 37 by 30 yrs out
Nearby sold comps map
Loading sold comps map…
Walkable amenities ~0.75 mi
Loading nearby amenities…
Taxation est. · year 1
- Rental income
- $28,319
- − Mortgage interest
- −$5,321
- − Property taxes
- −$1,425
- − Insurance
- −$475
- − Repairs & maintenance
- −$2,265
- − Management
- −$2,265
- − Depreciation
- −$2,764
- Taxable income
- $13,803
- Est. tax owed @ 24.0%
- −$3,313
- After-tax cash flow
- $11,181/yr
For passive investors: Depreciation is non-cash, so a rental often shows a tax loss while cash-flowing — sheltering income. Rental losses are passive: they offset passive income freely, and up to $25,000/yr can offset ordinary (W-2) income if you actively participate and your MAGI is under $100k (phasing out to $0 by $150k); unused losses carry forward. On sale, claimed depreciation is recaptured at up to 25%, and gains may owe capital-gains tax (a 1031 exchange can defer both). Figures are a year-1 estimate at your 24.0% rate — not tax advice; consult a CPA.
Condition & rehab AI · 6 photos
This well-maintained double-wide mobile home in an all-ages community offers spacious living areas and a functional layout. A fresh coat of paint on the exterior trim and cleaning the gutters would significantly enhance its curb appeal and value.
Value-add opportunities
- Both Paint exterior trim — Enhances curb appeal and value
- Both Clean gutters — Improves drainage and prevents water damage
Renovation cost estimate screening
Value-add ROI direction
- Both Paint exterior trim — Enhances curb appeal and value ↑
- Both Clean gutters — Improves drainage and prevents water damage ↑
ⓘ Cost ranges are severity-bucket heuristics (US national rule-of-thumb). Get contractor quotes + a written scope before underwriting a rehab budget.
Schools (NCES district)
- District
- Ceres Unified
- NCES district ID
- 0608130
- Math proficiency
- 15% ▼ -9.00%
- Reading proficiency
- 50% ▲ 12.00%
- Median HH income
- $48,178
- Composite
- 27.96/100
- National rank
- #6858
- State rank
- #303 of 517 in CA
Livability — Ceres
- Score
- 54/100
- State rank
- #923
- US rank
- #24224
Category grades
Schools grade is shown separately in the Schools card above.
Census & demographics
- Census place
- Ceres, CA
- County
- Stanislaus County · 445,786 people
- City population
- 46,310
- Metro
- Modesto, CA
- Population (ZIP)
- 48,498
- Household income
- $58,275
- Rent vs Own
- Severe rent burden
- 1964.0
Population outlook (Stanislaus County) Hauer SSP2
- Today (2025)
- 579,493 people
- By 2030
- 598,000 · +3.2%
- By 2040
- 630,930 · +8.9%
- By 2050
- 658,300 · +13.6%
- By 2075
- 712,363 · +22.9%
- By 2100
- 719,805 · +24.2%
Race, ethnicity, and origin ACS 2023
- Neighborhood character
- Predominantly Hispanic (76%)
- Race & ethnicity
- Hispanic / Latino 76% Two or more races 40% White 13% Asian 5% Black 3% Native American 2%
- Hispanic origin (detail)
- Mexican 72%
- Common ancestry
- Russian 1% Lithuanian 1% Slovak 1%
- Foreign-born
- 30% · Canada
- Languages at home
- 34% English-only · Spanish 62% Other Asian/Pacific 2% Other Indo-European 1%
Political lean MEDSL · Stanislaus
- 2024 margin
- R (+11.0) · D 43.2% · R 54.2% · Other 2.6%
- 2008→2024 swing
- -12.7pp toward R · 2008: 1.7pp · 2024: -11.0pp
- All cycles
- 2024: R+11.0 2020: D+0.8 2016: D+0.6 2012: D+0.7 2008: D+1.7
Not yet ingested
- Civics
- —
Market trends
- HPI YoY
- ▼ -405.77%
- Current HPI
- 360.246
- Rent YoY
- —
- Metro
- Modesto, CA
- State GDP YoY
- ▲ 3.21%
- F500 in state
- 116
Industry mix (Fortune 500 HQ in CA)
| Industry | F500 HQs | Revenue |
|---|---|---|
| Technology | 27 | $1,492B |
|
||
| Financial Services | 3 | $174B |
|
||
| Retail | 3 | $44B |
|
||
| Insurance | 3 | $26B |
|
||
| Media / Entertainment | 2 | $115B |
|
||
| Pharmaceuticals / Biotech | 2 | $62B |
|
||
Cash-flow waterfall
monthlySold comps — $/sqft
last 12 mo · ≤1 miLoading sold comps…