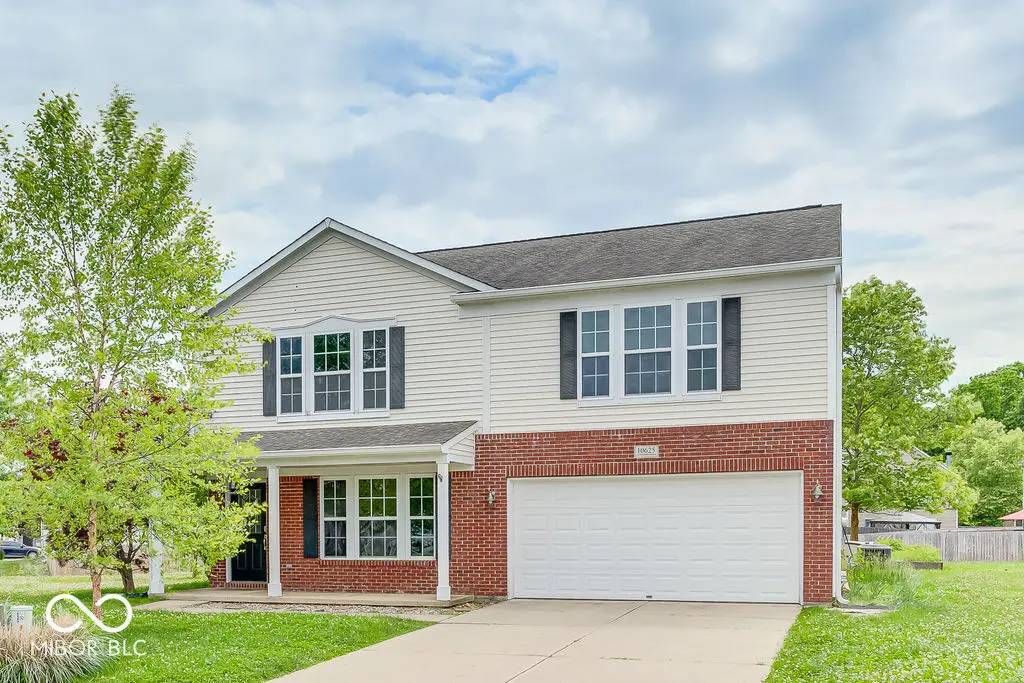
10625 Gathering Dr · Indianapolis city (balance), IN
Flood risk 1/10 · Minimal
- FEMA flood zone
- X (unshaded)
- Chance of flooding over 30 yrs
- 0.0%
- Est. flood insurance / yr
- $507 – $1,088
Fire risk 1/10 · Minimal
- Est. fire insurance / yr
- $717 – $1,331
Heat risk 4/10 · Minor
- Hot days now (above 101°F)
- 7 days/yr
- Hot days in 30 yrs
- 20 days/yr
Wind risk 2/10 · Minimal
- Chance of severe wind over 30 yrs
- 1.0%
Air-quality risk 2/10 · Minimal
- Unhealthy air days now
- 1 days/yr
- Unhealthy air days in 30 yrs
- 2 days/yr
Risk factors via First Street. Map © Google.
Why this score? — see what drove the D- grade
The composite is a weighted blend of 9 inputs, each scored 0–100. Each bar is that input's sub-score; the figure is the points it added to the 100-point composite (weight × sub-score).
- Cash flow +13.8/30.0
- ARV discount +4.8/15.0
- DSCR +4.2/10.0
- Schools +4.0/10.0
- 1% rule +3.5/10.0
- Rent growth +2.5/5.0
- Livability +2.5/5.0
- Condition / age +2.5/5.0
- Appreciation +0.0/10.0
$300,000
🖨 Deal sheet 📄 Offer letter ✓ Due diligence
Listing remarks MLS
This 4 bedroom, 2.5 bath home offers an open-concept layout, perfect for comfortable living and entertaining. The upstairs loft provides extra flexibility-ideal for a home office, playroom or extra lounge space. Step outside and enjoy one of the largest yards in the neighborhood-perfect for volleyball, football, outdoor gatherings or simply relaxing. The property boasts great curb appeal and space to shoot hoops out front. Located in a quiet community just about 10 minutes from downtown Indianapolis and convenient shopping, this home offers the perfect balance of peace and accessibility.
Key facts
- Expansive backyard
- 0.31 acre lot
- 2 garage spots
Tags
Property features AI
Finance
- Other: Lot size approximately 0.31 acre; Ownership interest: Mandatory fee
- HOA & community: HOA with quarterly fee of $115; HOA maintains walking trails
Exterior
- Parking: Attached 2-car garage (approximately 380 sq ft)
- Utilities: Public water; Municipal sewer connected
- Home design: Single family residence (attached property); Two levels
- Construction: Vinyl with brick exterior; Slab foundation
- Exterior features: Covered patio
Interior
- Kitchen: Dishwasher; Microwave; Gas oven; Refrigerator; Eat-in kitchen with pantry
- Bedrooms: Primary bedroom with walk-in closet; Four bedrooms on upper level
- Bathrooms: Two full baths (upper level); One half bath (main level)
- Heating & cooling: High-efficiency furnace (90%+ AFUE); Central air conditioning
- Interior features: Attic access; Eat-in kitchen; Pantry; Walk-in closet(s); Central air; High-efficiency heating (90%+ AFUE)
- Laundry & utility: Main level laundry
Neighborhood map
What this means for you Summary
Snapshot
- This is a 4-bed/2.5-bath single-family listed at $300k.
Deal economics
- At list price, monthly cash flow is $25 ($300/yr) — positive.
- The deal already cash-flows at list — no discount required.
- To meet the 1% rule (rent ≥ 1% of price), the offer needs to be $254k (15.3% below list).
- Recommended offer: $254k (15.3% below list) — sets the bar for 1% rule.
- Cap rate 6.4% vs local median 4.4% in Indianapolis city (balance) — top-decile yield for the area; either an underpriced asset or a hidden risk that comps aren't pricing in. Stress-test before assuming the spread holds.
Location & tenants
- Location reads: area grade D — affects rentability + tenant quality, not the cash-flow math above.
- Franklin Township Community School Corporation (urban): math 42% / reading 47% proficiency, ranked #87 of 301 in IN (top 29%) — families likely to look elsewhere, expect single-tenant / working-renter base with shorter leases.
- Market conditions: 159 active listings in the ZIP; 1 comparable units currently listed for rent nearby; high-income renter base; 1,906 units permitted in Marion County in 2024 (621 in 5+ unit buildings).
Forward outlook
- Local home prices are declining (-3.0%/yr); year-one equity from $2k of loan paydown is wiped out by about $9k of value loss. Plan a longer hold.
- Marion County population projected at +18% by 2050 — long-run rental-demand tailwind backs the buy-and-hold thesis.
Negotiation context
- Only 13 days on market — expect competitive offers; lowballing is unlikely to land.
- 4 sale attempts since 6y ago with the ask held roughly flat each time — persistent listings suggest the price (not the market) is what's stuck; bring a comps-based counter.
Questions for the listing agent
- What does the HOA fee cover, when was the last increase, and are there any pending special assessments or reserve-fund shortfalls?
- Is there a deadline driving the sale (1031 exchange, divorce, estate, relocation)? That informs how much negotiation room exists.
- The area grade is low — what's the realistic commute time and amenity access for the typical tenant pool here? Any planned neighborhood developments (good or bad) we should know about?
- What's the average days-on-market for RENTAL listings here right now (not sales)? A rising rental-DOM trend means longer vacancies and softer asking-rent achievability than the comps imply.
- What's the recent tenant-quality profile in this submarket — average credit score on applications, eviction rate, late-payment / NSF rate, and stable-employment percentage? A property-management company in the area should have these aggregated.
- How much new for-sale + rental construction is in the pipeline within 1–3 miles? Heavy new supply typically softens prices + rents 12–24 months out; constrained supply supports both.
Investment metrics
- 1% rule
- 0.85% ✗
- Cap rate
- 6.39%
- Cash-on-cash
- 0.36%
- DSCR
- 1.02
- GRM
- 9.8
CMA / ARV
- ARV (on-the-fly)
- $282,920
- Comps found
- 12
Show comp detail 12 sales within ~0.75 mi
| Address | Dist | Beds/Ba | Sqft | Sold | Price | $/sf | Match |
|---|---|---|---|---|---|---|---|
| 10625 Gathering Dr | 0.00mi | 4/2.5 | 2,572 (0%) | 12mo | $295,900 | $115 | 90 |
| 8158 Retreat Ln | 0.06mi | 3/2.5 (-1) | 2,687 (+4%) | 6mo | $295,000 | $110 | 79 |
| 10708 Inspiration Dr | 0.14mi | 4/2.5 | 2,615 (+2%) | 14mo | $285,000 | $109 | 79 |
| 10905 Inspiration Dr | 0.32mi | 4/2.5 | 2,637 (+2%) | 3mo | $290,000 | $110 | 78 |
| 8147 Retreat Ln | 0.03mi | 4/2.5 | 2,354 (-8%) | 10mo | $285,000 | $121 | 76 |
| 8238 Crackling Ln | 0.16mi | 3/2.5 (-1) | 2,430 (-6%) | 12mo | $275,000 | $113 | 68 |
| 7950 Crackling Ln | 0.22mi | 3/2.5 (-1) | 2,707 (+5%) | 10mo | $300,500 | $111 | 68 |
| 8243 Retreat Ln | 0.12mi | 3/2.5 (-1) | 2,842 (+10%) | 6mo | $275,000 | $97 | 67 |
| 10841 Maze Rd | 0.46mi | 4/2.0 | 2,405 (-6%) | 3mo | $355,000 | $148 | 64 |
| 8220 Firefly Way | 0.31mi | 4/2.5 | 2,669 (+4%) | 22mo | $285,000 | $107 | 61 |
| 10808 Inspiration Dr | 0.21mi | 4/2.5 | 2,842 (+10%) | 16mo | $282,000 | $99 | 59 |
| 10946 Maze Rd | 0.46mi | 4/3.0 | 2,219 (-14%) | 10mo | $225,000 | $101 | 45 |
Match score weights: distance 35% · size 25% · config 20% · recency 20%. Top-matched comps best support the ARV.
Projected returns pro-forma
-3.0% appreciation · 3.0% rent growth · sell at horizon
- IRR
- -15.7%
- Equity multiple
- 0.44×
- Total profit
- $-47,040
- Equity at exit
- $44,731
- IRR
- -7.3%
- Equity multiple
- 0.54×
- Total profit
- $-38,985
- Equity at exit
- $25,939
Cash invested: $84,000 (down + closing). Projections, not guarantees.
Landlord ↔ Tenant lean methodology
- Overall (STATE)
- 90 Strongly Landlord-Friendly
- State Indiana
- 90 Strongly Landlord-Friendly · R+11
- County
- — inherits STATE
- City
- — inherits STATE
ZIP-level market 46259
- Home prices YoY
- -26.8%
- Active inventory
- 159
- Price-to-rent
- 9.8×
Monthly cashflow live
- Estimated rent
- $2,541 medium interval (Pro) →
- Mortgage (P&I)
- −$1,573
- Tax from tax record
- −$246 /mo · $2,954/yr
- Insurance
- −$125
- HOA
- −$38
- Vacancy / Maint / Mgmt
- −$534
- Net cashflow
- $25
Break-even live
UW: 25.0% down · 7.5% · 30yr · 1.5% tax · 5.0% vac · 8.0% maint · 8.0% mgmt
Financing live
Cash to close
- Down payment
- $75,000
- Closing costs
- $9,000
- Reserves months
- —
- Total cash needed
- —
Loan-product check · same deal, 3 products live
Conventional
25% down · 7.5% · 30yr
- Down + closing
- —
- Monthly P&I
- —
- Monthly cashflow
- —
- DSCR
- —
- Eligible?
- —
Personal DTI + credit; lowest rate.
DSCR
20% down · 8.5% · 30yr
- Down + closing
- —
- Monthly P&I
- —
- Monthly cashflow
- —
- DSCR
- —
- Eligible?
- —
No personal income docs; deal must DSCR.
Hard money
10% down · 12.0% · 12mo
- Down + closing
- —
- Monthly P&I
- —
- Monthly cashflow
- —
- DSCR
- —
- Eligible?
- —
Short-term bridge; refi at stabilization.
Rent comps 1 comps
| Address | Beds | Baths | Sqft | Rent | $/sqft | DOM | Units | Dist |
|---|---|---|---|---|---|---|---|---|
| 8234 Gathering Cir Indianapolis, IN | 3.0 | 2.5 | 2110 | $2,200 | $1.04 | 2d | 1 | 0.26mi |
HOA detail
- Monthly dues
- $38 · $456/yr
Listing history 9 events
-
2026-06-18days on market $300,000 Active 13 DOM
-
2026-06-17days on market $300,000 Active 12 DOM
-
2026-06-16days on market $300,000 Active 11 DOM
-
2026-06-15days on market $300,000 Active 10 DOM
-
2026-06-13days on market $300,000 Active 8 DOM
-
2026-06-09days on market $300,000 Active 4 DOM
-
2026-06-08days on market $300,000 Active 3 DOM
-
2026-06-07remarks 699-char remark
-
2026-06-07$300,000 Active 2 DOM
ⓘ Source: listings_history table (triggers on properties + properties_extension) + one-shot
backfill from property_details.listing_events for pre-trigger history.
Tax reassessment forecast IN · Partial reset (capped growth)
- Current annual tax
- $2,954 · $246/mo
- Projected year-2 tax
- $2,954 · $246/mo
- Expected delta
- $0/yr ($0/mo · 0.0%)
ⓘ Screening estimate from a state-policy table — verify with the county assessor before closing.
Climate risk First Street
- Flood 1/10 Low FEMA zone X (unshaded) · 0% chance over 30 yrs
- Wildfire 1/10 Low
- Heat 4/10 Moderate 7 d/yr ≥101°F today · 20 d/yr by 30 yrs out
- Wind 2/10 Low 100% chance of damaging wind over 30 yrs
- Air quality 2/10 Low 1 unhealthy d/yr today · 2 by 30 yrs out
Nearby sold comps map
Loading sold comps map…
Walkable amenities ~0.75 mi
Loading nearby amenities…
Taxation est. · year 1
- Rental income
- $30,492
- − Mortgage interest
- −$16,805
- − Property taxes
- −$2,954
- − Insurance
- −$1,500
- − Repairs & maintenance
- −$2,439
- − Management
- −$2,439
- − HOA
- −$456
- − Depreciation
- −$8,727
- Taxable loss
- −$4,829
- Est. tax savings @ 24.0%
- +$1,159
- After-tax cash flow
- $1,459/yr
For passive investors: Depreciation is non-cash, so a rental often shows a tax loss while cash-flowing — sheltering income. Rental losses are passive: they offset passive income freely, and up to $25,000/yr can offset ordinary (W-2) income if you actively participate and your MAGI is under $100k (phasing out to $0 by $150k); unused losses carry forward. On sale, claimed depreciation is recaptured at up to 25%, and gains may owe capital-gains tax (a 1031 exchange can defer both). Figures are a year-1 estimate at your 24.0% rate — not tax advice; consult a CPA.
Schools (NCES district)
- District
- Franklin Township Community School Corporation
- NCES district ID
- 1803750
- Math proficiency
- 42% ▼ -12.00%
- Reading proficiency
- 47% ▼ -6.00%
- Median HH income
- $67,825
- Composite
- 39.91/100
- National rank
- #3852
- State rank
- #87 of 301 in IN
Livability — Indianapolis city (balance)
No livability data for this city. (Only ~50 U.S. cities are tracked.)
Census & demographics
- Census place
- Indianapolis city (balance), IN
- County
- Marion County · 998,460 people
- City population
- 881,119
- Metro
- Indianapolis-Carmel-Anderson, IN
- Population (ZIP)
- 15,169
- Household income
- $129,345
- Rent vs Own
- Severe rent burden
- 78.0
Population outlook (Marion County) Hauer SSP2
- Today (2025)
- 1,025,572 people
- By 2030
- 1,065,727 · +3.9%
- By 2040
- 1,141,577 · +11.3%
- By 2050
- 1,208,920 · +17.9%
- By 2075
- 1,367,288 · +33.3%
- By 2100
- 1,438,201 · +40.2%
Race, ethnicity, and origin ACS 2023
- Neighborhood character
- Predominantly White (79%)
- Race & ethnicity
- White 79% Two or more races 9% Asian 8% Hispanic / Latino 7%
- Hispanic origin (detail)
- Mexican 5%
- Common ancestry
- Slovak 4% Lithuanian 4% Italian 3%
- Foreign-born
- 7% · Canada, Dominican Republic
- Languages at home
- 89% English-only · Other Indo-European 8% Spanish 2% Tagalog/Filipino 1%
Political lean MEDSL · Marion
- 2024 margin
- Strong D (+27.7) · D 63.0% · R 35.3% · Other 1.7%
- 2008→2024 swing
- -0.7pp no change · 2008: 28.4pp · 2024: 27.7pp
- All cycles
- 2024: D+27.7 2020: D+29.1 2016: D+22.8 2012: D+22.2 2008: D+28.4
Not yet ingested
- Civics
- —
Market trends
- HPI YoY
- ▼ -86.96%
- Current HPI
- 237.9165
- Rent YoY
- —
- Metro
- Indianapolis-Carmel-Anderson, IN
- State GDP YoY
- ▲ 2.90%
- F500 in state
- 18
Industry mix (Fortune 500 HQ in IN)
| Industry | F500 HQs | Revenue |
|---|---|---|
| Industrial Machinery | 2 | $37B |
|
||
| Healthcare | 1 | $177B |
|
||
| Pharmaceuticals | 1 | $45B |
|
||
| Metals / Steel | 1 | $18B |
|
||
| Agriculture | 1 | $17B |
|
||
| Packaging | 1 | $12B |
|
||
Price history
+62.2% since first listed10 events — show timeline
- 2026-06-05 Listed $300,000 MIBOR as Distributed by MLS Grid
- 2025-06-12 Sold (MLS) $295,900 MIBOR as Distributed by MLS Grid
- 2025-05-14 Pending — MIBOR as Distributed by MLS Grid
- 2025-04-30 Listed $298,900 MIBOR as Distributed by MLS Grid
- 2023-06-28 Price Changed $295,500 MIBOR as Distributed by MLS Grid
- 2023-06-09 Price Changed $300,000 MIBOR as Distributed by MLS Grid
- 2023-05-20 Listed $311,200 MIBOR as Distributed by MLS Grid
- 2020-05-08 Sold (MLS) $193,500 MIBOR as Distributed by MLS Grid
- 2020-04-01 Pending — MIBOR as Distributed by MLS Grid
- 2020-03-29 Listed $185,000 MIBOR as Distributed by MLS Grid
Property tax history
+6.7%/yrLatest (2025): $2,954 · -4.5% YoY. Source: county tax records.
Cash-flow waterfall
monthlySold comps — $/sqft
last 12 mo · ≤1 miLoading sold comps…