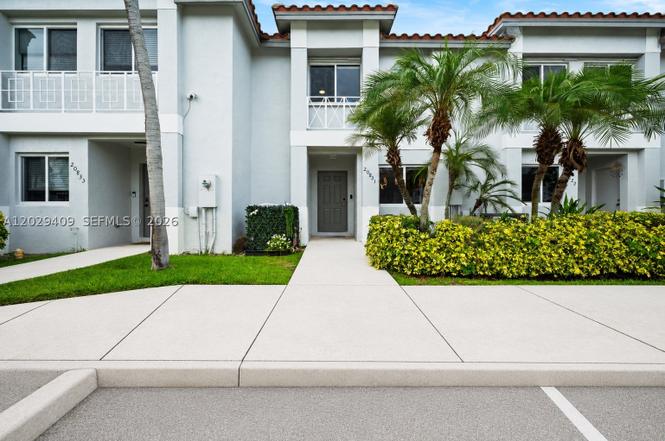
20831 NW 3rd Ct · Pembroke Pines, FL
Flood risk 1/10 · Minimal
- FEMA flood zone
- X (shaded)
- Chance of flooding over 30 yrs
- 0.0%
- Est. flood insurance / yr
- $507 – $1,088
Fire risk 5/10 · Moderate
- Est. fire insurance / yr
- $947 – $1,759
Heat risk 9/10 · Severe
- Hot days now (above 107°F)
- 7 days/yr
- Hot days in 30 yrs
- 26 days/yr
Wind risk 10/10 · Severe
- Chance of severe wind over 30 yrs
- 99.0%
Air-quality risk 2/10 · Minimal
- Unhealthy air days now
- 1 days/yr
- Unhealthy air days in 30 yrs
- 2 days/yr
Risk factors via First Street. Map © Google.
Why this score? — see what drove the D- grade
The composite is a weighted blend of 9 inputs, each scored 0–100. Each bar is that input's sub-score; the figure is the points it added to the 100-point composite (weight × sub-score).
- Cash flow +11.4/30.0
- ARV discount +7.5/15.0
- Livability +4.2/5.0
- Schools +4.1/10.0
- 1% rule +3.9/10.0
- DSCR +3.3/10.0
- Condition / age +2.5/5.0
- Rent growth +2.2/5.0
- Appreciation +0.0/10.0
$390,000
🖨 Deal sheet 📄 Offer letter ✓ Due diligence
Listing remarks MLS
Beautiful townhouse in the best school area, gated community with club house. No short sale or foreclosure. 2 Bedrooms and 2.5 Bathrooms
Key facts
- Brand new roof
- Updated kitchen
- Enclosed patio
Tags
Property features AI
Finance
- Other: In-ground community pool
- HOA & community: Monthly association fee; HOA covers common area maintenance and grounds maintenance; Community pool; Community pickleball courts; Sidewalks
Exterior
- Parking: Guest parking available
- Utilities: Public water; Public sewer
- Home design: Single-story home; Faces northwest; Planned Unit Development (PUD)
- Construction: Block construction; Shingle roof; Resale home
- Exterior features: Fenced yard; Patio
Interior
- Kitchen: Electric range; Microwave; Dishwasher; Refrigerator
- Bedrooms: Main-level bedroom
- Flooring: Tile
- Bathrooms: 2 full bathrooms; 1 half bathroom
- Heating & cooling: Central heating; Central air conditioning
- Interior features: Bedroom on main level; First floor entry; Combined living and dining area; Family room
- Laundry & utility: Washer; Dryer
Neighborhood map
What this means for you Summary
Snapshot
- This is a 2-bed/2.5-bath single-family listed at $390k.
Deal economics
- At list price, monthly cash flow is $-135 ($-2k/yr) — negative.
- To cash-flow at today's rent, offer at most $366k (6.1% below list).
- To meet the 1% rule (rent ≥ 1% of price), the offer needs to be $347k (11.0% below list).
- Recommended offer: $347k (11.0% below list) — sets the bar for 1% rule.
- Cap rate 5.9% vs local median 4.0% in Pembroke Pines — top-decile yield for the area; either an underpriced asset or a hidden risk that comps aren't pricing in. Stress-test before assuming the spread holds.
Location & tenants
- Location reads 83/100 on livability (#54 in FL, #933 nationally) — a professional / high-income tenant draw. Strengths: housing A+, health & safety A+, schools A-; Watch: amenities D+, cost of living D+.
- Broward (suburban): math 42% / reading 53% proficiency, ranked #46 of 73 in FL (top 63%) — families likely to look elsewhere, expect single-tenant / working-renter base with shorter leases.
- Market conditions: Rents soft (-1.2%/yr); 240 active listings in the ZIP; 9 comparable units currently listed for rent nearby; rentals at typical pace (median 24d on market — plan ~3-4 weeks tenant-placement turnaround); high-income renter base; 2,111 units permitted in Broward County in 2024 (1,265 in 5+ unit buildings).
Forward outlook
- Local home prices are declining (-3.0%/yr); year-one equity from $3k of loan paydown is wiped out by about $12k of value loss. Plan a longer hold.
- Broward County population projected at +34% by 2050 — long-run rental-demand tailwind backs the buy-and-hold thesis.
Negotiation context
- Only 7 days on market — expect competitive offers; lowballing is unlikely to land.
- 2 sale attempts since 8y ago with the ask held roughly flat each time — persistent listings suggest the price (not the market) is what's stuck; bring a comps-based counter.
- Current owner paid $250k; list at $390k implies a 56% gain — meaningful room to come down on a strong offer.
Risks & watch-outs
- Climate carrying-cost: severe wind risk, 99% chance of damaging wind over 30y; moderate wildfire risk; extreme-heat days projected 7→26/yr by 2055 (HVAC capex compounding) — expect insurance premiums to compound above CPI over the hold.
Questions for the listing agent
- What do current leases actually rent for vs. the listed asking? Can we see a recent rent roll and the last 12 months of T-12 income?
- What does the HOA fee cover, when was the last increase, and are there any pending special assessments or reserve-fund shortfalls?
- Is there a deadline driving the sale (1031 exchange, divorce, estate, relocation)? That informs how much negotiation room exists.
- Schools are A-rated — typically a magnet for longer-tenancy family renters. What's the average tenant stay here, and is there a school-zone premium baked into asking?
- The area grade is low — what's the realistic commute time and amenity access for the typical tenant pool here? Any planned neighborhood developments (good or bad) we should know about?
- What's the average days-on-market for RENTAL listings here right now (not sales)? A rising rental-DOM trend means longer vacancies and softer asking-rent achievability than the comps imply.
- What's the recent tenant-quality profile in this submarket — average credit score on applications, eviction rate, late-payment / NSF rate, and stable-employment percentage? A property-management company in the area should have these aggregated.
- How much new for-sale + rental construction is in the pipeline within 1–3 miles? Heavy new supply typically softens prices + rents 12–24 months out; constrained supply supports both.
Investment metrics
- 1% rule
- 0.89% ✗
- Cap rate
- 5.88%
- Cash-on-cash
- -1.49%
- DSCR
- 0.93
- GRM
- 9.4
CMA / ARV
No comps found within radius.
Projected returns pro-forma
-3.0% appreciation · 0.0% rent growth · sell at horizon
- IRR
- -22.4%
- Equity multiple
- 0.25×
- Total profit
- $-81,830
- Equity at exit
- $58,150
- IRR
- -27.5%
- Equity multiple
- -0.11×
- Total profit
- $-121,012
- Equity at exit
- $33,720
Cash invested: $109,200 (down + closing). Projections, not guarantees.
Landlord ↔ Tenant lean methodology
- Overall (STATE)
- 87 Strongly Landlord-Friendly
- State Florida
- 87 Strongly Landlord-Friendly · R+3
- County
- — inherits STATE
- City
- — inherits STATE
ZIP-level market 33029
- Home prices YoY
- -18.3%
- Rents YoY
- -1.2%
- Active inventory
- 240
- Price-to-rent
- 9.4×
Monthly cashflow live
- Estimated rent
- $3,472 high interval (Pro) →
- Mortgage (P&I)
- −$2,045
- Tax from tax record
- −$480 /mo · $5,765/yr
- Insurance
- −$162
- HOA
- −$190
- Vacancy / Maint / Mgmt
- −$729
- Net cashflow
- $-135
Break-even live
UW: 25.0% down · 7.5% · 30yr · 1.5% tax · 5.0% vac · 8.0% maint · 8.0% mgmt
Financing live
Cash to close
- Down payment
- $97,500
- Closing costs
- $11,700
- Reserves months
- —
- Total cash needed
- —
Loan-product check · same deal, 3 products live
Conventional
25% down · 7.5% · 30yr
- Down + closing
- —
- Monthly P&I
- —
- Monthly cashflow
- —
- DSCR
- —
- Eligible?
- —
Personal DTI + credit; lowest rate.
DSCR
20% down · 8.5% · 30yr
- Down + closing
- —
- Monthly P&I
- —
- Monthly cashflow
- —
- DSCR
- —
- Eligible?
- —
No personal income docs; deal must DSCR.
Hard money
10% down · 12.0% · 12mo
- Down + closing
- —
- Monthly P&I
- —
- Monthly cashflow
- —
- DSCR
- —
- Eligible?
- —
Short-term bridge; refi at stabilization.
Rent comps 9 comps
| Address | Beds | Baths | Sqft | Rent | $/sqft | DOM | Units | Dist |
|---|---|---|---|---|---|---|---|---|
| 20861 NW 4th St Pembroke Pines, FL | 3.0 | 2.5 | 1361 | $4,000 | $2.94 | 24d | 1 | 0.11mi |
| 20875 NW 4th St Pembroke Pines, FL | 2.0 | 2.5 | 1361 | $2,500 | $1.84 | 24d | 1 | 0.14mi |
| 20841 NW 1st St Pembroke Pines, FL | 3.0 | 2.0 | 1225 | $3,500 | $2.86 | 24d | 1 | 0.15mi |
| 20807 NW 1st St #20807 Pembroke Pines, FL | 2.0 | 2.5 | 1361 | $2,650 | $1.95 | 16d | 1 | 0.16mi |
| 387 SW 206th Ave Pembroke Pines, FL | 3.0 | 2.0 | 1453 | $3,500 | $2.41 | 12d | 1 | 0.56mi |
| 387 SW 206th Ave Pembroke Pines, FL | 3.0 | 2.0 | 1453 | $3,500 | $2.41 | 16d | 1 | 0.56mi |
| 21821 S Heritage Cir #1 Pembroke Pines, FL | 3.0 | 3.0 | 1475 | $2,550 | $1.73 | 4d | 1 | 0.75mi |
| 21821 S Heritage Cir #1 Pembroke Pines, FL | 3.0 | 3.0 | 1475 | $2,550 | $1.73 | 24d | 1 | 0.75mi |
| 740 NW 219th Ave Unit 2 Pembroke Pines, FL | 1.0 | 2.0 | 724 | $2,200 | $3.04 | 24d | 1 | 0.88mi |
HOA detail
- Monthly dues
- $190 · $2,280/yr
- Likely covers
- security
Listing history 6 events
-
2026-06-18days on market $390,000 Active 7 DOM
-
2026-06-17days on market $390,000 Active 6 DOM
-
2026-06-16days on market $390,000 Active 5 DOM
-
2026-06-15days on market $390,000 Active 4 DOM
-
2026-06-13remarks 699-char remark
-
2026-06-13$390,000 Active 2 DOM
ⓘ Source: listings_history table (triggers on properties + properties_extension) + one-shot
backfill from property_details.listing_events for pre-trigger history.
Tax reassessment forecast FL · Resets to sale price
- Current annual tax
- $5,765 · $480/mo
- Projected year-2 tax
- $5,765 · $480/mo
- Expected delta
- $0/yr ($0/mo · 0.0%)
ⓘ Screening estimate from a state-policy table — verify with the county assessor before closing.
Climate risk First Street
- Flood 1/10 Low FEMA zone X (shaded) · 0% chance over 30 yrs
- Wildfire 5/10 Major
- Heat 9/10 Extreme 7 d/yr ≥107°F today · 26 d/yr by 30 yrs out
- Wind 10/10 Extreme 99% chance of damaging wind over 30 yrs
- Air quality 2/10 Low 1 unhealthy d/yr today · 2 by 30 yrs out
Nearby sold comps map
Loading sold comps map…
Walkable amenities ~0.75 mi
Loading nearby amenities…
Taxation est. · year 1
- Rental income
- $41,662
- − Mortgage interest
- −$21,846
- − Property taxes
- −$5,765
- − Insurance
- −$1,950
- − Repairs & maintenance
- −$3,333
- − Management
- −$3,333
- − HOA
- −$2,280
- − Depreciation
- −$11,345
- Taxable loss
- −$8,191
- Est. tax savings @ 24.0%
- +$1,966
- After-tax cash flow
- $341/yr
For passive investors: Depreciation is non-cash, so a rental often shows a tax loss while cash-flowing — sheltering income. Rental losses are passive: they offset passive income freely, and up to $25,000/yr can offset ordinary (W-2) income if you actively participate and your MAGI is under $100k (phasing out to $0 by $150k); unused losses carry forward. On sale, claimed depreciation is recaptured at up to 25%, and gains may owe capital-gains tax (a 1031 exchange can defer both). Figures are a year-1 estimate at your 24.0% rate — not tax advice; consult a CPA.
Schools (NCES district)
- District
- Broward
- NCES district ID
- 1200180
- Math proficiency
- 42% ▼ -18.00%
- Reading proficiency
- 53% ▼ -5.00%
- Median HH income
- $52,139
- Composite
- 40.88/100
- National rank
- #3621
- State rank
- #46 of 73 in FL
Livability — Pembroke Pines
- Score
- 83/100
- State rank
- #54
- US rank
- #933
Category grades
Schools grade is shown separately in the Schools card above.
Census & demographics
- Census place
- Pembroke Pines, FL
- County
- Broward County · 1,963,430 people
- City population
- 180,224
- Metro
- Miami-Fort Lauderdale-Pompano Beach, FL
- Population (ZIP)
- 44,070
- Household income
- $146,237
- Rent vs Own
- Severe rent burden
- 307.0
Population outlook (Broward County) Hauer SSP2
- Today (2025)
- 2,207,033 people
- By 2030
- 2,360,704 · +7.0%
- By 2040
- 2,661,208 · +20.6%
- By 2050
- 2,946,698 · +33.5%
- By 2075
- 3,602,273 · +63.2%
- By 2100
- 3,970,984 · +79.9%
Race, ethnicity, and origin ACS 2023
- Neighborhood character
- Highly diverse neighborhood (Simpson 0.70)
- Race & ethnicity
- Hispanic / Latino 43% Two or more races 29% White 27% Black 20% Asian 7%
- Hispanic origin (detail)
- Mexican 2% Puerto Rican 5% Cuban 14% Dominican 3%
- Common ancestry
- Hispanic 2% Russian 1% Estonian 1%
- Foreign-born
- 33% · Canada, Jamaica, China
- Languages at home
- 53% English-only · Spanish 38% Other Indo-European 4% French/Haitian/Cajun 2%
Political lean MEDSL · Broward
- 2024 margin
- D (+17.0) · D 58.0% · R 41.0%
- 2008→2024 swing
- -17.8pp toward R · 2008: 34.7pp · 2024: 17.0pp
- All cycles
- 2024: D+17.0 2020: D+29.8 2016: D+35.0 2012: D+34.9 2008: D+34.7
Not yet ingested
- Civics
- —
Market trends
- HPI YoY
- ▼ -83.68%
- Current HPI
- 373.7752
- Rent YoY
- ▼ -1.17%
- Metro
- Miami-Fort Lauderdale-Pompano Beach, FL
- State GDP YoY
- ▲ 3.28%
- F500 in state
- 36
Industry mix (Fortune 500 HQ in FL)
| Industry | F500 HQs | Revenue |
|---|---|---|
| Industrial Technology | 2 | $29B |
|
||
| Insurance | 2 | $17B |
|
||
| Retail | 1 | $60B |
|
||
| Technology Distribution | 1 | $58B |
|
||
| Homebuilding | 1 | $35B |
|
||
| Technology Manufacturing | 1 | $35B |
|
||
Price history
-68.5% since first listed7 events — show timeline
- 2026-06-11 Listed $390,000 MARMLS
- 2019-04-25 Sold (Public Records) $250,000 Public Records
- 2019-04-12 Sold (MLS) $250,000 MARMLS
- 2019-03-05 Pending — MARMLS
- 2018-11-05 Price Changed $256,000 MARMLS
- 2018-09-01 Listed $260,000 MARMLS
- 1998-04-03 Sold (Public Records) $1,239,200 Public Records
Property tax history
+11.3%/yrLatest (2025): $5,765 · -2.4% YoY. Source: county tax records.
Cash-flow waterfall
monthlySold comps — $/sqft
last 12 mo · ≤1 miLoading sold comps…