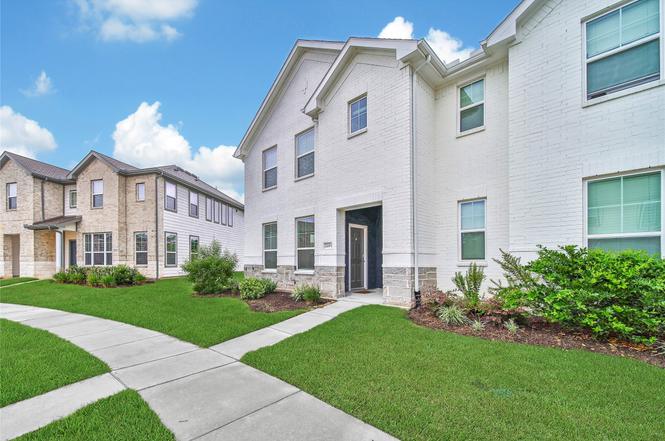
2203 Seven Oaks Blvd · Tomball, TX
Flood risk No data
- FEMA flood zone
- —
- Chance of flooding over 30 yrs
- —
- Est. flood insurance / yr
- —
Fire risk No data
- Est. fire insurance / yr
- —
Heat risk No data
- Hot days now (above threshold)
- —
- Hot days in 30 yrs
- —
Wind risk No data
- Chance of severe wind over 30 yrs
- —
Air-quality risk No data
- Unhealthy air days now
- —
- Unhealthy air days in 30 yrs
- —
Risk factors via First Street. Map © Google.
Why this score? — see what drove the D- grade
The composite is a weighted blend of 9 inputs, each scored 0–100. Each bar is that input's sub-score; the figure is the points it added to the 100-point composite (weight × sub-score).
- ARV discount +9.5/15.0
- Cash flow +7.8/30.0
- Schools +5.8/10.0
- 1% rule +3.8/10.0
- Livability +3.8/5.0
- Condition / age +2.5/5.0
- Rent growth +2.4/5.0
- DSCR +1.8/10.0
- Appreciation +0.0/10.0
$265,000
🖨 Deal sheet (PDF) 📄 Offer letter ✓ Due diligence
Key facts
- $100 HOA
- Built 2024
- Listed 2 days
Property features AI
Finance
- HOA & community: HOA managed by Crest Managenent; Annual HOA fee of $1,200 covering grounds maintenance; Community dog park
Exterior
- Utilities: Public water
- Home design: Residential property; 2-story home; Built in 2024; Slab foundation
- Construction: Brick construction
- Exterior features: Composition roof
Interior
- Kitchen: Convection oven; Electric cooktop; Dishwasher; Microwave; Disposal; Refrigerator
- Bedrooms: Primary bedroom on second floor (23 x 14); Bedroom on second floor (10 x 12); Bedroom on second floor (10 x 10)
- Flooring: Plank flooring; Vinyl flooring
- Bathrooms: 2 full bathrooms; 1 half bathroom; Primary bathroom on second floor (12 x 6)
- Heating & cooling: Central heating (electric); Central air conditioning (electric)
- Interior features: Ceiling fans
- Laundry & utility: Washer; Dryer; Utility room on second floor (7 x 5)
Neighborhood map
What this means for you Summary
Snapshot
- This is a 3-bed/2.5-bath townhouse listed at $265k.
Deal economics
- At list price, monthly cash flow is $-299 ($-4k/yr) — negative.
- To cash-flow at today's rent, offer at most $212k (20.0% below list).
- To meet the 1% rule (rent ≥ 1% of price), the offer needs to be $233k (12.2% below list).
- Recommended offer: $212k (20.0% below list) — sets the bar for cash-flow.
- Cap rate 4.9% vs local median 2.7% in Tomball — top-decile yield for the area; either an underpriced asset or a hidden risk that comps aren't pricing in. Stress-test before assuming the spread holds.
Location & tenants
- Location reads 75/100 on livability (#155 in TX, #4,239 nationally) — a middle-class / working-renter tenant base. Strengths: cost of living A+, housing A+, health & safety B+; Watch: amenities F, commute F.
- Tomball ISD (suburban): math 66% / reading 63% proficiency, ranked #25 of 826 in TX (top 3%) — acceptable for families but not a draw, mixed tenant base, ~2y average lease.
- Zoned schools: Grand Oaks El (math 44% / reading 51%, grade D, #989 of 4,322 statewide, top 23%, 979 students, 29% FRL); Tomball Int (math 55% / reading 45%, grade C, #347 of 1,662 statewide, top 21%, 988 students, 46% FRL); Tomball H S (math 74% / reading 69%, grade B+, #111 of 1,632 statewide, top 7%, 2,801 students, 34% FRL).
- Market conditions: Rents soft (-0.5%/yr); 666 active listings in the ZIP; 4 comparable units currently listed for rent nearby; rentals lingering (median 46d on market — plan ~5-8 weeks vacancy on turnover, expect pricing pressure); 50% of comp listings sitting > 30 days — soft ceiling on asking rent; solid renter incomes; 29,883 units permitted in Harris County in 2024 (8,621 in 5+ unit buildings).
Forward outlook
- Local home prices are declining (-3.0%/yr); year-one equity from $2k of loan paydown is wiped out by about $8k of value loss. Plan a longer hold.
- Harris County population projected at +47% by 2050 — long-run rental-demand tailwind backs the buy-and-hold thesis.
Negotiation context
- Only 2 days on market — expect competitive offers; lowballing is unlikely to land.
Questions for the listing agent
- What do current leases actually rent for vs. the listed asking? Can we see a recent rent roll and the last 12 months of T-12 income?
- What does the HOA fee cover, when was the last increase, and are there any pending special assessments or reserve-fund shortfalls?
- Is there a deadline driving the sale (1031 exchange, divorce, estate, relocation)? That informs how much negotiation room exists.
- Schools are B-rated — typically a magnet for longer-tenancy family renters. What's the average tenant stay here, and is there a school-zone premium baked into asking?
- The area grade is low — what's the realistic commute time and amenity access for the typical tenant pool here? Any planned neighborhood developments (good or bad) we should know about?
- What's the average days-on-market for RENTAL listings here right now (not sales)? A rising rental-DOM trend means longer vacancies and softer asking-rent achievability than the comps imply.
- What's the recent tenant-quality profile in this submarket — average credit score on applications, eviction rate, late-payment / NSF rate, and stable-employment percentage? A property-management company in the area should have these aggregated.
- How much new for-sale + rental construction is in the pipeline within 1–3 miles? Heavy new supply typically softens prices + rents 12–24 months out; constrained supply supports both.
Investment metrics
- 1% rule
- 0.88% ✗
- Cap rate
- 4.94%
- Cash-on-cash
- -4.84%
- DSCR
- 0.78
- GRM
- 9.5
CMA / ARV
- ARV (on-the-fly)
- $277,056
- Comps found
- 12
Show comp detail 12 sales within ~0.75 mi
| Address | Dist | Beds/Ba | Sqft | Sold | Price | $/sf | Match |
|---|---|---|---|---|---|---|---|
| 11906 Amber Oak Way #4 | 0.01mi | 3/2.5 | 1,820 (-3%) | 1mo | $250,000 | $137 | 94 |
| 11902 Amber Oak Way | 0.01mi | 3/2.5 | 1,800 (-4%) | 2mo | $255,000 | $142 | 91 |
| 11910 Outer Bark Dr #15 | 0.09mi | 3/2.5 | 1,903 (+2%) | 6mo | $279,990 | $147 | 88 |
| 11918 Outer Bark Dr #15 | 0.10mi | 3/2.5 | 1,792 (-4%) | 3mo | $249,990 | $140 | 86 |
| 11914 Outer Bark Dr #15 | 0.09mi | 3/2.5 | 1,713 (-8%) | 4mo | $249,990 | $146 | 78 |
| 11906 Outer Bark Dr #15 | 0.09mi | 3/2.5 | 1,684 (-10%) | 2mo | $249,990 | $148 | 78 |
| 11902 Outer Bark Dr #15 | 0.09mi | 3/2.5 | 1,713 (-8%) | 6mo | $279,990 | $163 | 76 |
| 2302 Memory Oaks Dr #11 | 0.07mi | 3/2.5 | 1,705 (-9%) | 8mo | $248,990 | $146 | 75 |
| 11922 Outer Bark Dr #15 | 0.09mi | 3/2.5 | 1,689 (-10%) | 6mo | $279,990 | $166 | 74 |
| 2314 Memory Oak Dr #11 | 0.08mi | 3/2.5 | 1,708 (-9%) | 11mo | $254,990 | $149 | 72 |
| 2310 Memory Oaks Dr #11 | 0.08mi | 3/2.5 | 1,703 (-9%) | 12mo | $279,990 | $164 | 71 |
| 2238 Memory Oaks Drs #11 | 0.07mi | 3/2.5 | 1,679 (-10%) | 10mo | $264,990 | $158 | 71 |
Match score weights: distance 35% · size 25% · config 20% · recency 20%. Top-matched comps best support the ARV.
Projected returns pro-forma
-3.0% appreciation · 0.0% rent growth · sell at horizon
- IRR
- -28.5%
- Equity multiple
- 0.08×
- Total profit
- $-68,605
- Equity at exit
- $39,512
- IRR
- -50.0%
- Equity multiple
- -0.48×
- Total profit
- $-109,739
- Equity at exit
- $22,912
Cash invested: $74,200 (down + closing). Projections, not guarantees.
Landlord ↔ Tenant lean methodology
- Overall (STATE)
- 87 Strongly Landlord-Friendly
- State Texas
- 87 Strongly Landlord-Friendly · R+5
- County
- — inherits STATE
- City
- — inherits STATE
ZIP-level market 77375
- Home prices YoY
- -33.9%
- Rents YoY
- -0.5%
- Active inventory
- 666
- Price-to-rent
- 9.5×
Monthly cashflow live
- Estimated rent
- $2,327 medium interval (Pro) →
- Mortgage (P&I)
- −$1,390
- Tax from tax record
- −$538 /mo · $6,451/yr
- Insurance
- −$110
- HOA
- −$100
- Vacancy / Maint / Mgmt
- −$489
- Net cashflow
- $-299
Break-even live
Sensitivity live
| Price | -10% $-149 | -5% $-224 | +0% $-299 | +5% $-374 | +10% $-449 |
|---|---|---|---|---|---|
| Rent | -10% $-483 | -5% $-391 | +0% $-299 | +5% $-207 | +10% $-116 |
| Rate | -1.0pp $-166 | -0.5pp $-232 | base $-299 | +0.5pp $-368 | +1.0pp $-438 |
UW: 25.0% down · 7.5% · 30yr · 1.5% tax · 5.0% vac · 8.0% maint · 8.0% mgmt
Financing live
Cash to close
- Down payment
- $66,250
- Closing costs
- $7,950
- Reserves months
- —
- Total cash needed
- —
Loan-product check · same deal, 3 products live
Conventional
25% down · 7.5% · 30yr
- Down + closing
- —
- Monthly P&I
- —
- Monthly cashflow
- —
- DSCR
- —
- Eligible?
- —
Personal DTI + credit; lowest rate.
DSCR
20% down · 8.5% · 30yr
- Down + closing
- —
- Monthly P&I
- —
- Monthly cashflow
- —
- DSCR
- —
- Eligible?
- —
No personal income docs; deal must DSCR.
Hard money
10% down · 12.0% · 12mo
- Down + closing
- —
- Monthly P&I
- —
- Monthly cashflow
- —
- DSCR
- —
- Eligible?
- —
Short-term bridge; refi at stabilization.
Rent comps 4 comps
| Address | Beds | Baths | Sqft | Rent | $/sqft | DOM | Units | Dist |
|---|---|---|---|---|---|---|---|---|
| 12817 S Winding Pines Dr Tomball, TX | 4.0 | 2.5 | 2106 | $2,600 | $1.23 | 0d | 1 | 0.84mi |
| 12911 Pine Meadows St Tomball, TX | 3.0 | 2.0 | 1436 | $1,711 | $1.19 | 0d | 1 | 0.91mi |
| 12031 Canyon Falls Dr Tomball, TX | 3.0 | 2.5 | 2256 | $3,000 | $1.33 | 45d | 1 | 1.13mi |
| 11201 Boudreaux Cir Tomball, TX | 1.0–3.0 | 1.0–2.0 | 1069 | $1,799 | $1.68 | 45d | 1 | 1.46mi |
HOA detail
- Monthly dues
- $100 · $1,200/yr
Listing history 1 events
-
2026-06-21$265,000 Active 2 DOM
ⓘ Source: listings_history table (triggers on properties + properties_extension) + one-shot
backfill from property_details.listing_events for pre-trigger history.
Tax reassessment forecast TX · Resets to sale price
- Current annual tax
- $6,451 · $538/mo
- Projected year-2 tax
- $6,451 · $538/mo
- Expected delta
- $0/yr ($0/mo · 0.0%)
ⓘ Screening estimate from a state-policy table — verify with the county assessor before closing.
Nearby sold comps map
Loading sold comps map…
Walkable amenities ~0.75 mi
Loading nearby amenities…
Taxation est. · year 1
- Rental income
- $27,924
- − Mortgage interest
- −$14,844
- − Property taxes
- −$6,451
- − Insurance
- −$1,325
- − Repairs & maintenance
- −$2,234
- − Management
- −$2,234
- − HOA
- −$1,200
- − Depreciation
- −$7,709
- Taxable loss
- −$8,073
- Est. tax savings @ 24.0%
- +$1,938
- After-tax cash flow
- $-1,655/yr
For passive investors: Depreciation is non-cash, so a rental often shows a tax loss while cash-flowing — sheltering income. Rental losses are passive: they offset passive income freely, and up to $25,000/yr can offset ordinary (W-2) income if you actively participate and your MAGI is under $100k (phasing out to $0 by $150k); unused losses carry forward. On sale, claimed depreciation is recaptured at up to 25%, and gains may owe capital-gains tax (a 1031 exchange can defer both). Figures are a year-1 estimate at your 24.0% rate — not tax advice; consult a CPA.
Schools (NCES district)
- District
- Tomball ISD
- NCES district ID
- 4842960
- Math proficiency
- 66% ▼ -6.00%
- Reading proficiency
- 63% ▼ -4.00%
- Median HH income
- $86,552
- Composite
- 58.32/100
- National rank
- #1014
- State rank
- #25 of 826 in TX
Livability — Tomball
- Score
- 75/100
- State rank
- #155
- US rank
- #4239
Category grades
Schools grade is shown separately in the Schools card above.
Census & demographics
- Census place
- Tomball, TX
- County
- Harris County · 4,702,590 people
- City population
- 113,991
- Metro
- Houston-The Woodlands-Sugar Land, TX
- Population (ZIP)
- 72,311
- Household income
- $102,488
- Rent vs Own
- Severe rent burden
- 1803.0
Population outlook (Harris County) Hauer SSP2
- Today (2025)
- 5,571,493 people
- By 2030
- 6,089,821 · +9.3%
- By 2040
- 7,142,806 · +28.2%
- By 2050
- 8,185,864 · +46.9%
- By 2075
- 10,574,329 · +89.8%
- By 2100
- 12,109,958 · +117.4%
Race, ethnicity, and origin ACS 2023
- Neighborhood character
- Diverse neighborhood (Simpson 0.65)
- Race & ethnicity
- White 48% Hispanic / Latino 33% Two or more races 13% Black 10% Asian 6% Native American 2%
- Hispanic origin (detail)
- Mexican 23%
- Common ancestry
- Italian 2% Lithuanian 2% Slovak 2%
- Foreign-born
- 17% · Canada, Vietnam, Jamaica
- Languages at home
- 72% English-only · Spanish 22% Other Indo-European 2% Vietnamese 2%
Political lean MEDSL · Harris
- 2024 margin
- Lean D (+5.5) · D 52.0% · R 46.4% · Other 1.6%
- 2008→2024 swing
- +3.9pp toward D · 2008: 1.6pp · 2024: 5.5pp
- All cycles
- 2024: D+5.5 2020: D+13.3 2016: D+12.4 2012: D+0.1 2008: D+1.6
Not yet ingested
- Civics
- —
Market trends
- HPI YoY
- ▼ -119.81%
- Current HPI
- 233.6155
- Rent YoY
- ▼ -0.49%
- Metro
- Houston-The Woodlands-Sugar Land, TX
- State GDP YoY
- ▲ 3.95%
- F500 in state
- 110
Industry mix (Fortune 500 HQ in TX)
| Industry | F500 HQs | Revenue |
|---|---|---|
| Energy | 16 | $1,198B |
|
||
| Technology | 5 | $198B |
|
||
| Engineering / Construction | 4 | $72B |
|
||
| Energy Services | 3 | $60B |
|
||
| Utilities | 3 | $41B |
|
||
| Healthcare | 2 | $330B |
|
||
Price history
2 events — show timeline
- 2026-06-19 Listed $265,000 HARMLS
- 2024-07-18 Sold (Public Records) — Public Records
Property tax history
+944.7%/yrLatest (2025): $6,451 · +944.7% YoY. Source: county tax records.
Cash-flow waterfall
monthlySold comps — $/sqft
last 12 mo · ≤1 miLoading sold comps…