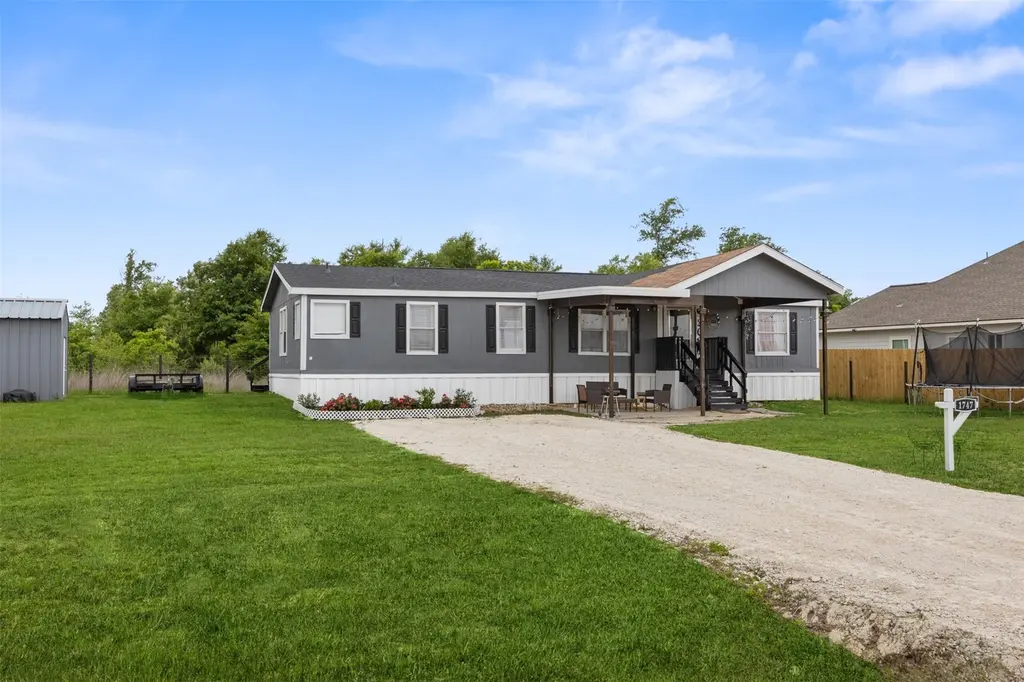
1747 Road 5708 · Plum Grove, TX
Flood risk 4/10 · Minor
- FEMA flood zone
- X (unshaded)
- Chance of flooding over 30 yrs
- 0.22%
- Est. flood insurance / yr
- $507 – $1,088
Fire risk 3/10 · Minor
- Est. fire insurance / yr
- $1,222 – $2,270
Heat risk 8/10 · Major
- Hot days now (above 112°F)
- 7 days/yr
- Hot days in 30 yrs
- 22 days/yr
Wind risk 8/10 · Major
- Chance of severe wind over 30 yrs
- 99.0%
Air-quality risk 2/10 · Minimal
- Unhealthy air days now
- 1 days/yr
- Unhealthy air days in 30 yrs
- 1 days/yr
Risk factors via First Street. Map © Google.
Why this score? — see what drove the B+ grade
The composite is a weighted blend of 9 inputs, each scored 0–100. Each bar is that input's sub-score; the figure is the points it added to the 100-point composite (weight × sub-score).
- Cash flow +30.0/30.0
- ARV discount +14.4/15.0
- DSCR +10.0/10.0
- 1% rule +8.9/10.0
- Condition / age +3.8/5.0
- Rent growth +3.5/5.0
- Livability +2.9/5.0
- Schools +2.1/10.0
- Appreciation +0.0/10.0
$140,000
🖨 Deal sheet 📄 Offer letter ✓ Due diligence
Listing remarks MLS
Updated double wide mobile home featuring 4 bedrooms, 2 full baths, a covered front porch, and a spacious layout. This well maintained home offers inviting living areas, modern updates, and a warm feel throughout. A flex room provides the perfect space for a home office, playroom, or additional sitting area. With plenty of outdoor space to enjoy, this property is a great opportunity for buyers seeking affordable living with comfort, functionality, and charm.
Key facts
- 0.23 acre lot
- Built 1999
- Listed 32 days
Neighborhood map
What this means for you Summary
Snapshot
- This is a 4-bed/2.0-bath manufactured listed at $140k. Condition is rated good.
Deal economics
- At list price, monthly cash flow is $670 ($8k/yr) — positive.
- The deal already cash-flows at list — no discount required.
- Meets the 1% rule at list price ($2k rent vs $140k).
- Recommended offer: $136k (3.0% below list) — sets the bar for market timing.
- Cap rate 12.0% vs local median 5.0% in Plum Grove — top-decile yield for the area; either an underpriced asset or a hidden risk that comps aren't pricing in. Stress-test before assuming the spread holds.
Location & tenants
- Location reads 58/100 on livability (#1,206 in TX) — a working-class tenant base; expect higher turnover. Strengths: crime A+, cost of living A+, housing A+; Watch: schools F, amenities F, commute F.
- Cleveland ISD (town): math 24% / reading 25% proficiency, ranked #723 of 826 in TX (top 88%) — low school quality limits family demand, transient renter base, plan for 1-2y turnover; 71% free/reduced lunch — lower-income household profile, screen leases tightly.
- Market conditions: Rents rising fast (+4.0%/yr); 1574 active listings in the ZIP; 3 comparable units currently listed for rent nearby; rentals leasing fast (median 13d on market — plan ~1-2 weeks tenant-placement turnaround); 1,321 units permitted in Liberty County in 2024 (0 in 5+ unit buildings).
- This rent runs 38% of the median local income ($62k/yr) — at the standard rent-burdened threshold; future hikes will face affordability resistance.
Forward outlook
- Local home prices are declining (-3.0%/yr); year-one equity from $968 of loan paydown is wiped out by about $4k of value loss. Plan a longer hold.
- Liberty County population projected at +24% by 2050 — long-run rental-demand tailwind backs the buy-and-hold thesis.
- At projected returns (-3.0% appreciation + 4.0% rent growth), your $39k cash investment doubles in ~6 years — after that, you're playing with house money.
Negotiation context
- It's been on market 33 days — a 3% lower offer ($136k) is reasonable based on typical stale-listing flexibility.
- 2 sale attempts since 3y ago with the ask held roughly flat each time — persistent listings suggest the price (not the market) is what's stuck; bring a comps-based counter.
Risks & watch-outs
- Climate carrying-cost: severe wind risk, 99% chance of damaging wind over 30y; extreme-heat days projected 7→22/yr by 2055 (HVAC capex compounding) — expect insurance premiums to compound above CPI over the hold.
Questions for the listing agent
- It's been on market 33 days. Have you received any prior offers? Is the seller open to a 3% concession, seller financing, or rate buy-down credit?
- What does the HOA fee cover, when was the last increase, and are there any pending special assessments or reserve-fund shortfalls?
- Is there a deadline driving the sale (1031 exchange, divorce, estate, relocation)? That informs how much negotiation room exists.
- Schools are F-rated, which usually means shorter tenancies and higher turnover. Who's the typical renter profile here, and what's been the actual vacancy rate?
- What's the average days-on-market for RENTAL listings here right now (not sales)? A rising rental-DOM trend means longer vacancies and softer asking-rent achievability than the comps imply.
- What's the recent tenant-quality profile in this submarket — average credit score on applications, eviction rate, late-payment / NSF rate, and stable-employment percentage? A property-management company in the area should have these aggregated.
- How much new for-sale + rental construction is in the pipeline within 1–3 miles? Heavy new supply typically softens prices + rents 12–24 months out; constrained supply supports both.
Investment metrics
- 1% rule
- 1.39% ✓
- Cap rate
- 12.04%
- Cash-on-cash
- 20.52%
- DSCR
- 1.91
- GRM
- 6.0
CMA / ARV
- ARV (median comp)
- $165,266
- List price
- $140,000
- Delta
- -15.29%
- Verdict
- UNDERPRICED
- Comps
- 20 within 1.0 mi
Show comp detail 1 sale within ~0.75 mi
| Address | Dist | Beds/Ba | Sqft | Sold | Price | $/sf | Match |
|---|---|---|---|---|---|---|---|
| 1342 Road 5703 | 0.51mi | 4/2.0 | 1,475 (-4%) | 7mo | $149,000 | $101 | 65 |
Match score weights: distance 35% · size 25% · config 20% · recency 20%. Top-matched comps best support the ARV.
Projected returns pro-forma
-3.0% appreciation · 4.0% rent growth · sell at horizon
- IRR
- 13.9%
- Equity multiple
- 1.56×
- Total profit
- $21,965
- Equity at exit
- $20,874
- IRR
- 23.4%
- Equity multiple
- 3.10×
- Total profit
- $82,280
- Equity at exit
- $12,105
Cash invested: $39,200 (down + closing). Projections, not guarantees.
Landlord ↔ Tenant lean methodology
- Overall (STATE)
- 87 Strongly Landlord-Friendly
- State Texas
- 87 Strongly Landlord-Friendly · R+5
- County
- — inherits STATE
- City
- — inherits STATE
ZIP-level market 77327
- Home prices YoY
- -5.2%
- Rents YoY
- 4.0%
- Active inventory
- 1574
- Price-to-rent
- 6.0×
Monthly cashflow live
- Estimated rent
- $1,949 medium interval (Pro) →
- Mortgage (P&I)
- −$734
- Tax from tax record
- −$67 /mo · $804/yr
- Insurance
- −$58
- HOA
- −$10
- Vacancy / Maint / Mgmt
- −$409
- Net cashflow
- $670
Break-even live
UW: 25.0% down · 7.5% · 30yr · 1.5% tax · 5.0% vac · 8.0% maint · 8.0% mgmt
Financing live
Cash to close
- Down payment
- $35,000
- Closing costs
- $4,200
- Reserves months
- —
- Total cash needed
- —
Loan-product check · same deal, 3 products live
Conventional
25% down · 7.5% · 30yr
- Down + closing
- —
- Monthly P&I
- —
- Monthly cashflow
- —
- DSCR
- —
- Eligible?
- —
Personal DTI + credit; lowest rate.
DSCR
20% down · 8.5% · 30yr
- Down + closing
- —
- Monthly P&I
- —
- Monthly cashflow
- —
- DSCR
- —
- Eligible?
- —
No personal income docs; deal must DSCR.
Hard money
10% down · 12.0% · 12mo
- Down + closing
- —
- Monthly P&I
- —
- Monthly cashflow
- —
- DSCR
- —
- Eligible?
- —
Short-term bridge; refi at stabilization.
Rent comps 3 comps
| Address | Beds | Baths | Sqft | Rent | $/sqft | DOM | Units | Dist |
|---|---|---|---|---|---|---|---|---|
| 1964 Road 5714 Cleveland, TX | 3.0 | 2.0 | 1200 | $1,595 | $1.33 | 43d | 1 | 0.57mi |
| 1964 Road 5714 Cleveland, TX | 3.0 | 2.0 | 1128 | $1,575 | $1.40 | 7d | 1 | 0.57mi |
| 662 Road 590110 Cleveland, TX | 4.0 | 2.0 | 1600 | $2,200 | $1.38 | 12d | 1 | 1.19mi |
HOA detail
- Monthly dues
- $10 · $120/yr
Listing history 12 events
-
2026-06-18days on market $140,000 Active 33 DOM
-
2026-06-17days on market $140,000 Active 32 DOM
-
2026-06-16days on market $140,000 Active 31 DOM
-
2026-06-15days on market $140,000 Active 30 DOM
-
2026-06-13days on market $140,000 Active 28 DOM
-
2026-06-10status $140,000 Active 24 DOM
-
2026-05-13status Pending 462-char remark
Show marketing remark (462 chars)
Updated double wide mobile home featuring 4 bedrooms, 2 full baths, a covered front porch, and a spacious layout. This well maintained home offers inviting living areas, modern updates, and a warm feel throughout. A flex room provides the perfect space for a home office, playroom, or additional sitting area. With plenty of outdoor space to enjoy, this property is a great opportunity for buyers seeking affordable living with comfort, functionality, and charm.
-
2026-04-19$140,000 Active 462-char remark
Show marketing remark (462 chars)
Updated double wide mobile home featuring 4 bedrooms, 2 full baths, a covered front porch, and a spacious layout. This well maintained home offers inviting living areas, modern updates, and a warm feel throughout. A flex room provides the perfect space for a home office, playroom, or additional sitting area. With plenty of outdoor space to enjoy, this property is a great opportunity for buyers seeking affordable living with comfort, functionality, and charm.
-
2026-04-18historical $140,000 462-char remark
Show marketing remark (462 chars)
Updated double wide mobile home featuring 4 bedrooms, 2 full baths, a covered front porch, and a spacious layout. This well maintained home offers inviting living areas, modern updates, and a warm feel throughout. A flex room provides the perfect space for a home office, playroom, or additional sitting area. With plenty of outdoor space to enjoy, this property is a great opportunity for buyers seeking affordable living with comfort, functionality, and charm.
-
2023-05-26historical
-
2023-03-27price $180,000
-
2023-03-09$185,000 Active
ⓘ Source: listings_history table (triggers on properties + properties_extension) + one-shot
backfill from property_details.listing_events for pre-trigger history.
Tax reassessment forecast TX · Resets to sale price
- Current annual tax
- $804 · $67/mo
- Projected year-2 tax
- $2,562 · $214/mo
- Expected delta
- +$1,758/yr (+$147/mo · 218.8%)
ⓘ Screening estimate from a state-policy table — verify with the county assessor before closing.
Climate risk First Street
- Flood 4/10 Moderate FEMA zone X (unshaded) · 22% chance over 30 yrs
- Wildfire 3/10 Moderate
- Heat 8/10 Severe 7 d/yr ≥112°F today · 22 d/yr by 30 yrs out
- Wind 8/10 Severe 99% chance of damaging wind over 30 yrs
- Air quality 2/10 Low 1 unhealthy d/yr today · 1 by 30 yrs out
Nearby sold comps map
Loading sold comps map…
Walkable amenities ~0.75 mi
Loading nearby amenities…
Taxation est. · year 1
- Rental income
- $23,391
- − Mortgage interest
- −$7,842
- − Property taxes
- −$804
- − Insurance
- −$700
- − Repairs & maintenance
- −$1,871
- − Management
- −$1,871
- − HOA
- −$120
- − Depreciation
- −$4,073
- Taxable income
- $6,110
- Est. tax owed @ 24.0%
- −$1,466
- After-tax cash flow
- $6,579/yr
For passive investors: Depreciation is non-cash, so a rental often shows a tax loss while cash-flowing — sheltering income. Rental losses are passive: they offset passive income freely, and up to $25,000/yr can offset ordinary (W-2) income if you actively participate and your MAGI is under $100k (phasing out to $0 by $150k); unused losses carry forward. On sale, claimed depreciation is recaptured at up to 25%, and gains may owe capital-gains tax (a 1031 exchange can defer both). Figures are a year-1 estimate at your 24.0% rate — not tax advice; consult a CPA.
Condition & rehab AI · 1 photo
This well-maintained double-wide mobile home offers a good condition with minimal repairs needed. It is ready for a fresh coat of paint and some landscaping to enhance its curb appeal and value.
Value-add opportunities
- Both Painting exterior and interior — Fresh paint enhances curb appeal and interior aesthetics
- Both Landscaping improvements — Enhances curb appeal and adds value
- Both New flooring in bathrooms and kitchen — Modern flooring improves aesthetics and functionality
- Both New windows and doors — New windows and doors improve energy efficiency and curb appeal
Renovation cost estimate screening
Value-add ROI direction
- Both Painting exterior and interior — Fresh paint enhances curb appeal and interior aesthetics ↑
- Both Landscaping improvements — Enhances curb appeal and adds value ↑
- Both New flooring in bathrooms and kitchen — Modern flooring improves aesthetics and functionality ↑
- Both New windows and doors — New windows and doors improve energy efficiency and curb appeal ↑
ⓘ Cost ranges are severity-bucket heuristics (US national rule-of-thumb). Get contractor quotes + a written scope before underwriting a rehab budget.
Schools (NCES district)
- District
- Cleveland ISD
- NCES district ID
- 4814370
- Math proficiency
- 24% ▼ -13.00%
- Reading proficiency
- 25% ▼ -4.00%
- Median HH income
- $39,173
- Composite
- 20.61/100
- National rank
- #8549
- State rank
- #723 of 826 in TX
Livability — Plum Grove
- Score
- 58/100
- State rank
- #1206
- US rank
- #21049
Category grades
Schools grade is shown separately in the Schools card above.
Census & demographics
- County
- Liberty County · 82,189 people
- Metro
- Houston-The Woodlands-Sugar Land, TX
- Population (ZIP)
- 42,685
- Household income
- $62,219
- Rent vs Own
- Severe rent burden
- 437.0
Population outlook (Liberty County) Hauer SSP2
- Today (2025)
- 87,956 people
- By 2030
- 92,161 · +4.8%
- By 2040
- 100,784 · +14.6%
- By 2050
- 109,471 · +24.5%
- By 2075
- 133,470 · +51.7%
- By 2100
- 147,372 · +67.6%
Race, ethnicity, and origin ACS 2023
- Neighborhood character
- Diverse neighborhood (Simpson 0.57)
- Race & ethnicity
- Hispanic / Latino 54% White 36% Two or more races 18% Black 8% Native American 2%
- Hispanic origin (detail)
- Mexican 42%
- Common ancestry
- Lithuanian 2% Serbian 1% Slovak 0%
- Foreign-born
- 22% · Canada
- Languages at home
- 51% English-only · Spanish 48%
Political lean MEDSL · Liberty
- 2024 margin
- Solid R (+61.6) · D 19.0% · R 80.6%
- 2008→2024 swing
- -17.9pp toward R · 2008: -43.7pp · 2024: -61.6pp
- All cycles
- 2024: R+61.6 2020: R+59.7 2016: R+58.0 2012: R+53.3 2008: R+43.7
Not yet ingested
- Civics
- —
Market trends
- HPI YoY
- ▼ -12.39%
- Current HPI
- 224.9222
- Rent YoY
- ▲ 4.00%
- Metro
- Houston-The Woodlands-Sugar Land, TX
- State GDP YoY
- ▲ 3.95%
- F500 in state
- 110
Industry mix (Fortune 500 HQ in TX)
| Industry | F500 HQs | Revenue |
|---|---|---|
| Energy | 16 | $1,198B |
|
||
| Technology | 5 | $198B |
|
||
| Engineering / Construction | 4 | $72B |
|
||
| Energy Services | 3 | $60B |
|
||
| Utilities | 3 | $41B |
|
||
| Healthcare | 2 | $330B |
|
||
Price history
-24.3% since first listed6 events — show timeline
- 2026-05-13 Pending — HARMLS
- 2026-04-19 Listed $140,000 HARMLS
- 2026-04-18 Coming Soon $140,000 HARMLS
- 2023-05-26 Listing Removed — HARMLS
- 2023-03-27 Price Changed $180,000 HARMLS
- 2023-03-09 Listed $185,000 HARMLS
Property tax history
+3.4%/yrLatest (2025): $804 · +0.5% YoY. Source: county tax records.
Cash-flow waterfall
monthlySold comps — $/sqft
last 12 mo · ≤1 miLoading sold comps…