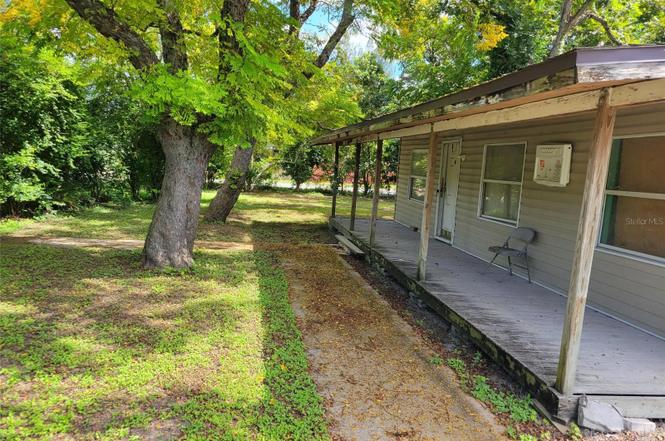
38606 Calumet Ave · Zephyrhills, FL
Flood risk 6/10 · Moderate
- FEMA flood zone
- X (unshaded)
- Chance of flooding over 30 yrs
- 0.73%
- Est. flood insurance / yr
- $507 – $1,088
Fire risk 2/10 · Minimal
- Est. fire insurance / yr
- $947 – $1,759
Heat risk 9/10 · Severe
- Hot days now (above 108°F)
- 7 days/yr
- Hot days in 30 yrs
- 24 days/yr
Wind risk 9/10 · Severe
- Chance of severe wind over 30 yrs
- 99.0%
Air-quality risk 2/10 · Minimal
- Unhealthy air days now
- 1 days/yr
- Unhealthy air days in 30 yrs
- 2 days/yr
Risk factors via First Street. Map © Google.
Why this score? — see what drove the B- grade
The composite is a weighted blend of 9 inputs, each scored 0–100. Each bar is that input's sub-score; the figure is the points it added to the 100-point composite (weight × sub-score).
- Cash flow +25.7/30.0
- ARV discount +15.0/15.0
- DSCR +8.6/10.0
- 1% rule +7.7/10.0
- Schools +4.3/10.0
- Livability +3.6/5.0
- Condition / age +2.5/5.0
- Rent growth +1.6/5.0
- Appreciation +0.0/10.0
$119,000
🖨 Deal sheet 📄 Offer letter ✓ Due diligence
Listing remarks MLS
LOOK NO FURTHER! * INVESTORS SPECIAL * Sitting on . 40 acres of land, this home is located in the heart of Zephyrhills just a short drive away from any basic necessity like Grocery Stores, Gas Stations, Auto Shops and more. Public schools are also just a short drive away. This home has alot of potential and with some rejuvenation you will be able to bring it to life!
Key facts
- Complete renovation
- Large lot
- Building permit
Tags
Property features AI
Finance
- Other: Property zoned R1; Residential property sub type: Single Family Residence; Unfurnished
- HOA & community: No homeowners association
Exterior
- Utilities: Public water; Public sewer; Cable available; Electricity available
- Home design: Single Family Residence; One story; North-facing
- Construction: Shingle roof; Other construction materials; Crawlspace foundation; Built on a 0.4-acre lot
- Exterior features: Other exterior features; Gravel road access
Interior
- Bedrooms: 2 bedrooms
- Flooring: Other flooring
- Bathrooms: 1 full bathroom
- Heating & cooling: No heating; No cooling
- Interior features: Other interior features
- Laundry & utility: No laundry hookups
Neighborhood map
What this means for you Summary
Snapshot
- This is a 2-bed/1.0-bath single-family listed at $119k.
Deal economics
- At list price, monthly cash flow is $286 ($3k/yr) — positive.
- The deal already cash-flows at list — no discount required.
- Meets the 1% rule at list price ($2k rent vs $119k).
- Recommended offer: $105k (12.0% below list) — sets the bar for market timing.
- Cap rate 9.2% vs local median 3.7% in Zephyrhills — top-decile yield for the area; either an underpriced asset or a hidden risk that comps aren't pricing in. Stress-test before assuming the spread holds.
Location & tenants
- Location reads 72/100 on livability (#330 in FL) — a middle-class / working-renter tenant base. Strengths: cost of living A+, housing A+, health & safety A; Watch: schools C-, crime C-, amenities F.
- Pasco (suburban): math 50% / reading 52% proficiency, ranked #32 of 73 in FL (top 44%) — acceptable for families but not a draw, mixed tenant base, ~2y average lease.
- Market conditions: Rents falling (-3.6%/yr); 294 active listings in the ZIP; 40 comparable units currently listed for rent nearby; rentals at typical pace (median 25d on market — plan ~3-4 weeks tenant-placement turnaround); 6,765 units permitted in Pasco County in 2024 (1,250 in 5+ unit buildings).
- This rent runs 37% of the median local income ($49k/yr) — at the standard rent-burdened threshold; future hikes will face affordability resistance.
Forward outlook
- Local home prices are declining (-3.0%/yr); year-one equity from $823 of loan paydown is wiped out by about $4k of value loss. Plan a longer hold.
- Pasco County population projected at +29% by 2050 — long-run rental-demand tailwind backs the buy-and-hold thesis.
Negotiation context
- It's been on market 243 days — a 12% lower offer ($105k) is reasonable based on typical stale-listing flexibility.
- 10 sale attempts since 8y ago; this cycle's ask has dropped $16k (12%) from the opening price — seller is motivated, your offer sets the floor, not the list.
- Current owner paid $85k; 40% above their basis — modest negotiation headroom, anchor on the comps not their cost.
Risks & watch-outs
- Watch-outs: built in 1958 — expect roof / HVAC / electrical / plumbing capex.
- Climate carrying-cost: major flood risk; severe wind risk, 99% chance of damaging wind over 30y; extreme-heat days projected 7→24/yr by 2055 (HVAC capex compounding) — expect insurance premiums to compound above CPI over the hold.
Questions for the listing agent
- It's been on market 243 days. Have you received any prior offers? Is the seller open to a 12% concession, seller financing, or rate buy-down credit?
- Built in 1958 — when were the roof, HVAC, electrical panel, plumbing, and water heater last replaced?
- Why hasn't it sold? Are there any deal-killer items the seller is aware of (foundation, flood, title, zoning, code violations)?
- Is there a deadline driving the sale (1031 exchange, divorce, estate, relocation)? That informs how much negotiation room exists.
- What's the average days-on-market for RENTAL listings here right now (not sales)? A rising rental-DOM trend means longer vacancies and softer asking-rent achievability than the comps imply.
- What's the recent tenant-quality profile in this submarket — average credit score on applications, eviction rate, late-payment / NSF rate, and stable-employment percentage? A property-management company in the area should have these aggregated.
- How much new for-sale + rental construction is in the pipeline within 1–3 miles? Heavy new supply typically softens prices + rents 12–24 months out; constrained supply supports both.
Investment metrics
- 1% rule
- 1.27% ✓
- Cap rate
- 9.17%
- Cash-on-cash
- 10.28%
- DSCR
- 1.46
- GRM
- 6.5
CMA / ARV
- ARV (on-the-fly)
- $201,314
- Comps found
- 12
Show comp detail 12 sales within ~0.75 mi
| Address | Dist | Beds/Ba | Sqft | Sold | Price | $/sf | Match |
|---|---|---|---|---|---|---|---|
| 6145 11th St | 0.26mi | 2/1.0 | 1,100 (+4%) | 9mo | $279,900 | $254 | 73 |
| 6125 11th St | 0.29mi | 2/1.0 | 1,100 (+4%) | 9mo | $210,000 | $191 | 72 |
| 5854 9th St | 0.55mi | 2/1.0 | 1,085 (+3%) | 5mo | $155,000 | $143 | 65 |
| 6142 19th St | 0.39mi | 2/2.0 | 989 (-6%) | 8mo | $275,000 | $278 | 61 |
| 6712 Holly Ct | 0.40mi | 2/2.0 | 1,148 (+9%) | 9mo | $160,000 | $139 | 55 |
| 39047 Heath Dr | 0.49mi | 2/1.0 | 912 (-14%) | 2mo | $50,000 | $55 | 53 |
| 38250 13th Ave | 0.66mi | 3/1.0 (+1) | 1,000 (-5%) | 4mo | $212,000 | $212 | 52 |
| 5836 8th St | 0.61mi | 3/1.0 (+1) | 1,100 (+4%) | 10mo | $240,000 | $218 | 51 |
| 5906 12th St | 0.45mi | 3/1.5 (+1) | 1,156 (+10%) | 8mo | $195,000 | $169 | 49 |
| 5721 20th St | 0.72mi | 3/1.0 (+1) | 1,104 (+5%) | 6mo | $213,000 | $193 | 48 |
| 38339 Eucalyptus Dr | 0.46mi | 2/2.0 | 1,191 (+13%) | 10mo | $204,000 | $171 | 45 |
| 5640 17th St | 0.73mi | 2/2.0 | 936 (-11%) | 3mo | $116,000 | $124 | 41 |
Match score weights: distance 35% · size 25% · config 20% · recency 20%. Top-matched comps best support the ARV.
Projected returns pro-forma
-3.0% appreciation · 0.0% rent growth · sell at horizon
- IRR
- -4.5%
- Equity multiple
- 0.84×
- Total profit
- $-5,463
- Equity at exit
- $17,743
- IRR
- 0.9%
- Equity multiple
- 1.05×
- Total profit
- $1,805
- Equity at exit
- $10,289
Cash invested: $33,320 (down + closing). Projections, not guarantees.
Landlord ↔ Tenant lean methodology
- Overall (STATE)
- 87 Strongly Landlord-Friendly
- State Florida
- 87 Strongly Landlord-Friendly · R+3
- County
- — inherits STATE
- City
- — inherits STATE
ZIP-level market 33542
- Home prices YoY
- -20.6%
- Rents YoY
- -3.6%
- Active inventory
- 294
- Price-to-rent
- 6.5×
Monthly cashflow live
- Estimated rent
- $1,516 high interval (Pro) →
- Mortgage (P&I)
- −$624
- Tax from tax record
- −$239 /mo · $2,864/yr
- Insurance
- −$50
- HOA
- −$0
- Vacancy / Maint / Mgmt
- −$318
- Net cashflow
- $286
Break-even live
UW: 25.0% down · 7.5% · 30yr · 1.5% tax · 5.0% vac · 8.0% maint · 8.0% mgmt
Financing live
Cash to close
- Down payment
- $29,750
- Closing costs
- $3,570
- Reserves months
- —
- Total cash needed
- —
Loan-product check · same deal, 3 products live
Conventional
25% down · 7.5% · 30yr
- Down + closing
- —
- Monthly P&I
- —
- Monthly cashflow
- —
- DSCR
- —
- Eligible?
- —
Personal DTI + credit; lowest rate.
DSCR
20% down · 8.5% · 30yr
- Down + closing
- —
- Monthly P&I
- —
- Monthly cashflow
- —
- DSCR
- —
- Eligible?
- —
No personal income docs; deal must DSCR.
Hard money
10% down · 12.0% · 12mo
- Down + closing
- —
- Monthly P&I
- —
- Monthly cashflow
- —
- DSCR
- —
- Eligible?
- —
Short-term bridge; refi at stabilization.
Rent comps 40 comps
| Address | Beds | Baths | Sqft | Rent | $/sqft | DOM | Units | Dist |
|---|---|---|---|---|---|---|---|---|
| 38748 Calumet Ave Zephyrhills, FL | 2.0 | 1.0 | 750 | $1,100 | $1.47 | 5d | 1 | 0.17mi |
| 38485 County Road 54 Zephyrhills, FL | 2.0 | 1.0 | 800 | $1,100 | $1.38 | 24d | 1 | 0.22mi |
| 38647 Rose Ln Zephyrhills, FL | 2.0 | 1.0 | 814 | $1,350 | $1.66 | 24d | 1 | 0.32mi |
| 38300 Henry Dr Zephyrhills, FL | 2.0 | 1.0 | 1152 | $1,650 | $1.43 | 5d | 1 | 0.34mi |
| 38350 Ironwood Pl #5 Zephyrhills, FL | 2.0 | 2.0 | 1094 | $1,800 | $1.65 | 24d | 1 | 0.36mi |
| 6788 Basswood Cir Zephyrhills, FL | 2.0 | 2.0 | 1067 | $1,250 | $1.17 | 24d | 1 | 0.39mi |
| 38719 12th Ave Zephyrhills, FL | 2.0 | 1.5 | 1246 | $1,400 | $1.12 | 24d | 1 | 0.44mi |
| 38939 North Ave Unit 2 Zephyrhills, FL | 2.0 | 1.0 | 870 | $1,300 | $1.49 | 18d | 1 | 0.50mi |
| 39132 County Rd Zephyrhills, FL | 2.0 | 2.0 | 864 | $1,500 | $1.74 | 24d | 1 | 0.51mi |
| 39132 County Road 54 #2184 Zephyrhills, FL | 2.0 | 2.0 | 864 | $1,500 | $1.74 | 24d | 1 | 0.52mi |
| 6136 Pina Colada St Zephyrhills, FL | 3.0 | 2.5 | 1386 | $2,100 | $1.52 | 12d | 1 | 0.53mi |
| 5812 17th St Zephyrhills, FL | 3.0 | 2.0 | 1320 | $2,100 | $1.59 | 24d | 1 | 0.58mi |
| 6195 Daerr Ridge St Zephyrhills, FL | 3.0 | 2.5 | 1386 | $2,000 | $1.44 | 18d | 1 | 0.61mi |
| 5652 18th St Zephyrhills, FL | 2.0 | 1.0 | 976 | $1,200 | $1.23 | 24d | 1 | 0.73mi |
| 38942 9th Ave Zephyrhills, FL | 2.0 | 1.0 | 850 | $1,425 | $1.68 | 24d | 1 | 0.76mi |
| 5647 20th St Zephyrhills, FL | 2.0 | 1.0 | 850 | $1,425 | $1.68 | 24d | 1 | 0.78mi |
| 37732 Cecil Ln Zephyrhills, FL | 3.0 | 1.0 | 1040 | $1,800 | $1.73 | 24d | 1 | 0.87mi |
| 5542 20th St Unit 1234473P Zephyrhills, FL | 2.0 | 2.0 | 839 | $3,199 | $3.81 | 3d | 1 | 0.90mi |
| 5532 20th St Unit 1234470P Zephyrhills, FL | 2.0 | 2.0 | 839 | $7,185 | $8.56 | 2d | 1 | 0.90mi |
| 37661 Aaralyn Rd Zephyrhills, FL | 3.0 | 2.5 | 1363 | $1,800 | $1.32 | 24d | 1 | 0.95mi |
| 6246 Timberly Ln Zephyrhills, FL | 3.0 | 2.5 | 1363 | $1,900 | $1.39 | 24d | 1 | 0.96mi |
| 5441 6th St Zephyrhills, FL | 2.0 | 1.0 | 1014 | $1,650 | $1.63 | 24d | 1 | 0.99mi |
| 37812 15th Ave Zephyrhills, FL | 2.0 | 2.0 | 1000 | $1,850 | $1.85 | 24d | 1 | 1.00mi |
| 37814 Daughtery Rd Zephyrhills, FL | 2.0 | 1.0 | 1070 | $1,395 | $1.30 | 5d | 1 | 1.00mi |
| 38112 Townview Ave Zephyrhills, FL | 1.0 | 1.0 | 700 | $1,100 | $1.57 | 24d | 1 | 1.03mi |
| 6262 Maisie Rd Zephyrhills, FL | 3.0 | 2.5 | 1363 | $1,700 | $1.25 | 24d | 1 | 1.05mi |
| 6335 Maisie Rd Zephyrhills, FL | 3.0 | 2.5 | 1363 | $1,650 | $1.21 | 20d | 1 | 1.07mi |
| 5532 Jennie St Zephyrhills, FL | 2.0 | 2.0 | 862 | $1,100 | $1.28 | 12d | 1 | 1.08mi |
| 5600 Jennie St Zephyrhills, FL | 2.0 | 2.0 | 730 | $1,100 | $1.51 | 24d | 1 | 1.10mi |
| 39252 Heights Ave Zephyrhills, FL | 3.0 | 2.0 | 1210 | $2,050 | $1.69 | 15d | 1 | 1.27mi |
| 5237 1st St Zephyrhills, FL | 3.0 | 1.0 | 964 | $1,700 | $1.76 | 24d | 1 | 1.28mi |
| 5028 16th St Zephyrhills, FL | 2.0 | 2.0 | 1092 | $1,595 | $1.46 | 24d | 1 | 1.33mi |
| 6302 Abbott Station Dr Zephyrhills, FL | 3.0 | 1.0–2.5 | 855 | $1,732 | $2.02 | 2d | 142 | 1.34mi |
| 5022 5th St Zephyrhills, FL | 2.0 | 1.5 | 974 | $1,595 | $1.64 | 24d | 1 | 1.35mi |
| 5143 1st St Zephyrhills, FL | 3.0 | 2.0 | 1436 | $1,750 | $1.22 | 24d | 1 | 1.36mi |
| 38702 South Ave Zephyrhills, FL | 2.0 | 1.0 | 800 | $1,600 | $2.00 | 24d | 1 | 1.39mi |
| 37902 7th Ave Zephyrhills, FL | 3.0 | 1.0 | 900 | $1,775 | $1.97 | 24d | 1 | 1.40mi |
| 4940 9th St Zephyrhills, FL | 3.0 | 1.0 | 1404 | $1,895 | $1.35 | 24d | 1 | 1.41mi |
| 7660 Emerson Hill Cir Zephyrhills, FL | 1.0–3.0 | 1.0–2.0 | 1077 | $1,964 | $1.82 | 2d | 34 | 1.41mi |
| 4940 4th St Zephyrhills, FL | 2.0 | 2.0 | 900 | $1,350 | $1.50 | 24d | 1 | 1.42mi |
Listing history 42 events
-
2026-06-18days on market $119,000 Active 243 DOM
-
2026-06-17days on market $119,000 Active 242 DOM
-
2026-06-16days on market $119,000 Active 241 DOM
-
2026-06-15days on market $119,000 Active 240 DOM
-
2026-06-13days on market $119,000 Active 238 DOM
-
2026-06-09days on market $119,000 Active 234 DOM
-
2026-06-08days on market $119,000 Active 233 DOM
-
2026-06-07days on market $119,000 Active 232 DOM
-
2026-06-04days on market $119,000 Active 229 DOM
-
2026-06-03days on market $119,000 Active 228 DOM
-
2026-06-02days on market $119,000 Active 227 DOM
-
2026-06-01days on market $119,000 Active 226 DOM
-
2026-05-31days on market $119,000 Active 225 DOM
-
2026-03-24price $119,000
-
2026-01-05status Active
-
2025-12-31historical
-
2025-10-13$135,000 Active
-
2023-09-05soldstatus $85,000
-
2023-08-25soldstatus $85,000 Closed 371-char remark
Show marketing remark (371 chars)
LOOK NO FURTHER! * INVESTORS SPECIAL * Sitting on . 40 acres of land, this home is located in the heart of Zephyrhills just a short drive away from any basic necessity like Grocery Stores, Gas Stations, Auto Shops and more. Public schools are also just a short drive away. This home has alot of potential and with some rejuvenation you will be able to bring it to life!
-
2023-02-24status Pending 371-char remark
Show marketing remark (371 chars)
LOOK NO FURTHER! * INVESTORS SPECIAL * Sitting on . 40 acres of land, this home is located in the heart of Zephyrhills just a short drive away from any basic necessity like Grocery Stores, Gas Stations, Auto Shops and more. Public schools are also just a short drive away. This home has alot of potential and with some rejuvenation you will be able to bring it to life!
-
2023-02-21price $92,000 371-char remark
Show marketing remark (371 chars)
LOOK NO FURTHER! * INVESTORS SPECIAL * Sitting on . 40 acres of land, this home is located in the heart of Zephyrhills just a short drive away from any basic necessity like Grocery Stores, Gas Stations, Auto Shops and more. Public schools are also just a short drive away. This home has alot of potential and with some rejuvenation you will be able to bring it to life!
-
2023-02-11$142,000 Active 371-char remark
Show marketing remark (371 chars)
LOOK NO FURTHER! * INVESTORS SPECIAL * Sitting on . 40 acres of land, this home is located in the heart of Zephyrhills just a short drive away from any basic necessity like Grocery Stores, Gas Stations, Auto Shops and more. Public schools are also just a short drive away. This home has alot of potential and with some rejuvenation you will be able to bring it to life!
-
2022-10-12price $149,900
-
2022-09-21status Active
-
2022-09-10price $156,000
-
2022-09-02$168,900 Active
-
2022-08-25historical
-
2022-08-24status Active
-
2022-08-18price $168,900
-
2022-08-10$169,900 Active
-
2019-01-25soldstatus $42,500 Sold
-
2019-01-19status Pending
-
2019-01-15price $55,950
-
2019-01-15status Active
-
2019-01-03status Pending
-
2018-12-31$59,500 Active
-
2018-09-09historical
-
2018-08-31$44,000 Active
-
2010-03-16soldstatus $91,000
-
2008-03-17soldstatus $100,000
-
2006-06-15soldstatus $114,000
-
2001-10-25soldstatus $16,500
ⓘ Source: listings_history table (triggers on properties + properties_extension) + one-shot
backfill from property_details.listing_events for pre-trigger history.
Tax reassessment forecast FL · Resets to sale price
- Current annual tax
- $2,864 · $239/mo
- Projected year-2 tax
- $2,864 · $239/mo
- Expected delta
- $0/yr ($0/mo · 0.0%)
ⓘ Screening estimate from a state-policy table — verify with the county assessor before closing.
Climate risk First Street
- Flood 6/10 Major FEMA zone X (unshaded) · 73% chance over 30 yrs
- Wildfire 2/10 Low
- Heat 9/10 Extreme 7 d/yr ≥108°F today · 24 d/yr by 30 yrs out
- Wind 9/10 Extreme 99% chance of damaging wind over 30 yrs
- Air quality 2/10 Low 1 unhealthy d/yr today · 2 by 30 yrs out
Nearby sold comps map
Loading sold comps map…
Walkable amenities ~0.75 mi
Loading nearby amenities…
Taxation est. · year 1
- Rental income
- $18,195
- − Mortgage interest
- −$6,666
- − Property taxes
- −$2,864
- − Insurance
- −$595
- − Repairs & maintenance
- −$1,456
- − Management
- −$1,456
- − Depreciation
- −$3,462
- Taxable income
- $1,697
- Est. tax owed @ 24.0%
- −$407
- After-tax cash flow
- $3,019/yr
For passive investors: Depreciation is non-cash, so a rental often shows a tax loss while cash-flowing — sheltering income. Rental losses are passive: they offset passive income freely, and up to $25,000/yr can offset ordinary (W-2) income if you actively participate and your MAGI is under $100k (phasing out to $0 by $150k); unused losses carry forward. On sale, claimed depreciation is recaptured at up to 25%, and gains may owe capital-gains tax (a 1031 exchange can defer both). Figures are a year-1 estimate at your 24.0% rate — not tax advice; consult a CPA.
Schools (NCES district)
- District
- Pasco
- NCES district ID
- 1201530
- Math proficiency
- 50% ▼ -10.00%
- Reading proficiency
- 52% ▼ -5.00%
- Median HH income
- $45,039
- Composite
- 43.14/100
- National rank
- #3074
- State rank
- #32 of 73 in FL
Livability — Zephyrhills
- Score
- 72/100
- State rank
- #330
- US rank
- #5760
Category grades
Schools grade is shown separately in the Schools card above.
Census & demographics
- Census place
- Zephyrhills, FL
- County
- Pasco County · 524,098 people
- City population
- 48,266
- Metro
- Tampa-St. Petersburg-Clearwater, FL
- Population (ZIP)
- 23,612
- Household income
- $49,316
- Rent vs Own
- Severe rent burden
- 831.0
Population outlook (Pasco County) Hauer SSP2
- Today (2025)
- 570,045 people
- By 2030
- 605,844 · +6.3%
- By 2040
- 674,806 · +18.4%
- By 2050
- 736,022 · +29.1%
- By 2075
- 862,900 · +51.4%
- By 2100
- 906,364 · +59.0%
Race, ethnicity, and origin ACS 2023
- Neighborhood character
- Predominantly White (76%)
- Race & ethnicity
- White 76% Hispanic / Latino 17% Two or more races 8% Black 4% Asian 1%
- Hispanic origin (detail)
- Mexican 2% Puerto Rican 10%
- Common ancestry
- Lithuanian 3% Romanian 2% Iranian 2%
- Foreign-born
- 5% · Canada, Jamaica
- Languages at home
- 86% English-only · Spanish 12% Other Indo-European 1% Russian/Polish/Slavic 1%
Political lean MEDSL · Pasco
- 2024 margin
- Strong R (+25.2) · D 36.9% · R 62.1% · Other 1.0%
- 2008→2024 swing
- -21.6pp toward R · 2008: -3.6pp · 2024: -25.2pp
- All cycles
- 2024: R+25.2 2020: R+20.1 2016: R+21.6 2012: R+6.7 2008: R+3.6
Not yet ingested
- Civics
- —
Market trends
- HPI YoY
- ▼ -81.25%
- Current HPI
- 313.3993
- Rent YoY
- ▼ -3.56%
- Metro
- Tampa-St. Petersburg-Clearwater, FL
- State GDP YoY
- ▲ 3.28%
- F500 in state
- 36
Industry mix (Fortune 500 HQ in FL)
| Industry | F500 HQs | Revenue |
|---|---|---|
| Industrial Technology | 2 | $29B |
|
||
| Insurance | 2 | $17B |
|
||
| Retail | 1 | $60B |
|
||
| Technology Distribution | 1 | $58B |
|
||
| Homebuilding | 1 | $35B |
|
||
| Technology Manufacturing | 1 | $35B |
|
||
Price history
+621.2% since first listed29 events — show timeline
- 2026-03-24 Price Changed $119,000 Stellar MLS as Distributed by MLS Grid
- 2026-01-05 Relisted — Stellar MLS as Distributed by MLS Grid
- 2025-12-31 Listing Removed — Stellar MLS as Distributed by MLS Grid
- 2025-10-13 Listed $135,000 Stellar MLS as Distributed by MLS Grid
- 2023-09-05 Sold (Public Records) $85,000 Public Records
- 2023-08-25 Sold (MLS) $85,000 Stellar MLS as Distributed by MLS Grid
- 2023-02-24 Pending — Stellar MLS as Distributed by MLS Grid
- 2023-02-21 Price Changed $92,000 Stellar MLS as Distributed by MLS Grid
- 2023-02-11 Listed $142,000 Stellar MLS as Distributed by MLS Grid
- 2022-10-12 Price Changed $149,900 Stellar MLS as Distributed by MLS Grid
- 2022-09-21 Relisted — Stellar MLS as Distributed by MLS Grid
- 2022-09-10 Price Changed $156,000 Stellar MLS as Distributed by MLS Grid
- 2022-09-02 Listed $168,900 Stellar MLS as Distributed by MLS Grid
- 2022-08-25 Listing Removed — Stellar MLS as Distributed by MLS Grid
- 2022-08-24 Relisted — Stellar MLS as Distributed by MLS Grid
- 2022-08-18 Price Changed $168,900 Stellar MLS as Distributed by MLS Grid
- 2022-08-10 Listed $169,900 Stellar MLS as Distributed by MLS Grid
- 2019-01-25 Sold (MLS) $42,500 Stellar MLS as Distributed by MLS Grid
- 2019-01-19 Pending — Stellar MLS as Distributed by MLS Grid
- 2019-01-15 Price Changed $55,950 Stellar MLS as Distributed by MLS Grid
- 2019-01-15 Relisted — Stellar MLS as Distributed by MLS Grid
- 2019-01-03 Pending — Stellar MLS as Distributed by MLS Grid
- 2018-12-31 Listed $59,500 Stellar MLS as Distributed by MLS Grid
- 2018-09-09 Listing Removed — Stellar MLS as Distributed by MLS Grid
- 2018-08-31 Listed $44,000 Stellar MLS as Distributed by MLS Grid
- 2010-03-16 Sold (Public Records) $91,000 Public Records
- 2008-03-17 Sold (Public Records) $100,000 Public Records
- 2006-06-15 Sold (Public Records) $114,000 Public Records
- 2001-10-25 Sold (Public Records) $16,500 Public Records
Property tax history
+8.6%/yrLatest (2025): $2,864 · +4.9% YoY. Source: county tax records.
Cash-flow waterfall
monthlySold comps — $/sqft
last 12 mo · ≤1 miLoading sold comps…