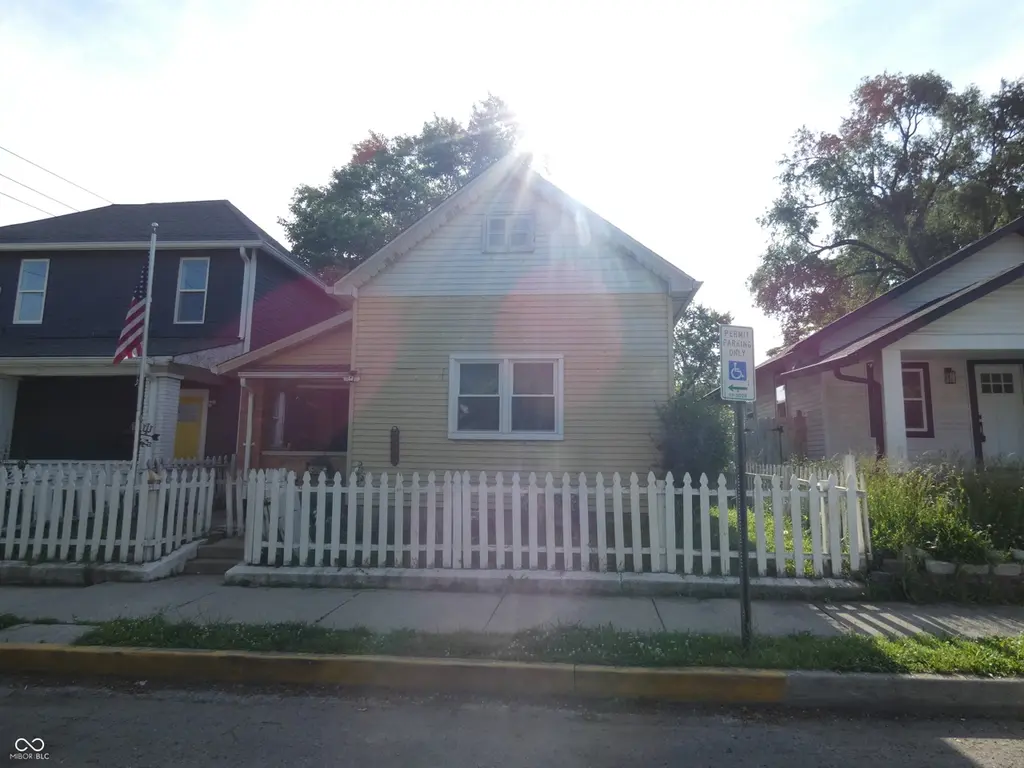
505 Saint Paul St · Indianapolis city (balance), IN
Flood risk 1/10 · Minimal
- FEMA flood zone
- X (unshaded)
- Chance of flooding over 30 yrs
- 0.0%
- Est. flood insurance / yr
- $473 – $860
Fire risk 1/10 · Minimal
- Est. fire insurance / yr
- $717 – $1,331
Heat risk 4/10 · Minor
- Hot days now (above 101°F)
- 7 days/yr
- Hot days in 30 yrs
- 19 days/yr
Wind risk 2/10 · Minimal
- Chance of severe wind over 30 yrs
- 1.0%
Air-quality risk 4/10 · Minor
- Unhealthy air days now
- 5 days/yr
- Unhealthy air days in 30 yrs
- 7 days/yr
Risk factors via First Street. Map © Google.
Why this score? — see what drove the D grade
The composite is a weighted blend of 9 inputs, each scored 0–100. Each bar is that input's sub-score; the figure is the points it added to the 100-point composite (weight × sub-score).
- Cash flow +17.0/30.0
- DSCR +5.3/10.0
- ARV discount +4.6/15.0
- 1% rule +3.6/10.0
- Rent growth +3.2/5.0
- Livability +2.5/5.0
- Condition / age +2.5/5.0
- Schools +1.4/10.0
- Appreciation +0.0/10.0
$144,500
🖨 Deal sheet 📄 Offer letter ✓ Due diligence
Listing remarks
Check it out. This 2 bedroom 1 bath home in Indy. This home has a newer roof and new flooring in living room. 2 car detached and fenced in back yard. Also a white picket fenced in front yard. Great location
Key facts
- Newer roof
- New flooring
- Fenced in back yard
Tags
Property features AI
Exterior
- Parking: Detached 2-car garage (approximately 440 sq ft)
- Utilities: Public water; Municipal sewer connected
- Home design: Single-family residence; One story
- Construction: Vinyl siding; Block foundation
- Exterior features: Lot smaller than 1/4 acre (approximately 0.1 acre)
Interior
- Kitchen: Microwave; Electric oven; Refrigerator
- Bedrooms: 2 bedrooms on the main level
- Bathrooms: 1 full bathroom on the main level
- Heating & cooling: Forced air heating; Central air conditioning
- Interior features: Attic access; Finished basement
Neighborhood map
What this means for you Summary
Snapshot
- This is a 2-bed/1.0-bath single-family listed at $144k.
Deal economics
- At list price, monthly cash flow is $99 ($1k/yr) — positive.
- The deal already cash-flows at list — no discount required.
- To meet the 1% rule (rent ≥ 1% of price), the offer needs to be $124k (14.3% below list).
- Recommended offer: $124k (14.3% below list) — sets the bar for 1% rule.
- Cap rate 7.1% vs local median 4.4% in Indianapolis city (balance) — top-decile yield for the area; either an underpriced asset or a hidden risk that comps aren't pricing in. Stress-test before assuming the spread holds.
Location & tenants
- Location reads: area grade D — affects rentability + tenant quality, not the cash-flow math above.
- Indianapolis Public Schools (urban): math 14% / reading 20% proficiency, ranked #286 of 301 in IN (top 95%) — low school quality limits family demand, transient renter base, plan for 1-2y turnover; 77% free/reduced lunch — lower-income household profile, screen leases tightly.
- Market conditions: Rents rising (+2.9%/yr); 493 active listings in the ZIP; 40 comparable units currently listed for rent nearby; rentals lingering (median 44d on market — plan ~5-8 weeks vacancy on turnover, expect pricing pressure); 50% of comp listings sitting > 30 days — soft ceiling on asking rent; 1,906 units permitted in Marion County in 2024 (621 in 5+ unit buildings).
Forward outlook
- Local home prices are declining (-3.0%/yr); year-one equity from $999 of loan paydown is wiped out by about $4k of value loss. Plan a longer hold.
- Marion County population projected at +18% by 2050 — long-run rental-demand tailwind backs the buy-and-hold thesis.
Negotiation context
- Only 10 days on market — expect competitive offers; lowballing is unlikely to land.
Risks & watch-outs
- Watch-outs: built in 1920 — expect roof / HVAC / electrical / plumbing capex.
Questions for the listing agent
- Built in 1920 — when were the roof, HVAC, electrical panel, plumbing, and water heater last replaced?
- Is there a deadline driving the sale (1031 exchange, divorce, estate, relocation)? That informs how much negotiation room exists.
- The area grade is low — what's the realistic commute time and amenity access for the typical tenant pool here? Any planned neighborhood developments (good or bad) we should know about?
- What's the average days-on-market for RENTAL listings here right now (not sales)? A rising rental-DOM trend means longer vacancies and softer asking-rent achievability than the comps imply.
- What's the recent tenant-quality profile in this submarket — average credit score on applications, eviction rate, late-payment / NSF rate, and stable-employment percentage? A property-management company in the area should have these aggregated.
- How much new for-sale + rental construction is in the pipeline within 1–3 miles? Heavy new supply typically softens prices + rents 12–24 months out; constrained supply supports both.
Investment metrics
- 1% rule
- 0.86% ✗
- Cap rate
- 7.11%
- Cash-on-cash
- 2.93%
- DSCR
- 1.13
- GRM
- 9.7
CMA / ARV
- ARV (on-the-fly)
- $135,865
- Comps found
- 12
Show comp detail 12 sales within ~0.75 mi
| Address | Dist | Beds/Ba | Sqft | Sold | Price | $/sf | Match |
|---|---|---|---|---|---|---|---|
| 2251 English Ave | 0.02mi | 3/1.0 (+1) | 960 (+2%) | 10mo | $179,900 | $187 | 82 |
| 917 St Peter St | 0.35mi | 2/1.0 | 913 (-3%) | 9mo | $90,000 | $99 | 72 |
| 274 Leeds Ave | 0.40mi | 3/2.0 (+1) | 936 (-0%) | 12mo | $100,000 | $107 | 62 |
| 1524 Pleasant St | 0.59mi | 2/1.0 | 995 (+6%) | 1mo | $125,000 | $126 | 61 |
| 1341 Fletcher Ave | 0.68mi | 2/1.0 | 860 (-8%) | 0mo | $215,000 | $250 | 54 |
| 3106 Newton Ave | 0.74mi | 3/2.0 (+1) | 912 (-3%) | 1mo | $95,500 | $105 | 51 |
| 215 Trowbridge St | 0.40mi | 1/1.0 (-1) | 1,071 (+14%) | 4mo | $57,000 | $53 | 49 |
| 1641 Deloss St | 0.41mi | 3/1.5 (+1) | 1,038 (+11%) | 9mo | $205,000 | $197 | 48 |
| 1118 Churchman Ave | 0.53mi | 2/2.0 | 812 (-13%) | 7mo | $244,000 | $300 | 43 |
| 331 S Oakland Ave | 0.60mi | 3/1.0 (+1) | 1,056 (+13%) | 5mo | $135,000 | $128 | 41 |
| 3037 Newton Ave | 0.67mi | 3/1.0 (+1) | 1,074 (+15%) | 2mo | $156,000 | $145 | 38 |
| 1145 Villa Ave | 0.60mi | 3/2.0 (+1) | 1,044 (+11%) | 8mo | $299,900 | $287 | 37 |
Match score weights: distance 35% · size 25% · config 20% · recency 20%. Top-matched comps best support the ARV.
Projected returns pro-forma
-3.0% appreciation · 2.88% rent growth · sell at horizon
- IRR
- -11.8%
- Equity multiple
- 0.57×
- Total profit
- $-17,331
- Equity at exit
- $21,545
- IRR
- -2.9%
- Equity multiple
- 0.81×
- Total profit
- $-7,827
- Equity at exit
- $12,494
Cash invested: $40,460 (down + closing). Projections, not guarantees.
Landlord ↔ Tenant lean methodology
- Overall (STATE)
- 90 Strongly Landlord-Friendly
- State Indiana
- 90 Strongly Landlord-Friendly · R+11
- County
- — inherits STATE
- City
- — inherits STATE
ZIP-level market 46203
- Home prices YoY
- -26.7%
- Rents YoY
- 2.9%
- Active inventory
- 493
- Price-to-rent
- 9.7×
Monthly cashflow live
- Estimated rent
- $1,238 high interval (Pro) →
- Mortgage (P&I)
- −$758
- Tax from tax record
- −$62 /mo · $739/yr
- Insurance
- −$60
- HOA
- −$0
- Vacancy / Maint / Mgmt
- −$260
- Net cashflow
- $99
Break-even live
UW: 25.0% down · 7.5% · 30yr · 1.5% tax · 5.0% vac · 8.0% maint · 8.0% mgmt
Financing live
Cash to close
- Down payment
- $36,125
- Closing costs
- $4,335
- Reserves months
- —
- Total cash needed
- —
Loan-product check · same deal, 3 products live
Conventional
25% down · 7.5% · 30yr
- Down + closing
- —
- Monthly P&I
- —
- Monthly cashflow
- —
- DSCR
- —
- Eligible?
- —
Personal DTI + credit; lowest rate.
DSCR
20% down · 8.5% · 30yr
- Down + closing
- —
- Monthly P&I
- —
- Monthly cashflow
- —
- DSCR
- —
- Eligible?
- —
No personal income docs; deal must DSCR.
Hard money
10% down · 12.0% · 12mo
- Down + closing
- —
- Monthly P&I
- —
- Monthly cashflow
- —
- DSCR
- —
- Eligible?
- —
Short-term bridge; refi at stabilization.
Rent comps 40 comps
| Address | Beds | Baths | Sqft | Rent | $/sqft | DOM | Units | Dist |
|---|---|---|---|---|---|---|---|---|
| 225 Hamilton Ave Indianapolis, IN | 2.0 | 2.0 | 1008 | $1,695 | $1.68 | 43d | 1 | 0.20mi |
| 423 Villa Ave Indianapolis, IN | 1.0 | 1.0 | 593 | $799 | $1.35 | 23d | 1 | 0.23mi |
| 2025 Southeastern Ave Indianapolis, IN | 1.0 | 1.0 | 663 | $775 | $1.17 | 43d | 1 | 0.25mi |
| 2034 Southeastern Ave Indianapolis, IN | 1.0 | 1.0 | 525 | $850 | $1.62 | 14d | 1 | 0.26mi |
| 2631 Southeastern Ave Indianapolis, IN | 3.0 | 2.0 | 1072 | $1,195 | $1.11 | 11d | 1 | 0.28mi |
| 247 S Randolph St Indianapolis, IN | 2.0 | 1.0 | 720 | $750 | $1.04 | 43d | 1 | 0.32mi |
| 245 S Randolph St Indianapolis, IN | 2.0 | 1.0 | 720 | $750 | $1.04 | 43d | 1 | 0.32mi |
| 330 S Rural St Indianapolis, IN | 2.0 | 1.0 | 960 | $1,050 | $1.09 | 7d | 1 | 0.37mi |
| 1912 Lexington Ave Unit 1910B Indianapolis, IN | 1.0 | 1.0 | 660 | $850 | $1.29 | 43d | 1 | 0.37mi |
| 2230 Woodlawn Ave Indianapolis, IN | 2.0 | 1.0 | 924 | $1,350 | $1.46 | 43d | 1 | 0.38mi |
| 2116 Woodlawn Ave Indianapolis, IN | 2.0 | 2.0 | 1054 | $1,175 | $1.11 | 7d | 1 | 0.40mi |
| 323 S Rural St Indianapolis, IN | 3.0 | 1.5 | 1090 | $1,050 | $0.96 | 43d | 1 | 0.40mi |
| 518 S State Ave Indianapolis, IN | 2.0 | 1.0 | 900 | $725 | $0.81 | 43d | 1 | 0.42mi |
| 350 S Oxford St Indianapolis, IN | 3.0 | 1.0 | 826 | $1,300 | $1.57 | 43d | 1 | 0.42mi |
| 1011 Harlan St Indianapolis, IN | 2.0 | 2.0 | 1008 | $1,525 | $1.51 | 43d | 1 | 0.44mi |
| 1013 Harlan St Indianapolis, IN | 2.0 | 1.0 | 1008 | $1,475 | $1.46 | 43d | 1 | 0.45mi |
| 815 Dawson St Unit 2 Indianapolis, IN | 2.0 | 1.0 | 600 | $1,300 | $2.17 | 4d | 1 | 0.45mi |
| 1718 Southeastern Ave Indianapolis, IN | 1.0 | 1.0 | 700 | $1,080 | $1.54 | 43d | 1 | 0.45mi |
| 3022 English Ave Unit 3022 Indianapolis, IN | 2.0 | 1.0 | 600 | $650 | $1.08 | 43d | 1 | 0.52mi |
| 1023 S State Ave Indianapolis, IN | 1.0 | 1.0 | 600 | $1,099 | $1.83 | 23d | 1 | 0.60mi |
| 49 S Rural St Indianapolis, IN | 2.0 | 1.5 | 750 | $950 | $1.27 | 10d | 1 | 0.60mi |
| 1449 Fletcher Ave Indianapolis, IN | 2.0 | 2.0 | 1000 | $2,000 | $2.00 | 17d | 1 | 0.62mi |
| 301 S Gray St Indianapolis, IN | 2.0 | 1.0 | 841 | $1,025 | $1.22 | 23d | 1 | 0.66mi |
| 340 S Dearborn St Indianapolis, IN | 2.0 | 1.0 | 873 | $1,180 | $1.35 | 23d | 1 | 0.67mi |
| 225 N Hamilton Ave Indianapolis, IN | 2.0 | 2.0 | 1008 | $1,695 | $1.68 | 43d | 1 | 0.72mi |
| 228 N Randolph St Indianapolis, IN | 2.0 | 2.0 | 1008 | $1,695 | $1.68 | 43d | 1 | 0.74mi |
| 270 S Lasalle St Indianapolis, IN | 3.0 | 2.0 | 562 | $1,329 | $2.36 | 7d | 1 | 0.75mi |
| 2211 E New York St Unit B Indianapolis, IN | 1.0 | 1.0 | 650 | $725 | $1.12 | 21d | 1 | 0.77mi |
| 1529 E Ohio St Indianapolis, IN | 2.0 | 1.0 | 1118 | $1,299 | $1.16 | 43d | 1 | 0.79mi |
| 1441 Prospect St Indianapolis, IN | 2.0 | 1.0–2.0 | 2840 | $2,000 | $0.70 | 1d | 13 | 0.81mi |
| 1145 Bates St Indianapolis, IN | 2.0 | 1.0 | 1065 | $1,500 | $1.41 | 21d | 1 | 0.83mi |
| 1148 Fletcher Ave Indianapolis, IN | 2.0 | 1.0 | 900 | $1,800 | $2.00 | 17d | 1 | 0.83mi |
| 1306 Woodlawn Ave Unit 1B Indianapolis, IN | 1.0 | 1.0 | 720 | $1,275 | $1.77 | 43d | 1 | 0.84mi |
| 28 S Dearborn St Unit A Indianapolis, IN | 3.0 | 1.0 | 1100 | $1,400 | $1.27 | 10d | 1 | 0.85mi |
| 1337 Prospect St Unit 3 Indianapolis, IN | 1.0 | 2.0 | 1100 | $1,450 | $1.32 | 43d | 1 | 0.86mi |
| 1026 Laurel St Indianapolis, IN | 1.0 | 1.0 | 655 | $860 | $1.31 | 43d | 1 | 0.87mi |
| 313 Eastern Ave Indianapolis, IN | 2.0 | 1.0 | 1040 | $950 | $0.91 | 21d | 1 | 0.89mi |
| 1503 Dawson St Indianapolis, IN | 2.0 | 1.0 | 700 | $1,200 | $1.71 | 43d | 1 | 0.90mi |
| 1224 Prospect St Indianapolis, IN | 2.0 | 1.0–2.0 | 691 | $2,235 | $3.23 | 1d | 8 | 0.91mi |
| 3441 Prospect St Indianapolis, IN | 2.0 | 1.0 | 1008 | $1,500 | $1.49 | 23d | 1 | 0.93mi |
Listing history 9 events
-
2026-06-18days on market $144,500 Active 10 DOM
-
2026-06-17days on market $144,500 Active 9 DOM
-
2026-06-16statusdays on market $144,500 Active 8 DOM
-
2026-06-07statusdays on market $144,500 Pending 7 DOM
-
2026-06-03days on market $144,500 Active 4 DOM
-
2026-06-02days on market $144,500 Active 3 DOM
-
2026-06-01days on market $144,500 Active 2 DOM
-
2026-05-31remarks 206-char remark
-
2026-05-31$144,500 Active 1 DOM
ⓘ Source: listings_history table (triggers on properties + properties_extension) + one-shot
backfill from property_details.listing_events for pre-trigger history.
Tax reassessment forecast IN · Partial reset (capped growth)
- Current annual tax
- $739 · $62/mo
- Projected year-2 tax
- $984 · $82/mo
- Expected delta
- +$244/yr (+$20/mo · 33.1%)
ⓘ Screening estimate from a state-policy table — verify with the county assessor before closing.
Climate risk First Street
- Flood 1/10 Low FEMA zone X (unshaded) · 0% chance over 30 yrs
- Wildfire 1/10 Low
- Heat 4/10 Moderate 7 d/yr ≥101°F today · 19 d/yr by 30 yrs out
- Wind 2/10 Low 100% chance of damaging wind over 30 yrs
- Air quality 4/10 Moderate 5 unhealthy d/yr today · 7 by 30 yrs out
Nearby sold comps map
Loading sold comps map…
Walkable amenities ~0.75 mi
Loading nearby amenities…
Taxation est. · year 1
- Rental income
- $14,861
- − Mortgage interest
- −$8,094
- − Property taxes
- −$739
- − Insurance
- −$722
- − Repairs & maintenance
- −$1,189
- − Management
- −$1,189
- − Depreciation
- −$4,204
- Taxable loss
- −$1,277
- Est. tax savings @ 24.0%
- +$306
- After-tax cash flow
- $1,491/yr
For passive investors: Depreciation is non-cash, so a rental often shows a tax loss while cash-flowing — sheltering income. Rental losses are passive: they offset passive income freely, and up to $25,000/yr can offset ordinary (W-2) income if you actively participate and your MAGI is under $100k (phasing out to $0 by $150k); unused losses carry forward. On sale, claimed depreciation is recaptured at up to 25%, and gains may owe capital-gains tax (a 1031 exchange can defer both). Figures are a year-1 estimate at your 24.0% rate — not tax advice; consult a CPA.
Schools (NCES district)
- District
- Indianapolis Public Schools
- NCES district ID
- 1804770
- Math proficiency
- 14% ▼ -7.00%
- Reading proficiency
- 20% ▼ -3.00%
- Median HH income
- $32,034
- Composite
- 13.69/100
- National rank
- #9499
- State rank
- #286 of 301 in IN
Livability — Indianapolis city (balance)
No livability data for this city. (Only ~50 U.S. cities are tracked.)
Census & demographics
- Census place
- Indianapolis city (balance), IN
- County
- Marion County · 998,460 people
- City population
- 881,119
- Metro
- Indianapolis-Carmel-Anderson, IN
- Population (ZIP)
- 37,758
- Household income
- $57,393
- Rent vs Own
- Severe rent burden
- 1499.0
Population outlook (Marion County) Hauer SSP2
- Today (2025)
- 1,025,572 people
- By 2030
- 1,065,727 · +3.9%
- By 2040
- 1,141,577 · +11.3%
- By 2050
- 1,208,920 · +17.9%
- By 2075
- 1,367,288 · +33.3%
- By 2100
- 1,438,201 · +40.2%
Race, ethnicity, and origin ACS 2023
- Neighborhood character
- Predominantly White (69%)
- Race & ethnicity
- White 69% Hispanic / Latino 14% Black 12% Two or more races 8% Asian 2% Native American 1%
- Hispanic origin (detail)
- Mexican 12% Puerto Rican 1%
- Common ancestry
- Slovak 2% Lithuanian 2% Italian 1%
- Foreign-born
- 8% · Canada
- Languages at home
- 88% English-only · Spanish 10% Other Indo-European 1%
Political lean MEDSL · Marion
- 2024 margin
- Strong D (+27.7) · D 63.0% · R 35.3% · Other 1.7%
- 2008→2024 swing
- -0.7pp no change · 2008: 28.4pp · 2024: 27.7pp
- All cycles
- 2024: D+27.7 2020: D+29.1 2016: D+22.8 2012: D+22.2 2008: D+28.4
Not yet ingested
- Civics
- —
Market trends
- HPI YoY
- ▼ -127.37%
- Current HPI
- 349.579
- Rent YoY
- ▲ 2.88%
- Metro
- Indianapolis-Carmel-Anderson, IN
- State GDP YoY
- ▲ 2.90%
- F500 in state
- 18
Industry mix (Fortune 500 HQ in IN)
| Industry | F500 HQs | Revenue |
|---|---|---|
| Industrial Machinery | 2 | $37B |
|
||
| Healthcare | 1 | $177B |
|
||
| Pharmaceuticals | 1 | $45B |
|
||
| Metals / Steel | 1 | $18B |
|
||
| Agriculture | 1 | $17B |
|
||
| Packaging | 1 | $12B |
|
||
Price history
1 event — show timeline
- 2026-05-30 Listed $144,500 MIBOR as Distributed by MLS Grid
Property tax history
+12.7%/yrLatest (2025): $739 · +16.4% YoY. Source: county tax records.
Cash-flow waterfall
monthlySold comps — $/sqft
last 12 mo · ≤1 miLoading sold comps…