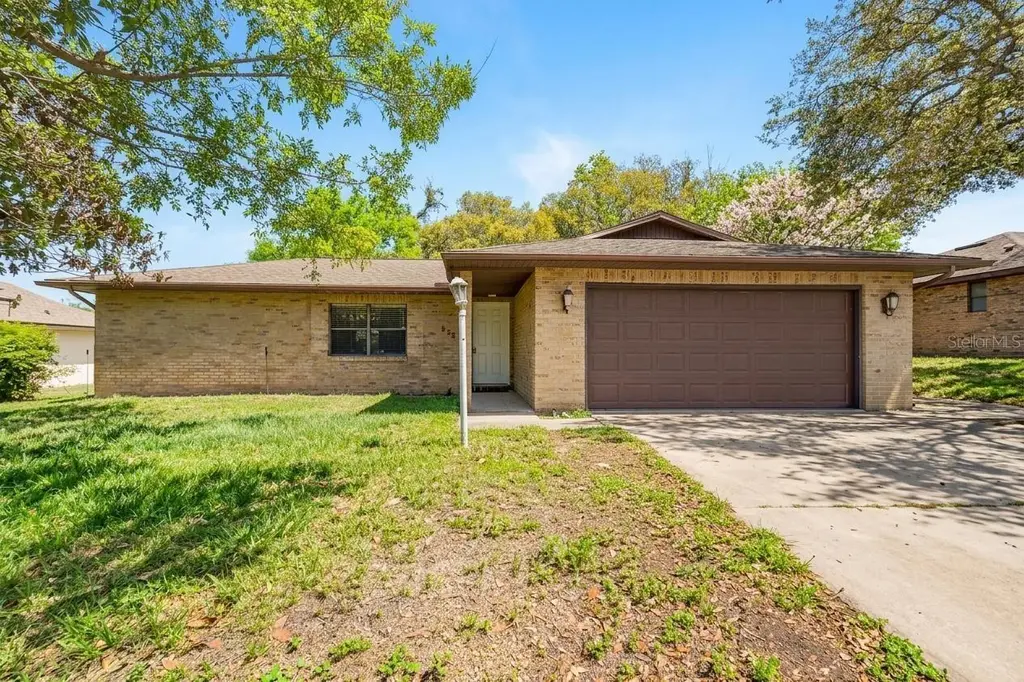
552 S Annapolis Dr · Deltona, FL
Flood risk 4/10 · Minor
- FEMA flood zone
- X (unshaded)
- Chance of flooding over 30 yrs
- 0.22%
- Est. flood insurance / yr
- $507 – $1,088
Fire risk 5/10 · Moderate
- Est. fire insurance / yr
- $947 – $1,759
Heat risk 9/10 · Severe
- Hot days now (above 107°F)
- 7 days/yr
- Hot days in 30 yrs
- 21 days/yr
Wind risk 9/10 · Severe
- Chance of severe wind over 30 yrs
- 99.0%
Air-quality risk 2/10 · Minimal
- Unhealthy air days now
- 1 days/yr
- Unhealthy air days in 30 yrs
- 1 days/yr
Risk factors via First Street. Map © Google.
Why this score? — see what drove the D grade
The composite is a weighted blend of 9 inputs, each scored 0–100. Each bar is that input's sub-score; the figure is the points it added to the 100-point composite (weight × sub-score).
- Cash flow +14.3/30.0
- ARV discount +7.5/15.0
- 1% rule +4.7/10.0
- DSCR +4.3/10.0
- Schools +3.9/10.0
- Livability +3.6/5.0
- Rent growth +2.7/5.0
- Condition / age +2.5/5.0
- Appreciation +0.0/10.0
$210,000
🖨 Deal sheet 📄 Offer letter ✓ Due diligence
Listing remarks
One or more photo(s) has been virtually staged. * * * * MULTIPLE OFFFRS * * * PLEASE SEND H & B OFFER BY 11:AM 5/11/2026 Solid BLOCK/STUCCO 3-bedroom, 2-bath home offers incredible potential for first-time homebuyers, or anyone looking to build a little sweat equity. Built in 1988 and situated on a spacious . 23-acre lot, this home features an open floor plan with split bedrooms for added privacy and comfort. The newer ceramic tile flooring runs throughout the home, giving it a clean and updated feel. Enjoy the outdoors from the large 12x16 screened back porch overlooking the private fenced backyard — perfect for pets, entertaining, or relaxing evenings at home. The two-car
Key facts
- Open floor plan
- Split bedroom layout
- Newer ceramic tile
Tags
Property features AI
Finance
- Other: Zoning: R-1; Property type: Residential — Single Family Residence; Number of rooms: 7; Unfurnished; One septic system reported
- HOA & community: No HOA association reported; Development: Deltona Lakes; Pets allowed
Exterior
- Parking: Attached 2-car garage (approximately 21 x 22)
- Utilities: Public water; Septic tank; Electricity connected; Cable available; Broadband/high-speed internet available
- Home design: Single-family residence; One story; Faces southwest; Listed condition: fixer
- Construction: Block and stucco construction; Shingle roof; Slab foundation; Built on a lot of roughly 0.23 acre
- Exterior features: Covered screened rear porch; Outdoor lighting; Private mailbox; Paved public-maintained road access; Lot located within city limits; Lot dimensions approximately 80 x 125
Interior
- Kitchen: Range; Refrigerator
- Bedrooms: 3 bedrooms
- Flooring: Ceramic tile
- Bathrooms: 2 full bathrooms
- Heating & cooling: Central heating; Central air conditioning
- Interior features: Ceiling fans; Open floor plan; Split-bedroom layout; Thermostat; Walk-in closets; Dining area (L-shaped)
- Laundry & utility: Laundry area in the garage
Neighborhood map
What this means for you Summary
Snapshot
- This is a 2-bed/2.0-bath single-family listed at $210k.
Deal economics
- At list price, monthly cash flow is $38 ($454/yr) — positive.
- The deal already cash-flows at list — no discount required.
- To meet the 1% rule (rent ≥ 1% of price), the offer needs to be $204k (2.6% below list).
- Recommended offer: $204k (2.6% below list) — sets the bar for 1% rule.
Location & tenants
- Location reads 71/100 on livability (#381 in FL) — a middle-class / working-renter tenant base. Strengths: cost of living A+, housing A+, health & safety A+; Watch: schools D+, amenities F, commute F.
- Volusia (suburban): math 44% / reading 49% proficiency, ranked #47 of 73 in FL (top 64%) — families likely to look elsewhere, expect single-tenant / working-renter base with shorter leases.
- Market conditions: Rents flat; 415 active listings in the ZIP; 4 comparable units currently listed for rent nearby; rentals at typical pace (median 21d on market — plan ~3-4 weeks tenant-placement turnaround); 3,402 units permitted in Volusia County in 2024 (681 in 5+ unit buildings).
- This rent runs 34% of the median local income ($73k/yr) — at the standard rent-burdened threshold; future hikes will face affordability resistance.
Forward outlook
- Local home prices are declining (-3.0%/yr); year-one equity from $1k of loan paydown is wiped out by about $6k of value loss. Plan a longer hold.
- Volusia County population projected at +19% by 2050 — long-run rental-demand tailwind backs the buy-and-hold thesis.
Negotiation context
- Only 3 days on market — expect competitive offers; lowballing is unlikely to land.
- Current owner paid $73k; list at $210k implies a 188% gain — meaningful room to come down on a strong offer.
Risks & watch-outs
- Climate carrying-cost: severe wind risk, 99% chance of damaging wind over 30y; moderate wildfire risk; extreme-heat days projected 7→21/yr by 2055 (HVAC capex compounding) — expect insurance premiums to compound above CPI over the hold.
Questions for the listing agent
- Is there a deadline driving the sale (1031 exchange, divorce, estate, relocation)? That informs how much negotiation room exists.
- Schools are D-rated, which usually means shorter tenancies and higher turnover. Who's the typical renter profile here, and what's been the actual vacancy rate?
- The area grade is low — what's the realistic commute time and amenity access for the typical tenant pool here? Any planned neighborhood developments (good or bad) we should know about?
- What's the average days-on-market for RENTAL listings here right now (not sales)? A rising rental-DOM trend means longer vacancies and softer asking-rent achievability than the comps imply.
- What's the recent tenant-quality profile in this submarket — average credit score on applications, eviction rate, late-payment / NSF rate, and stable-employment percentage? A property-management company in the area should have these aggregated.
- How much new for-sale + rental construction is in the pipeline within 1–3 miles? Heavy new supply typically softens prices + rents 12–24 months out; constrained supply supports both.
Investment metrics
- 1% rule
- 0.97% ✗
- Cap rate
- 6.51%
- Cash-on-cash
- 0.77%
- DSCR
- 1.03
- GRM
- 8.6
CMA / ARV
No comps found within radius.
Projected returns pro-forma
-3.0% appreciation · 0.61% rent growth · sell at horizon
- IRR
- -18.0%
- Equity multiple
- 0.38×
- Total profit
- $-36,311
- Equity at exit
- $31,312
- IRR
- -16.1%
- Equity multiple
- 0.20×
- Total profit
- $-46,858
- Equity at exit
- $18,157
Cash invested: $58,800 (down + closing). Projections, not guarantees.
Landlord ↔ Tenant lean methodology
- Overall (STATE)
- 87 Strongly Landlord-Friendly
- State Florida
- 87 Strongly Landlord-Friendly · R+3
- County
- — inherits STATE
- City
- — inherits STATE
ZIP-level market 32725
- Rents YoY
- 0.6%
- Active inventory
- 415
- Price-to-rent
- 8.6×
Monthly cashflow live
- Estimated rent
- $2,045 medium interval (Pro) →
- Mortgage (P&I)
- −$1,101
- Tax from tax record
- −$389 /mo · $4,664/yr
- Insurance
- −$88
- HOA
- −$0
- Vacancy / Maint / Mgmt
- −$429
- Net cashflow
- $38
Break-even live
UW: 25.0% down · 7.5% · 30yr · 1.5% tax · 5.0% vac · 8.0% maint · 8.0% mgmt
Financing live
Cash to close
- Down payment
- $52,500
- Closing costs
- $6,300
- Reserves months
- —
- Total cash needed
- —
Loan-product check · same deal, 3 products live
Conventional
25% down · 7.5% · 30yr
- Down + closing
- —
- Monthly P&I
- —
- Monthly cashflow
- —
- DSCR
- —
- Eligible?
- —
Personal DTI + credit; lowest rate.
DSCR
20% down · 8.5% · 30yr
- Down + closing
- —
- Monthly P&I
- —
- Monthly cashflow
- —
- DSCR
- —
- Eligible?
- —
No personal income docs; deal must DSCR.
Hard money
10% down · 12.0% · 12mo
- Down + closing
- —
- Monthly P&I
- —
- Monthly cashflow
- —
- DSCR
- —
- Eligible?
- —
Short-term bridge; refi at stabilization.
Rent comps 4 comps
| Address | Beds | Baths | Sqft | Rent | $/sqft | DOM | Units | Dist |
|---|---|---|---|---|---|---|---|---|
| 2234 N Normandy Blvd Deltona, FL | 3.0 | 2.0 | 1468 | $2,150 | $1.46 | 23d | 1 | 0.17mi |
| 2125 El Campo Ave Deltona, FL | 2.0 | 2.0 | 1358 | $1,989 | $1.46 | 21d | 1 | 0.47mi |
| 1112 Integra Landings Dr Orange City, FL | 1.0–3.0 | 1.0–2.0 | 1057 | $1,765 | $1.67 | 10d | 45 | 0.94mi |
| 882 Trumbull St Deltona, FL | 3.0 | 2.0 | 1403 | $2,076 | $1.48 | 11d | 1 | 1.21mi |
Listing history 4 events
-
2026-05-12status Pending
-
2026-05-08$210,000 Active
-
1999-07-10soldstatus $72,900
-
1995-06-01soldstatus $65,500
ⓘ Source: listings_history table (triggers on properties + properties_extension) + one-shot
backfill from property_details.listing_events for pre-trigger history.
Tax reassessment forecast FL · Resets to sale price
- Current annual tax
- $4,664 · $389/mo
- Projected year-2 tax
- $4,664 · $389/mo
- Expected delta
- $0/yr ($0/mo · 0.0%)
ⓘ Screening estimate from a state-policy table — verify with the county assessor before closing.
Climate risk First Street
- Flood 4/10 Moderate FEMA zone X (unshaded) · 22% chance over 30 yrs
- Wildfire 5/10 Major
- Heat 9/10 Extreme 7 d/yr ≥107°F today · 21 d/yr by 30 yrs out
- Wind 9/10 Extreme 99% chance of damaging wind over 30 yrs
- Air quality 2/10 Low 1 unhealthy d/yr today · 1 by 30 yrs out
Nearby sold comps map
Loading sold comps map…
Walkable amenities ~0.75 mi
Loading nearby amenities…
Taxation est. · year 1
- Rental income
- $24,536
- − Mortgage interest
- −$11,763
- − Property taxes
- −$4,664
- − Insurance
- −$1,050
- − Repairs & maintenance
- −$1,963
- − Management
- −$1,963
- − Depreciation
- −$6,109
- Taxable loss
- −$2,976
- Est. tax savings @ 24.0%
- +$714
- After-tax cash flow
- $1,169/yr
For passive investors: Depreciation is non-cash, so a rental often shows a tax loss while cash-flowing — sheltering income. Rental losses are passive: they offset passive income freely, and up to $25,000/yr can offset ordinary (W-2) income if you actively participate and your MAGI is under $100k (phasing out to $0 by $150k); unused losses carry forward. On sale, claimed depreciation is recaptured at up to 25%, and gains may owe capital-gains tax (a 1031 exchange can defer both). Figures are a year-1 estimate at your 24.0% rate — not tax advice; consult a CPA.
Schools (NCES district)
- District
- Volusia
- NCES district ID
- 1201920
- Math proficiency
- 44% ▼ -9.00%
- Reading proficiency
- 49% ▼ -3.00%
- Median HH income
- $42,946
- Composite
- 39.2/100
- National rank
- #4019
- State rank
- #47 of 73 in FL
Livability — Deltona
- Score
- 71/100
- State rank
- #381
- US rank
- #6749
Category grades
Schools grade is shown separately in the Schools card above.
Census & demographics
- Census place
- Deltona, FL
- County
- Volusia County · 556,871 people
- City population
- 101,355
- Metro
- Deltona-Daytona Beach-Ormond Beach, FL
- Population (ZIP)
- 51,987
- Household income
- $73,152
- Rent vs Own
- Severe rent burden
- 1051.0
Population outlook (Volusia County) Hauer SSP2
- Today (2025)
- 572,749 people
- By 2030
- 598,695 · +4.5%
- By 2040
- 644,880 · +12.6%
- By 2050
- 681,451 · +19.0%
- By 2075
- 759,957 · +32.7%
- By 2100
- 778,902 · +36.0%
Race, ethnicity, and origin ACS 2023
- Neighborhood character
- Diverse neighborhood (Simpson 0.63)
- Race & ethnicity
- White 45% Hispanic / Latino 39% Two or more races 12% Black 10% Asian 3%
- Hispanic origin (detail)
- Mexican 3% Puerto Rican 23% Cuban 4% Dominican 3%
- Common ancestry
- Romanian 1% Lithuanian 1% Serbian 1%
- Foreign-born
- 13% · Canada, Jamaica, Vietnam
- Languages at home
- 66% English-only · Spanish 30% Vietnamese 1% Other Indo-European 1%
Political lean MEDSL · Volusia
- 2024 margin
- Strong R (+21.8) · D 38.7% · R 60.5%
- 2008→2024 swing
- -27.4pp toward R · 2008: 5.7pp · 2024: -21.8pp
- All cycles
- 2024: R+21.8 2020: R+14.1 2016: R+13.1 2012: R+1.2 2008: D+5.7
Not yet ingested
- Civics
- —
Market trends
- HPI YoY
- ▼ -195.58%
- Current HPI
- 349.7999
- Rent YoY
- ▲ 0.61%
- Metro
- Deltona-Daytona Beach-Ormond Beach, FL
- State GDP YoY
- ▲ 3.28%
- F500 in state
- 36
Industry mix (Fortune 500 HQ in FL)
| Industry | F500 HQs | Revenue |
|---|---|---|
| Industrial Technology | 2 | $29B |
|
||
| Insurance | 2 | $17B |
|
||
| Retail | 1 | $60B |
|
||
| Technology Distribution | 1 | $58B |
|
||
| Homebuilding | 1 | $35B |
|
||
| Technology Manufacturing | 1 | $35B |
|
||
Price history
+220.6% since first listed4 events — show timeline
- 2026-05-12 Pending — Stellar MLS as Distributed by MLS Grid
- 2026-05-08 Listed $210,000 Stellar MLS as Distributed by MLS Grid
- 1999-07-10 Sold (Public Records) $72,900 Public Records
- 1995-06-01 Sold (Public Records) $65,500 Public Records
Property tax history
+15.7%/yrLatest (2025): $4,664 · +6.7% YoY. Source: county tax records.
Cash-flow waterfall
monthlySold comps — $/sqft
last 12 mo · ≤1 miLoading sold comps…