1891 N Lewis Ln · Mannford, OK
Flood risk 1/10 · Minimal
- FEMA flood zone
- —
- Chance of flooding over 30 yrs
- 0.0%
- Est. flood insurance / yr
- —
Fire risk 6/10 · Moderate
- Est. fire insurance / yr
- $2,463 – $4,575
Heat risk 5/10 · Moderate
- Hot days now (above 110°F)
- 7 days/yr
- Hot days in 30 yrs
- 18 days/yr
Wind risk 2/10 · Minimal
- Chance of severe wind over 30 yrs
- 4.0%
Air-quality risk 2/10 · Minimal
- Unhealthy air days now
- 1 days/yr
- Unhealthy air days in 30 yrs
- 2 days/yr
Risk factors via First Street. Map © Google.
Why this score? — see what drove the C grade
The composite is a weighted blend of 9 inputs, each scored 0–100. Each bar is that input's sub-score; the figure is the points it added to the 100-point composite (weight × sub-score).
- Cash flow +19.9/30.0
- Appreciation +10.0/10.0
- ARV discount +7.5/15.0
- DSCR +6.3/10.0
- 1% rule +4.0/10.0
- Livability +3.5/5.0
- Rent growth +2.5/5.0
- Condition / age +2.5/5.0
- Schools +2.1/10.0
$135,000
🖨 Deal sheet (PDF) 📄 Offer letter ✓ Due diligence
Listing remarks
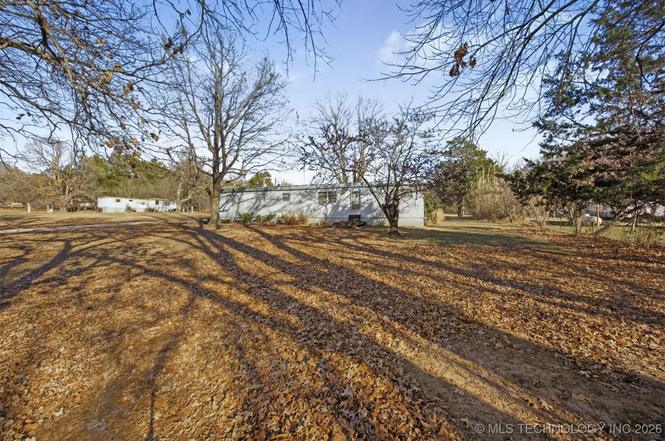
This 2+ acre Mannford property, just minutes from Keystone Lake offers the perfect escape. The 2 bed, 2 bath manufactured home is ideal for weekend getaways, full-time country living, or live in while you build your dream home! A newer 2 door garage sits on the property to house your boat, atv's or create your own workshop. Enjoy peaceful country life with easy access to the City. Your next home adventure is ready for you!
Key facts
- Newer 2 door garage
- 2 acre property
- 2.5 acre lot
Tags
Property features AI
Exterior
- Security: Storm shelter
- Utilities: Electricity available; Natural gas available; Public water; Public sewer
- Home design: Single-wide manufactured home; 1 story; Faces west
- Construction: Aluminum siding; Manufactured construction
- Exterior features: Enclosed patio; Patio; Barn(s); Partial fencing; Storm shelter; Mature trees
Interior
- Kitchen: Oven; Range; Refrigerator; Gas range connection
- Flooring: Carpet; Laminate
- Bathrooms: 2 full bathrooms
- Heating & cooling: Central heating (gas); Central air conditioning
- Interior features: Laminate counters; Gas range connection
- Laundry & utility: Washer hookup; Gas water heater
Neighborhood map
What this means for you Summary
Snapshot
- This is a 2-bed/1.0-bath manufactured listed at $135k.
Deal economics
- At list price, monthly cash flow is $163 ($2k/yr) — positive.
- The deal already cash-flows at list — no discount required.
- To meet the 1% rule (rent ≥ 1% of price), the offer needs to be $121k (10.5% below list).
- Recommended offer: $119k (12.0% below list) — sets the bar for market timing.
- Cap rate 7.7% vs local median 2.6% in Mannford — top-decile yield for the area; either an underpriced asset or a hidden risk that comps aren't pricing in. Stress-test before assuming the spread holds.
Location & tenants
- Location reads 69/100 on livability (#53 in OK) — a middle-class / working-renter tenant base. Strengths: crime A+, cost of living A+, housing A+; Watch: schools D-, amenities F, commute F.
- Mannford (town): math 25% / reading 22% proficiency, ranked #125 of 270 in OK (top 46%) — low school quality limits family demand, transient renter base, plan for 1-2y turnover.
- Market conditions: 61 active listings in the ZIP; 3 units permitted in Pawnee County in 2024 (0 in 5+ unit buildings).
Forward outlook
- In year one you build about $14k of equity ($933 loan paydown + $14k appreciation (10.0% local appreciation)).
- Pawnee County population projected to shrink 4% by 2050 — rents likely to lag national; underwrite the cash flow, not the appreciation.
- At projected returns (10.0% appreciation + 3.0% rent growth), your $38k cash investment doubles in ~3 years — after that, you're playing with house money.
- By year 3, paydown + projected appreciation supports a ~$37k cash-out refi (75% LTV) — recoverable capital for the next deal without selling this one.
Negotiation context
- It's been on market 162 days — a 12% lower offer ($119k) is reasonable based on typical stale-listing flexibility.
Risks & watch-outs
- Climate carrying-cost: major wildfire risk; extreme-heat days projected 7→18/yr by 2055 (HVAC capex compounding) — expect insurance premiums to compound above CPI over the hold.
Questions for the listing agent
- It's been on market 162 days. Have you received any prior offers? Is the seller open to a 12% concession, seller financing, or rate buy-down credit?
- Built in 1977 — when were the roof, HVAC, electrical panel, plumbing, and water heater last replaced?
- Why hasn't it sold? Are there any deal-killer items the seller is aware of (foundation, flood, title, zoning, code violations)?
- Is there a deadline driving the sale (1031 exchange, divorce, estate, relocation)? That informs how much negotiation room exists.
- Schools are D-rated, which usually means shorter tenancies and higher turnover. Who's the typical renter profile here, and what's been the actual vacancy rate?
- What's the average days-on-market for RENTAL listings here right now (not sales)? A rising rental-DOM trend means longer vacancies and softer asking-rent achievability than the comps imply.
- What's the recent tenant-quality profile in this submarket — average credit score on applications, eviction rate, late-payment / NSF rate, and stable-employment percentage? A property-management company in the area should have these aggregated.
- How much new for-sale + rental construction is in the pipeline within 1–3 miles? Heavy new supply typically softens prices + rents 12–24 months out; constrained supply supports both.
Investment metrics
- 1% rule
- 0.90% ✗
- Cap rate
- 7.75%
- Cash-on-cash
- 5.19%
- DSCR
- 1.23
- GRM
- 9.3
CMA / ARV
No comps found within radius.
Projected returns pro-forma
10.0% appreciation · 3.0% rent growth · sell at horizon
- IRR
- 28.0%
- Equity multiple
- 3.22×
- Total profit
- $83,869
- Equity at exit
- $121,619
- IRR
- 24.4%
- Equity multiple
- 7.31×
- Total profit
- $238,655
- Equity at exit
- $262,275
Cash invested: $37,800 (down + closing). Projections, not guarantees.
Landlord ↔ Tenant lean methodology
- Overall (STATE)
- 83 Strongly Landlord-Friendly
- State Oklahoma
- 83 Strongly Landlord-Friendly · R+20
- County
- — inherits STATE
- City
- — inherits STATE
ZIP-level market 74044
- Home prices YoY
- 10.7%
- Active inventory
- 61
- Price-to-rent
- 9.3×
Monthly cashflow live
- Estimated rent
- $1,209 medium interval (Pro) →
- Mortgage (P&I)
- −$708
- Tax from tax record
- −$27 /mo · $328/yr
- Insurance
- −$56
- HOA
- −$0
- Vacancy / Maint / Mgmt
- −$254
- Net cashflow
- $163
Break-even live
Sensitivity live
| Price | -10% $240 | -5% $202 | +0% $163 | +5% $125 | +10% $87 |
|---|---|---|---|---|---|
| Rent | -10% $68 | -5% $116 | +0% $163 | +5% $211 | +10% $259 |
| Rate | -1.0pp $231 | -0.5pp $198 | base $163 | +0.5pp $129 | +1.0pp $93 |
UW: 25.0% down · 7.5% · 30yr · 1.5% tax · 5.0% vac · 8.0% maint · 8.0% mgmt
Financing live
Cash to close
- Down payment
- $33,750
- Closing costs
- $4,050
- Reserves months
- —
- Total cash needed
- —
Loan-product check · same deal, 3 products live
Conventional
25% down · 7.5% · 30yr
- Down + closing
- —
- Monthly P&I
- —
- Monthly cashflow
- —
- DSCR
- —
- Eligible?
- —
Personal DTI + credit; lowest rate.
DSCR
20% down · 8.5% · 30yr
- Down + closing
- —
- Monthly P&I
- —
- Monthly cashflow
- —
- DSCR
- —
- Eligible?
- —
No personal income docs; deal must DSCR.
Hard money
10% down · 12.0% · 12mo
- Down + closing
- —
- Monthly P&I
- —
- Monthly cashflow
- —
- DSCR
- —
- Eligible?
- —
Short-term bridge; refi at stabilization.
Listing history 15 events
-
2026-06-18days on market $135,000 Active 162 DOM
-
2026-06-17days on market $135,000 Active 161 DOM
-
2026-06-16days on market $135,000 Active 160 DOM
-
2026-06-15days on market $135,000 Active 159 DOM
-
2026-06-13days on market $135,000 Active 157 DOM
-
2026-06-10days on market $135,000 Active 154 DOM
-
2026-06-09days on market $135,000 Active 153 DOM
-
2026-06-08days on market $135,000 Active 152 DOM
-
2026-06-07days on market $135,000 Active 151 DOM
-
2026-06-03days on market $135,000 Active 147 DOM
-
2026-06-02days on market $135,000 Active 146 DOM
-
2026-06-01days on market $135,000 Active 145 DOM
-
2026-05-31days on market $135,000 Active 144 DOM
-
2026-02-27price $135,000
-
2026-01-07$155,000 Active
ⓘ Source: listings_history table (triggers on properties + properties_extension) + one-shot
backfill from property_details.listing_events for pre-trigger history.
Tax reassessment forecast OK · Resets to sale price
- Current annual tax
- $328 · $27/mo
- Projected year-2 tax
- $1,215 · $101/mo
- Expected delta
- +$887/yr (+$74/mo · 270.4%)
ⓘ Screening estimate from a state-policy table — verify with the county assessor before closing.
Climate risk First Street
- Flood 1/10 Low 0% chance over 30 yrs
- Wildfire 6/10 Major
- Heat 5/10 Major 7 d/yr ≥110°F today · 18 d/yr by 30 yrs out
- Wind 2/10 Low 4% chance of damaging wind over 30 yrs
- Air quality 2/10 Low 1 unhealthy d/yr today · 2 by 30 yrs out
Nearby sold comps map
Loading sold comps map…
Walkable amenities ~0.75 mi
Loading nearby amenities…
Taxation est. · year 1
- Rental income
- $14,507
- − Mortgage interest
- −$7,562
- − Property taxes
- −$328
- − Insurance
- −$675
- − Repairs & maintenance
- −$1,161
- − Management
- −$1,161
- − Depreciation
- −$3,927
- Taxable loss
- −$307
- Est. tax savings @ 24.0%
- +$74
- After-tax cash flow
- $2,036/yr
For passive investors: Depreciation is non-cash, so a rental often shows a tax loss while cash-flowing — sheltering income. Rental losses are passive: they offset passive income freely, and up to $25,000/yr can offset ordinary (W-2) income if you actively participate and your MAGI is under $100k (phasing out to $0 by $150k); unused losses carry forward. On sale, claimed depreciation is recaptured at up to 25%, and gains may owe capital-gains tax (a 1031 exchange can defer both). Figures are a year-1 estimate at your 24.0% rate — not tax advice; consult a CPA.
Schools (NCES district)
- District
- Mannford
- NCES district ID
- 4018840
- Math proficiency
- 25% ▼ -16.00%
- Reading proficiency
- 22% ▼ -15.00%
- Median HH income
- $47,044
- Composite
- 20.55/100
- National rank
- #8561
- State rank
- #125 of 270 in OK
Livability — Mannford
- Score
- 69/100
- State rank
- #53
- US rank
- #8759
Category grades
Schools grade is shown separately in the Schools card above.
Census & demographics
- Population (ZIP)
- 8,255
Population outlook (Pawnee County) Hauer SSP2
- Today (2025)
- 16,219 people
- By 2030
- 16,028 · -1.2%
- By 2040
- 15,724 · -3.1%
- By 2050
- 15,563 · -4.0%
- By 2075
- 15,905 · -1.9%
- By 2100
- 16,058 · -1.0%
Race, ethnicity, and origin ACS 2023
- Neighborhood character
- Predominantly White (72%)
- Race & ethnicity
- White 72% Native American 12% Hispanic / Latino 9% Two or more races 7% Black 1%
- Hispanic origin (detail)
- Mexican 7%
- Common ancestry
- Slovak 5% Portuguese 1% Italian 1%
- Foreign-born
- 1%
- Languages at home
- 96% English-only · Spanish 3%
Political lean MEDSL · Pawnee
- 2024 margin
- Solid R (+58.9) · D 19.7% · R 78.6% · Other 1.7%
- 2008→2024 swing
- -21.4pp toward R · 2008: -37.4pp · 2024: -58.9pp
- All cycles
- 2024: R+58.9 2020: R+57.5 2016: R+53.2 2012: R+40.0 2008: R+37.4
Not yet ingested
- Civics
- —
Market trends
- HPI YoY
- ▲ 26.24%
- Current HPI
- 272.61
- Rent YoY
- —
- Metro
- —
- State GDP YoY
- ▲ 1.55%
- F500 in state
- 6
Industry mix (Fortune 500 HQ in OK)
| Industry | F500 HQs | Revenue |
|---|---|---|
| Energy | 3 | $48B |
|
||
Price history
-12.9% since first listed2 events — show timeline
- 2026-02-27 Price Changed $135,000 MLS Technology, Inc.
- 2026-01-07 Listed $155,000 MLS Technology, Inc.
Property tax history
+1.5%/yrLatest (2025): $328 · +5.1% YoY. Source: county tax records.
Cash-flow waterfall
monthlySold comps — $/sqft
last 12 mo · ≤1 miLoading sold comps…