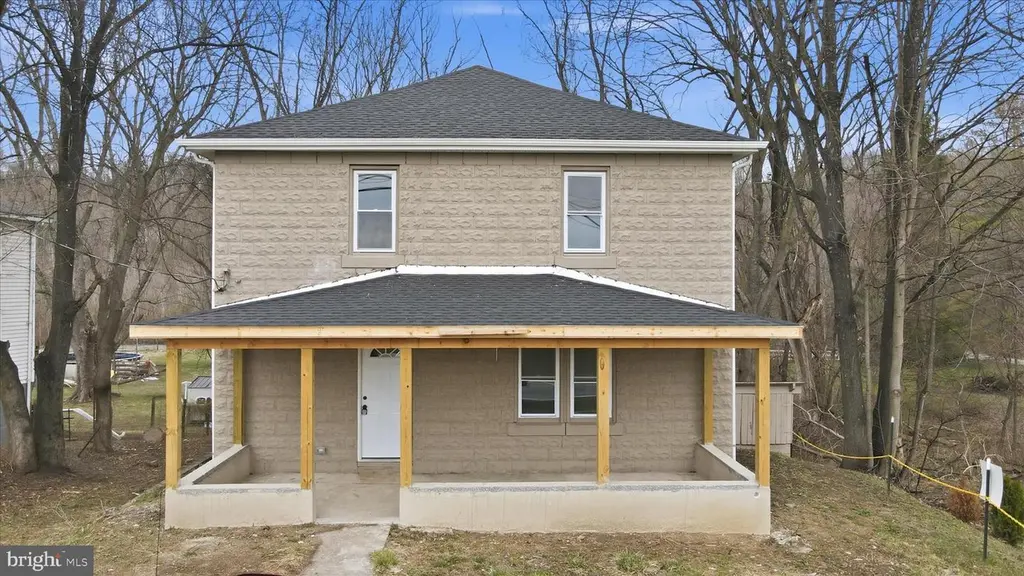
1035 Hammonds Mill Rd · Hedgesville, WV
Flood risk 1/10 · Minimal
- FEMA flood zone
- X (unshaded)
- Chance of flooding over 30 yrs
- 0.0%
- Est. flood insurance / yr
- $473 – $860
Fire risk 3/10 · Minor
- Est. fire insurance / yr
- $787 – $1,461
Heat risk 5/10 · Moderate
- Hot days now (above 101°F)
- 7 days/yr
- Hot days in 30 yrs
- 15 days/yr
Wind risk 2/10 · Minimal
- Chance of severe wind over 30 yrs
- 2.0%
Air-quality risk 1/10 · Minimal
- Unhealthy air days now
- 0 days/yr
- Unhealthy air days in 30 yrs
- 0 days/yr
Risk factors via First Street. Map © Google.
Why this score? — see what drove the C+ grade
The composite is a weighted blend of 9 inputs, each scored 0–100. Each bar is that input's sub-score; the figure is the points it added to the 100-point composite (weight × sub-score).
- Cash flow +17.7/30.0
- ARV discount +15.0/15.0
- Appreciation +10.0/10.0
- DSCR +5.5/10.0
- 1% rule +3.6/10.0
- Livability +3.4/5.0
- Schools +2.6/10.0
- Rent growth +2.5/5.0
- Condition / age +2.5/5.0
$254,900
🖨 Deal sheet 📄 Offer letter ✓ Due diligence
Listing remarks
Updated home in Hedgesville minutes to town and Spring Mills/I-81! This home features a new roof, windows, HVAC, water heater, flooring, kitchen, bathrooms, and other essentials. Not much missed. Check it out today! High speed internet believed to be available. On public water. Parking and getting in and out is tight.
Key facts
- New kitchen
- New hvac
- New flooring
Tags
Property features AI
Finance
- Financial info: Fee simple ownership
Exterior
- Parking: Driveway
- Utilities: Public water; On-site septic; Electric service
- Home design: Detached property; Effective year of major remodel: 2025; Year built source: Assessor
- Construction: Block construction; Permanent foundation
- Exterior features: Lot roughly 65 feet wide; Not on tidal water; Above-grade and below-grade structures
Interior
- Bedrooms: Four bedrooms on the first upper level
- Bathrooms: Two full bathrooms (one on main level, one on first upper level)
- Heating & cooling: Heat pump heating; Central air conditioning; Electric heating and cooling; Electric hot water
- Interior features: Full basement
Neighborhood map
What this means for you Summary
Snapshot
- This is a 4-bed/2.0-bath single-family listed at $255k.
Deal economics
- At list price, monthly cash flow is $204 ($2k/yr) — positive.
- The deal already cash-flows at list — no discount required.
- To meet the 1% rule (rent ≥ 1% of price), the offer needs to be $220k (13.7% below list).
- Recommended offer: $220k (13.7% below list) — sets the bar for 1% rule.
- Cap rate 7.3% vs local median 4.2% in Hedgesville — top-decile yield for the area; either an underpriced asset or a hidden risk that comps aren't pricing in. Stress-test before assuming the spread holds.
Location & tenants
- Location reads 67/100 on livability (#88 in WV) — a middle-class / working-renter tenant base. Strengths: cost of living A+, housing A+, employment A; Watch: amenities F, commute F, health & safety F.
- Berkeley County Schools (other): math 21% / reading 38% proficiency, ranked #24 of 55 in WV (top 44%) — low school quality limits family demand, transient renter base, plan for 1-2y turnover.
- Market conditions: 96 active listings in the ZIP; 1 comparable units currently listed for rent nearby; solid renter incomes; 1,460 units permitted in Berkeley County in 2024 (16 in 5+ unit buildings).
- This rent runs 30% of the median local income ($87k/yr) — at the standard rent-burdened threshold; future hikes will face affordability resistance.
Forward outlook
- In year one you build about $27k of equity ($2k loan paydown + $25k appreciation (10.0% local appreciation)).
- Berkeley County population projected at +25% by 2050 — long-run rental-demand tailwind backs the buy-and-hold thesis.
- At projected returns (10.0% appreciation + 3.0% rent growth), your $71k cash investment doubles in ~3 years — after that, you're playing with house money.
- By year 2, paydown + projected appreciation supports a ~$44k cash-out refi (75% LTV) — recoverable capital for the next deal without selling this one.
Negotiation context
- It's been on market 79 days — a 6% lower offer ($240k) is reasonable based on typical stale-listing flexibility.
- 2 sale attempts; this cycle's ask has dropped $15k (6%) from the opening price — seller is motivated, your offer sets the floor, not the list.
Risks & watch-outs
- Watch-outs: built in 1928 — expect roof / HVAC / electrical / plumbing capex.
- Climate carrying-cost: extreme-heat days projected 7→15/yr by 2055 (HVAC capex compounding) — expect insurance premiums to compound above CPI over the hold.
Questions for the listing agent
- It's been on market 79 days. Have you received any prior offers? Is the seller open to a 14% concession, seller financing, or rate buy-down credit?
- Built in 1928 — when were the roof, HVAC, electrical panel, plumbing, and water heater last replaced?
- Why hasn't it sold? Are there any deal-killer items the seller is aware of (foundation, flood, title, zoning, code violations)?
- Is there a deadline driving the sale (1031 exchange, divorce, estate, relocation)? That informs how much negotiation room exists.
- What's the average days-on-market for RENTAL listings here right now (not sales)? A rising rental-DOM trend means longer vacancies and softer asking-rent achievability than the comps imply.
- What's the recent tenant-quality profile in this submarket — average credit score on applications, eviction rate, late-payment / NSF rate, and stable-employment percentage? A property-management company in the area should have these aggregated.
- How much new for-sale + rental construction is in the pipeline within 1–3 miles? Heavy new supply typically softens prices + rents 12–24 months out; constrained supply supports both.
Investment metrics
- 1% rule
- 0.86% ✗
- Cap rate
- 7.26%
- Cash-on-cash
- 3.44%
- DSCR
- 1.15
- GRM
- 9.7
CMA / ARV
- ARV (on-the-fly)
- $325,728
- Comps found
- 2
Show comp detail 2 sales within ~0.75 mi
| Address | Dist | Beds/Ba | Sqft | Sold | Price | $/sf | Match |
|---|---|---|---|---|---|---|---|
| 307-307.5 Mary St N | 0.62mi | 3/1.5 (-1) | 1,936 (+3%) | 5mo | $251,000 | $130 | 54 |
| 405 N Mary St | 0.55mi | 3/2.0 (-1) | 1,694 (-10%) | 20mo | $294,900 | $174 | 37 |
Match score weights: distance 35% · size 25% · config 20% · recency 20%. Top-matched comps best support the ARV.
Projected returns pro-forma
10.0% appreciation · 3.0% rent growth · sell at horizon
- IRR
- 26.7%
- Equity multiple
- 3.13×
- Total profit
- $151,737
- Equity at exit
- $229,634
- IRR
- 23.4%
- Equity multiple
- 7.11×
- Total profit
- $436,389
- Equity at exit
- $495,215
Cash invested: $71,372 (down + closing). Projections, not guarantees.
Landlord ↔ Tenant lean methodology
- Overall (STATE)
- 83 Strongly Landlord-Friendly
- State West Virginia
- 83 Strongly Landlord-Friendly · R+22
- County
- — inherits STATE
- City
- — inherits STATE
ZIP-level market 25427
- Home prices YoY
- 5.6%
- Active inventory
- 96
- Price-to-rent
- 9.7×
Monthly cashflow live
- Estimated rent
- $2,199 medium interval (Pro) →
- Mortgage (P&I)
- −$1,337
- Tax from tax record
- −$90 /mo · $1,083/yr
- Insurance
- −$106
- HOA
- −$0
- Vacancy / Maint / Mgmt
- −$462
- Net cashflow
- $204
Break-even live
UW: 25.0% down · 7.5% · 30yr · 1.5% tax · 5.0% vac · 8.0% maint · 8.0% mgmt
Financing live
Cash to close
- Down payment
- $63,725
- Closing costs
- $7,647
- Reserves months
- —
- Total cash needed
- —
Loan-product check · same deal, 3 products live
Conventional
25% down · 7.5% · 30yr
- Down + closing
- —
- Monthly P&I
- —
- Monthly cashflow
- —
- DSCR
- —
- Eligible?
- —
Personal DTI + credit; lowest rate.
DSCR
20% down · 8.5% · 30yr
- Down + closing
- —
- Monthly P&I
- —
- Monthly cashflow
- —
- DSCR
- —
- Eligible?
- —
No personal income docs; deal must DSCR.
Hard money
10% down · 12.0% · 12mo
- Down + closing
- —
- Monthly P&I
- —
- Monthly cashflow
- —
- DSCR
- —
- Eligible?
- —
Short-term bridge; refi at stabilization.
Rent comps 1 comps
| Address | Beds | Baths | Sqft | Rent | $/sqft | DOM | Units | Dist |
|---|---|---|---|---|---|---|---|---|
| 91 Grindstone Dr Hedgesville, WV | 3.0 | 3.5 | 1960 | $1,830 | $0.93 | 21d | 1 | 0.74mi |
Listing history 19 events
-
2026-06-18days on market $254,900 Active 79 DOM
-
2026-06-17days on market $254,900 Active 78 DOM
-
2026-06-16days on market $254,900 Active 77 DOM
-
2026-06-15days on market $254,900 Active 76 DOM
-
2026-06-14days on market $254,900 Active 74 DOM
-
2026-06-13days on market $254,900 Active 73 DOM
-
2026-06-10days on market $254,900 Active 71 DOM
-
2026-06-09days on market $254,900 Active 70 DOM
-
2026-06-08days on market $254,900 Active 69 DOM
-
2026-06-07days on market $254,900 Active 68 DOM
-
2026-06-02days on market $254,900 Active 63 DOM
-
2026-06-01days on market $254,900 Active 62 DOM
-
2026-05-31days on market $254,900 Active 61 DOM
-
2026-05-30days on market $254,900 Active 60 DOM
-
2026-05-20price $254,900
-
2026-05-05status Active
-
2026-04-30historical Active Under Contract
-
2026-04-09price $259,900
-
2026-03-26$269,900 Active
ⓘ Source: listings_history table (triggers on properties + properties_extension) + one-shot
backfill from property_details.listing_events for pre-trigger history.
Tax reassessment forecast WV · Resets to sale price
- Current annual tax
- $1,083 · $90/mo
- Projected year-2 tax
- $1,504 · $125/mo
- Expected delta
- +$421/yr (+$35/mo · 38.9%)
ⓘ Screening estimate from a state-policy table — verify with the county assessor before closing.
Climate risk First Street
- Flood 1/10 Low FEMA zone X (unshaded) · 0% chance over 30 yrs
- Wildfire 3/10 Moderate
- Heat 5/10 Major 7 d/yr ≥101°F today · 15 d/yr by 30 yrs out
- Wind 2/10 Low 2% chance of damaging wind over 30 yrs
- Air quality 1/10 Low 0 unhealthy d/yr today · 0 by 30 yrs out
Nearby sold comps map
Loading sold comps map…
Walkable amenities ~0.75 mi
Loading nearby amenities…
Taxation est. · year 1
- Rental income
- $26,393
- − Mortgage interest
- −$14,278
- − Property taxes
- −$1,083
- − Insurance
- −$1,274
- − Repairs & maintenance
- −$2,111
- − Management
- −$2,111
- − Depreciation
- −$7,415
- Taxable loss
- −$1,880
- Est. tax savings @ 24.0%
- +$451
- After-tax cash flow
- $2,904/yr
For passive investors: Depreciation is non-cash, so a rental often shows a tax loss while cash-flowing — sheltering income. Rental losses are passive: they offset passive income freely, and up to $25,000/yr can offset ordinary (W-2) income if you actively participate and your MAGI is under $100k (phasing out to $0 by $150k); unused losses carry forward. On sale, claimed depreciation is recaptured at up to 25%, and gains may owe capital-gains tax (a 1031 exchange can defer both). Figures are a year-1 estimate at your 24.0% rate — not tax advice; consult a CPA.
Schools (NCES district)
- District
- Berkeley County Schools
- NCES district ID
- 5400060
- Math proficiency
- 21% ▼ -12.00%
- Reading proficiency
- 38% ▼ -6.00%
- Median HH income
- $54,599
- Composite
- 26.16/100
- National rank
- #7273
- State rank
- #24 of 55 in WV
Livability — Hedgesville
- Score
- 67/100
- State rank
- #88
- US rank
- #10335
Category grades
Schools grade is shown separately in the Schools card above.
Census & demographics
- County
- Berkeley County · 85,235 people
- City population
- 16,595
- Metro
- Hagerstown-Martinsburg, MD-WV
- Population (ZIP)
- 16,595
- Household income
- $87,184
- Rent vs Own
- Severe rent burden
- 120.0
Population outlook (Berkeley County) Hauer SSP2
- Today (2025)
- 127,359 people
- By 2030
- 134,684 · +5.8%
- By 2040
- 148,219 · +16.4%
- By 2050
- 159,300 · +25.1%
- By 2075
- 179,920 · +41.3%
- By 2100
- 183,896 · +44.4%
Race, ethnicity, and origin ACS 2023
- Neighborhood character
- Predominantly White (94%)
- Race & ethnicity
- White 94% Two or more races 4% Hispanic / Latino 2%
- Common ancestry
- Slovak 4% Lithuanian 3% Italian 3%
- Foreign-born
- 1% · Canada
Political lean MEDSL · Berkeley
- 2024 margin
- Solid R (+35.8) · D 31.2% · R 67.0% · Other 1.8%
- 2008→2024 swing
- -22.8pp toward R · 2008: -13.0pp · 2024: -35.8pp
- All cycles
- 2024: R+35.8 2020: R+31.2 2016: R+37.2 2012: R+21.3 2008: R+13.0
Not yet ingested
- Civics
- —
Market trends
- HPI YoY
- ▲ 14.42%
- Current HPI
- 270.4542
- Rent YoY
- —
- Metro
- Hagerstown-Martinsburg, MD-WV
- State GDP YoY
- —
- F500 in state
- 0
Price history
-5.6% since first listed5 events — show timeline
- 2026-05-20 Price Changed $254,900 BRIGHT MLS
- 2026-05-05 Relisted — BRIGHT MLS
- 2026-04-30 Contingent — BRIGHT MLS
- 2026-04-09 Price Changed $259,900 BRIGHT MLS
- 2026-03-26 Listed $269,900 BRIGHT MLS
Property tax history
+13.8%/yrLatest (2025): $1,083 · -0.1% YoY. Source: county tax records.
Cash-flow waterfall
monthlySold comps — $/sqft
last 12 mo · ≤1 miLoading sold comps…