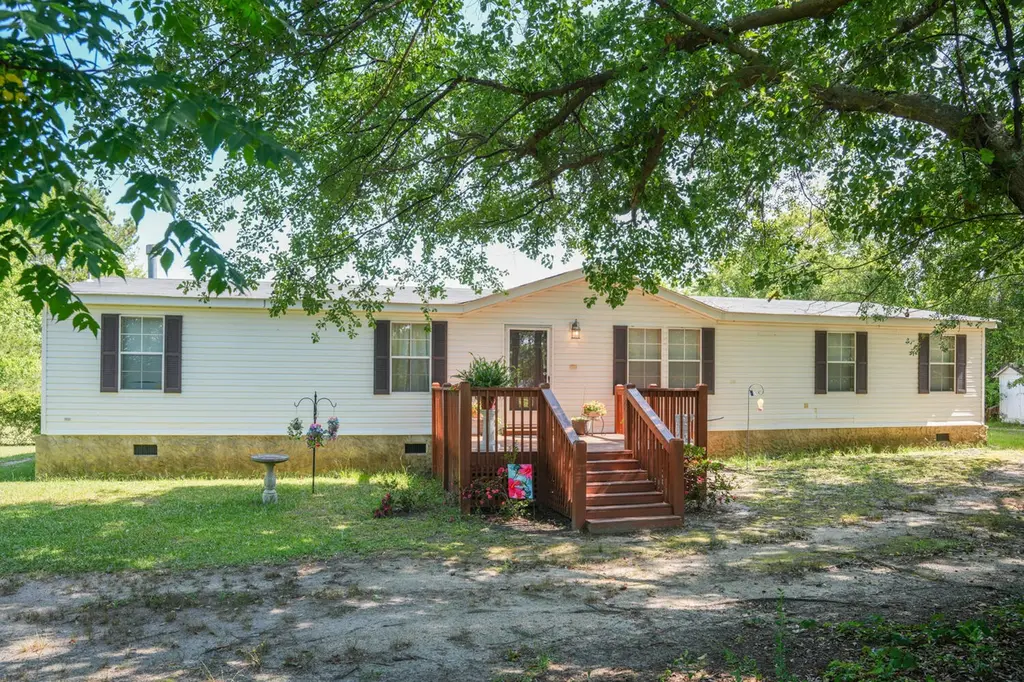
6057 Old Augusta Hwy · Harlem, GA
Flood risk 1/10 · Minimal
- FEMA flood zone
- X (unshaded)
- Chance of flooding over 30 yrs
- 0.0%
- Est. flood insurance / yr
- $507 – $1,088
Fire risk 5/10 · Moderate
- Est. fire insurance / yr
- $963 – $1,789
Heat risk 6/10 · Moderate
- Hot days now (above 105°F)
- 7 days/yr
- Hot days in 30 yrs
- 17 days/yr
Wind risk 6/10 · Moderate
- Chance of severe wind over 30 yrs
- 67.0%
Air-quality risk 2/10 · Minimal
- Unhealthy air days now
- 1 days/yr
- Unhealthy air days in 30 yrs
- 1 days/yr
Risk factors via First Street. Map © Google.
Why this score? — see what drove the D grade
The composite is a weighted blend of 9 inputs, each scored 0–100. Each bar is that input's sub-score; the figure is the points it added to the 100-point composite (weight × sub-score).
- Cash flow +13.6/30.0
- ARV discount +7.5/15.0
- Schools +4.5/10.0
- DSCR +4.1/10.0
- Livability +3.2/5.0
- 1% rule +2.7/10.0
- Rent growth +2.5/5.0
- Condition / age +2.5/5.0
- Appreciation +0.0/10.0
$215,000
🖨 Deal sheet (PDF) 📄 Offer letter ✓ Due diligence
Listing remarks
Peaceful Living on 1.74 Acres in Harlem! Welcome home to this spacious, well maintained 3-bedroom, 2-bath gem nestled on 1.74 acres of flat, open land--perfect for enjoying country living with all the comforts of home. Boasting 1,848 sq ft of well-designed living space, this property offers generous room inside and out. The flat lot provides endless potential! Located just minutes from downtown Harlem and Fort Gordon, this quiet retreat combines privacy with convenience. Don't miss this rare opportunity!
Key facts
- 1.74 acre lot
- Built 2002
Neighborhood map
What this means for you Summary
Snapshot
- This is a 3-bed/2.0-bath other listed at $215k.
Deal economics
- At list price, monthly cash flow is $13 ($161/yr) — positive.
- The deal already cash-flows at list — no discount required.
- To meet the 1% rule (rent ≥ 1% of price), the offer needs to be $166k (22.8% below list).
- Recommended offer: $166k (22.8% below list) — sets the bar for 1% rule.
- Cap rate 6.4% vs local median 3.9% in Harlem — top-decile yield for the area; either an underpriced asset or a hidden risk that comps aren't pricing in. Stress-test before assuming the spread holds.
Location & tenants
- Location reads 64/100 on livability (#256 in GA) — a middle-class / working-renter tenant base. Strengths: cost of living A+, housing A+, crime A; Watch: amenities F, commute F, employment D-.
- Columbia County (suburban): math 49% / reading 52% proficiency, ranked #13 of 174 in GA (top 8%) — acceptable for families but not a draw, mixed tenant base, ~2y average lease.
- Zoned schools: North Harlem Elementary School (math 41% / reading 40%, grade F, #419 of 1,228 statewide, top 35%, 862 students, 48% FRL); Harlem Middle School (math 36% / reading 42%, grade F, #155 of 470 statewide, top 33%, 981 students, 39% FRL); Harlem High School (math 8% / reading 22%, grade F, #297 of 424 statewide, top 74%, 1,223 students, 33% FRL).
- Zoned-school proficiency averages 31% at this address vs 50% district-wide (-19 pts) — the specific schools serving this property underperform the Columbia County average; the district grade overstates school quality for this exact location.
- Market conditions: 146 active listings in the ZIP; 1,213 units permitted in Columbia County in 2024 (0 in 5+ unit buildings).
Forward outlook
- Local home prices are declining (-3.0%/yr); year-one equity from $1k of loan paydown is wiped out by about $6k of value loss. Plan a longer hold.
- Columbia County population projected at +62% by 2050 — long-run rental-demand tailwind backs the buy-and-hold thesis.
Negotiation context
- Only 0 days on market — expect competitive offers; lowballing is unlikely to land.
- 5 sale attempts with the ask held roughly flat each time — persistent listings suggest the price (not the market) is what's stuck; bring a comps-based counter.
- Current owner paid $28k; list at $215k implies a 663% gain — meaningful room to come down on a strong offer.
Risks & watch-outs
- Climate carrying-cost: major wind risk, 67% chance of damaging wind over 30y; moderate wildfire risk; extreme-heat days projected 7→17/yr by 2055 (HVAC capex compounding) — expect insurance premiums to compound above CPI over the hold.
Questions for the listing agent
- Is there a deadline driving the sale (1031 exchange, divorce, estate, relocation)? That informs how much negotiation room exists.
- Schools are D-rated, which usually means shorter tenancies and higher turnover. Who's the typical renter profile here, and what's been the actual vacancy rate?
- The area grade is low — what's the realistic commute time and amenity access for the typical tenant pool here? Any planned neighborhood developments (good or bad) we should know about?
- What's the average days-on-market for RENTAL listings here right now (not sales)? A rising rental-DOM trend means longer vacancies and softer asking-rent achievability than the comps imply.
- What's the recent tenant-quality profile in this submarket — average credit score on applications, eviction rate, late-payment / NSF rate, and stable-employment percentage? A property-management company in the area should have these aggregated.
- How much new for-sale + rental construction is in the pipeline within 1–3 miles? Heavy new supply typically softens prices + rents 12–24 months out; constrained supply supports both.
Investment metrics
- 1% rule
- 0.77% ✗
- Cap rate
- 6.37%
- Cash-on-cash
- 0.27%
- DSCR
- 1.01
- GRM
- 10.8
CMA / ARV
No comps found within radius.
Projected returns pro-forma
-3.0% appreciation · 3.0% rent growth · sell at horizon
- IRR
- -15.9%
- Equity multiple
- 0.43×
- Total profit
- $-34,075
- Equity at exit
- $32,057
- IRR
- -7.6%
- Equity multiple
- 0.52×
- Total profit
- $-28,939
- Equity at exit
- $18,589
Cash invested: $60,200 (down + closing). Projections, not guarantees.
Landlord ↔ Tenant lean methodology
- Overall (STATE)
- 90 Strongly Landlord-Friendly
- State Georgia
- 90 Strongly Landlord-Friendly · R+3
- County
- — inherits STATE
- City
- — inherits STATE
ZIP-level market 30814
- Home prices YoY
- -3.7%
- Active inventory
- 146
- Price-to-rent
- 10.8×
Monthly cashflow live
- Estimated rent
- $1,659 medium interval (Pro) →
- Mortgage (P&I)
- −$1,127
- Tax from tax record
- −$80 /mo · $962/yr
- Insurance
- −$90
- HOA
- −$0
- Vacancy / Maint / Mgmt
- −$348
- Net cashflow
- $13
Break-even live
Sensitivity live
| Price | -10% $135 | -5% $74 | +0% $13 | +5% $-47 | +10% $-108 |
|---|---|---|---|---|---|
| Rent | -10% $-118 | -5% $-52 | +0% $13 | +5% $79 | +10% $145 |
| Rate | -1.0pp $122 | -0.5pp $68 | base $13 | +0.5pp $-42 | +1.0pp $-99 |
UW: 25.0% down · 7.5% · 30yr · 1.5% tax · 5.0% vac · 8.0% maint · 8.0% mgmt
Financing live
Cash to close
- Down payment
- $53,750
- Closing costs
- $6,450
- Reserves months
- —
- Total cash needed
- —
Loan-product check · same deal, 3 products live
Conventional
25% down · 7.5% · 30yr
- Down + closing
- —
- Monthly P&I
- —
- Monthly cashflow
- —
- DSCR
- —
- Eligible?
- —
Personal DTI + credit; lowest rate.
DSCR
20% down · 8.5% · 30yr
- Down + closing
- —
- Monthly P&I
- —
- Monthly cashflow
- —
- DSCR
- —
- Eligible?
- —
No personal income docs; deal must DSCR.
Hard money
10% down · 12.0% · 12mo
- Down + closing
- —
- Monthly P&I
- —
- Monthly cashflow
- —
- DSCR
- —
- Eligible?
- —
Short-term bridge; refi at stabilization.
Listing history 17 events
-
2026-04-27status Pending
-
2026-04-20status Active
-
2026-04-05historical
-
2026-04-05historical
-
2026-03-31status Pending
-
2026-03-31historical
-
2026-03-27$215,000 Active
-
2026-03-27$215,000
-
2025-07-15historical
-
2025-07-15historical
-
2025-07-14$199,900
-
2025-07-14$199,900
-
2003-10-22soldstatus $28,192
-
2003-06-05soldstatus $23,075
-
2001-08-24soldstatus $19,000
-
2000-09-05soldstatus $17,150
-
1999-11-11soldstatus $16,600
ⓘ Source: listings_history table (triggers on properties + properties_extension) + one-shot
backfill from property_details.listing_events for pre-trigger history.
Tax reassessment forecast GA · Resets to sale price
- Current annual tax
- $962 · $80/mo
- Projected year-2 tax
- $1,978 · $165/mo
- Expected delta
- +$1,016/yr (+$85/mo · 105.5%)
ⓘ Screening estimate from a state-policy table — verify with the county assessor before closing.
Climate risk First Street
- Flood 1/10 Low FEMA zone X (unshaded) · 0% chance over 30 yrs
- Wildfire 5/10 Major
- Heat 6/10 Major 7 d/yr ≥105°F today · 17 d/yr by 30 yrs out
- Wind 6/10 Major 67% chance of damaging wind over 30 yrs
- Air quality 2/10 Low 1 unhealthy d/yr today · 1 by 30 yrs out
Nearby sold comps map
Loading sold comps map…
Walkable amenities ~0.75 mi
Loading nearby amenities…
Taxation est. · year 1
- Rental income
- $19,909
- − Mortgage interest
- −$12,043
- − Property taxes
- −$962
- − Insurance
- −$1,075
- − Repairs & maintenance
- −$1,593
- − Management
- −$1,593
- − Depreciation
- −$6,255
- Taxable loss
- −$3,611
- Est. tax savings @ 24.0%
- +$867
- After-tax cash flow
- $1,028/yr
For passive investors: Depreciation is non-cash, so a rental often shows a tax loss while cash-flowing — sheltering income. Rental losses are passive: they offset passive income freely, and up to $25,000/yr can offset ordinary (W-2) income if you actively participate and your MAGI is under $100k (phasing out to $0 by $150k); unused losses carry forward. On sale, claimed depreciation is recaptured at up to 25%, and gains may owe capital-gains tax (a 1031 exchange can defer both). Figures are a year-1 estimate at your 24.0% rate — not tax advice; consult a CPA.
Schools (NCES district)
- District
- Columbia County
- NCES district ID
- 1301410
- Math proficiency
- 49% ▼ -6.00%
- Reading proficiency
- 52% ▼ -4.00%
- Median HH income
- $69,358
- Composite
- 45.04/100
- National rank
- #2695
- State rank
- #13 of 174 in GA
Livability — Harlem
- Score
- 64/100
- State rank
- #256
- US rank
- #14109
Category grades
Schools grade is shown separately in the Schools card above.
Census & demographics
- Population (ZIP)
- 10,767
Population outlook (Columbia County) Hauer SSP2
- Today (2025)
- 189,073 people
- By 2030
- 212,277 · +12.3%
- By 2040
- 259,480 · +37.2%
- By 2050
- 306,991 · +62.4%
- By 2075
- 421,213 · +122.8%
- By 2100
- 496,722 · +162.7%
Race, ethnicity, and origin ACS 2023
- Neighborhood character
- Predominantly White (68%)
- Race & ethnicity
- White 68% Black 23% Two or more races 5% Hispanic / Latino 3% Asian 1%
- Common ancestry
- Romanian 2% Serbian 2% Scottish 2%
- Foreign-born
- 2% · Canada, China
- Languages at home
- 97% English-only · Spanish 2% Chinese 1%
Political lean MEDSL · Columbia
- 2024 margin
- Strong R (+25.6) · D 36.8% · R 62.5%
- 2008→2024 swing
- +17.0pp toward D · 2008: -42.7pp · 2024: -25.6pp
- All cycles
- 2024: R+25.6 2020: R+25.8 2016: R+37.7 2012: R+43.0 2008: R+42.7
Not yet ingested
- Civics
- —
Market trends
- HPI YoY
- ▼ -10.65%
- Current HPI
- 279.1916
- Rent YoY
- —
- Metro
- —
- State GDP YoY
- ▲ 2.66%
- F500 in state
- 28
Industry mix (Fortune 500 HQ in GA)
| Industry | F500 HQs | Revenue |
|---|---|---|
| Paper / Packaging | 2 | $29B |
|
||
| Retail | 1 | $160B |
|
||
| Transportation / Logistics | 1 | $91B |
|
||
| Airlines | 1 | $62B |
|
||
| Consumer Goods | 1 | $47B |
|
||
| Utilities | 1 | $25B |
|
||
Price history
+1195.2% since first listed17 events — show timeline
- 2026-04-27 Pending — Hive MLS
- 2026-04-20 Relisted — Hive MLS
- 2026-04-05 Listing Removed — Hive MLS
- 2026-04-05 Listing Removed — Hive MLS
- 2026-03-31 Pending — Hive MLS
- 2026-03-31 Listing Removed — Hive MLS
- 2026-03-27 Listed $215,000 Hive MLS
- 2026-03-27 Listed $215,000 Hive MLS
- 2025-07-15 Listing Removed — Hive MLS
- 2025-07-15 Listing Removed — Hive MLS
- 2025-07-14 Listed $199,900 Hive MLS
- 2025-07-14 Listed $199,900 Hive MLS
- 2003-10-22 Sold (Public Records) $28,192 Public Records
- 2003-06-05 Sold (Public Records) $23,075 Public Records
- 2001-08-24 Sold (Public Records) $19,000 Public Records
- 2000-09-05 Sold (Public Records) $17,150 Public Records
- 1999-11-11 Sold (Public Records) $16,600 Public Records
Property tax history
+2.8%/yrLatest (2025): $962 · +2.7% YoY. Source: county tax records.
Cash-flow waterfall
monthlySold comps — $/sqft
last 12 mo · ≤1 miLoading sold comps…