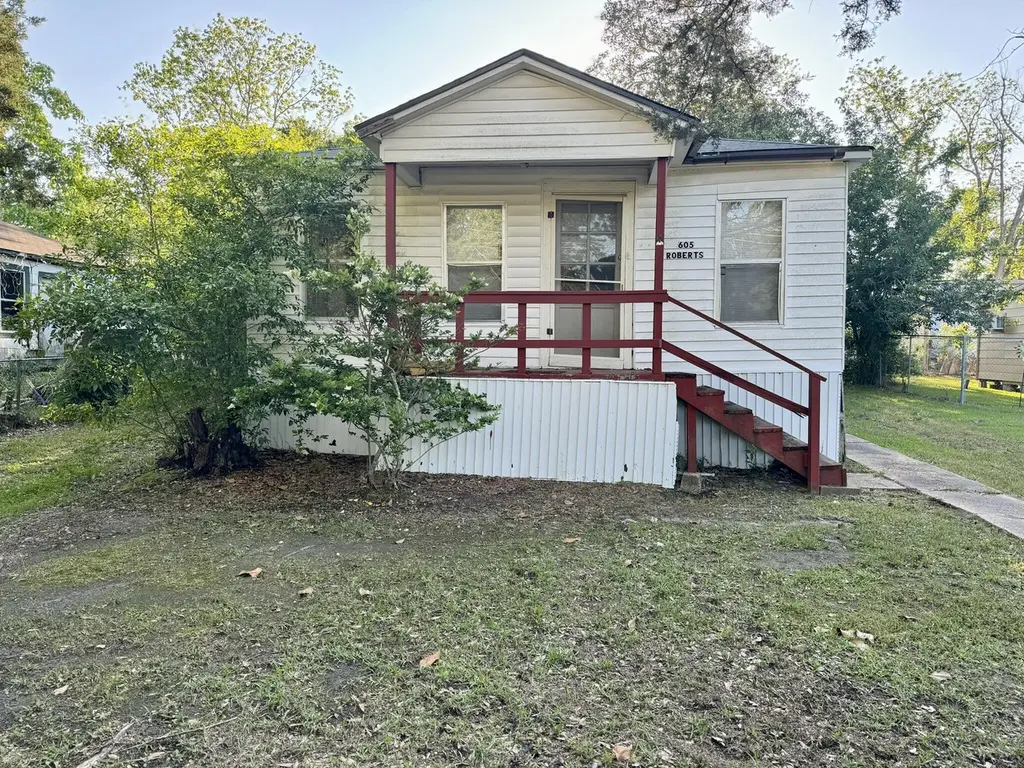
605 Roberts St · DeRidder, LA
Flood risk 1/10 · Minimal
- FEMA flood zone
- X (unshaded)
- Chance of flooding over 30 yrs
- 0.0%
- Est. flood insurance / yr
- $507 – $1,088
Fire risk 2/10 · Minimal
- Est. fire insurance / yr
- $1,269 – $2,357
Heat risk 8/10 · Major
- Hot days now (above 110°F)
- 7 days/yr
- Hot days in 30 yrs
- 20 days/yr
Wind risk 8/10 · Major
- Chance of severe wind over 30 yrs
- 99.0%
Air-quality risk 2/10 · Minimal
- Unhealthy air days now
- 1 days/yr
- Unhealthy air days in 30 yrs
- 1 days/yr
Risk factors via First Street. Map © Google.
Why this score? — see what drove the B- grade
The composite is a weighted blend of 9 inputs, each scored 0–100. Each bar is that input's sub-score; the figure is the points it added to the 100-point composite (weight × sub-score).
- Cash flow +30.0/30.0
- 1% rule +10.0/10.0
- DSCR +10.0/10.0
- ARV discount +7.5/15.0
- Livability +3.6/5.0
- Schools +3.0/10.0
- Rent growth +2.5/5.0
- Condition / age +2.5/5.0
- Appreciation +0.0/10.0
$36,000
🖨 Deal sheet 📄 Offer letter ✓ Due diligence
Listing remarks MLS
Motivated seller. Great investment property located in town! This 3 bedroom and 2 bath home is ready for you to put your personal touches on.
Key facts
- Investment property
- Located in town
- 7,841 sq ft lot
Tags
Neighborhood map
What this means for you Summary
Snapshot
- This is a 3-bed/1.0-bath single-family listed at $36k.
Deal economics
- At list price, monthly cash flow is $644 ($8k/yr) — positive.
- The deal already cash-flows at list — no discount required.
- Meets the 1% rule at list price ($1k rent vs $36k).
- Recommended offer: $32k (12.0% below list) — sets the bar for market timing.
- Cap rate 27.8% vs local median 4.8% in DeRidder — top-decile yield for the area; either an underpriced asset or a hidden risk that comps aren't pricing in. Stress-test before assuming the spread holds.
Location & tenants
- Location reads 72/100 on livability (#43 in LA) — a middle-class / working-renter tenant base. Strengths: cost of living A+, housing A+, health & safety A+; Watch: amenities F, commute F, employment D-.
- Beauregard Parish (rural): math 30% / reading 41% proficiency, ranked #32 of 98 in LA (top 33%) — families likely to look elsewhere, expect single-tenant / working-renter base with shorter leases.
- Market conditions: 241 active listings in the ZIP; 2 comparable units currently listed for rent nearby; 83 units permitted in Beauregard Parish in 2024 (0 in 5+ unit buildings).
Forward outlook
- Local home prices are declining (-3.0%/yr); year-one equity from $249 of loan paydown is wiped out by about $1k of value loss. Plan a longer hold.
- At projected returns (-3.0% appreciation + 3.0% rent growth), your $10k cash investment doubles in ~2 years — after that, you're playing with house money.
Negotiation context
- It's been on market 775 days — a 12% lower offer ($32k) is reasonable based on typical stale-listing flexibility.
- 3 sale attempts since 2y ago; this cycle's ask has dropped $22k (38%) from the opening price — seller is motivated, your offer sets the floor, not the list.
Risks & watch-outs
- Climate carrying-cost: severe wind risk, 99% chance of damaging wind over 30y; extreme-heat days projected 7→20/yr by 2055 (HVAC capex compounding) — expect insurance premiums to compound above CPI over the hold.
Questions for the listing agent
- It's been on market 775 days. Have you received any prior offers? Is the seller open to a 12% concession, seller financing, or rate buy-down credit?
- Why hasn't it sold? Are there any deal-killer items the seller is aware of (foundation, flood, title, zoning, code violations)?
- Is there a deadline driving the sale (1031 exchange, divorce, estate, relocation)? That informs how much negotiation room exists.
- Schools are B-rated — typically a magnet for longer-tenancy family renters. What's the average tenant stay here, and is there a school-zone premium baked into asking?
- What's the average days-on-market for RENTAL listings here right now (not sales)? A rising rental-DOM trend means longer vacancies and softer asking-rent achievability than the comps imply.
- What's the recent tenant-quality profile in this submarket — average credit score on applications, eviction rate, late-payment / NSF rate, and stable-employment percentage? A property-management company in the area should have these aggregated.
- How much new for-sale + rental construction is in the pipeline within 1–3 miles? Heavy new supply typically softens prices + rents 12–24 months out; constrained supply supports both.
Investment metrics
- 1% rule
- 3.05% ✓
- Cap rate
- 27.77%
- Cash-on-cash
- 76.71%
- DSCR
- 4.41
- GRM
- 2.7
CMA / ARV
- ARV (median comp)
- $102,525
- List price
- $36,000
- Delta
- -64.89%
- Verdict
- UNDERPRICED
- Comps
- 20 within 1.0 mi
Show comp detail 12 sales within ~0.75 mi
| Address | Dist | Beds/Ba | Sqft | Sold | Price | $/sf | Match |
|---|---|---|---|---|---|---|---|
| 510 N Texas St | 0.10mi | 3/2.0 | 1,334 (+1%) | 16mo | $44,000 | $33 | 76 |
| 604 Magnolia St | 0.23mi | 2/1.0 (-1) | 1,339 (+1%) | 21mo | $135,500 | $101 | 65 |
| 605 Barbara St | 0.68mi | 3/1.5 | 1,306 (-1%) | 2mo | $153,000 | $117 | 63 |
| 607 Magnolia St | 0.20mi | 3/2.0 | 1,280 (-3%) | 24mo | $160,000 | $125 | 62 |
| 1441 Bilbo St | 0.46mi | 3/2.0 | 1,375 (+4%) | 12mo | $159,900 | $116 | 58 |
| 1110 High School Dr | 0.50mi | 2/1.0 (-1) | 1,259 (-5%) | 11mo | $126,000 | $100 | 55 |
| 315 Dick Allen St | 0.46mi | 3/2.0 | 1,367 (+4%) | 18mo | $174,000 | $127 | 53 |
| 315 N Royal St | 0.28mi | 2/1.5 (-1) | 1,188 (-10%) | 13mo | $115,000 | $97 | 52 |
| 118 S Division St | 0.51mi | 2/2.0 (-1) | 1,410 (+7%) | 11mo | $167,000 | $118 | 47 |
| 507 Fair St | 0.29mi | 2/2.0 (-1) | 1,189 (-10%) | 17mo | $50,000 | $42 | 47 |
| 501 Stacey Ln | 0.66mi | 3/2.0 | 1,200 (-9%) | 7mo | $169,000 | $141 | 44 |
| 412 S Royal St | 0.70mi | 2/2.0 (-1) | 1,359 (+3%) | 21mo | $55,000 | $40 | 36 |
Match score weights: distance 35% · size 25% · config 20% · recency 20%. Top-matched comps best support the ARV.
Projected returns pro-forma
-3.0% appreciation · 3.0% rent growth · sell at horizon
- IRR
- 76.7%
- Equity multiple
- 4.49×
- Total profit
- $35,206
- Equity at exit
- $5,368
- IRR
- 80.3%
- Equity multiple
- 9.28×
- Total profit
- $83,504
- Equity at exit
- $3,113
Cash invested: $10,080 (down + closing). Projections, not guarantees.
Landlord ↔ Tenant lean methodology
- Overall (STATE)
- 90 Strongly Landlord-Friendly
- State Louisiana
- 90 Strongly Landlord-Friendly · R+12
- County
- — inherits STATE
- City
- — inherits STATE
ZIP-level market 70634
- Home prices YoY
- -30.6%
- Active inventory
- 241
- Price-to-rent
- 2.7×
Monthly cashflow live
- Estimated rent
- $1,099 medium interval (Pro) →
- Mortgage (P&I)
- −$189
- Tax from tax record
- −$20 /mo · $238/yr
- Insurance
- −$15
- HOA
- −$0
- Vacancy / Maint / Mgmt
- −$231
- Net cashflow
- $644
Break-even live
UW: 25.0% down · 7.5% · 30yr · 1.5% tax · 5.0% vac · 8.0% maint · 8.0% mgmt
Financing live
Cash to close
- Down payment
- $9,000
- Closing costs
- $1,080
- Reserves months
- —
- Total cash needed
- —
Loan-product check · same deal, 3 products live
Conventional
25% down · 7.5% · 30yr
- Down + closing
- —
- Monthly P&I
- —
- Monthly cashflow
- —
- DSCR
- —
- Eligible?
- —
Personal DTI + credit; lowest rate.
DSCR
20% down · 8.5% · 30yr
- Down + closing
- —
- Monthly P&I
- —
- Monthly cashflow
- —
- DSCR
- —
- Eligible?
- —
No personal income docs; deal must DSCR.
Hard money
10% down · 12.0% · 12mo
- Down + closing
- —
- Monthly P&I
- —
- Monthly cashflow
- —
- DSCR
- —
- Eligible?
- —
Short-term bridge; refi at stabilization.
Rent comps 2 comps
| Address | Beds | Baths | Sqft | Rent | $/sqft | DOM | Units | Dist |
|---|---|---|---|---|---|---|---|---|
| 124 Azalea Ave Deridder, LA | 3.0 | 2.0 | 1440 | $1,000 | $0.69 | 13d | 1 | 0.96mi |
| 1014 W 9th St Deridder, LA | 3.0 | 2.0 | 1224 | $1,200 | $0.98 | 44d | 1 | 1.00mi |
Listing history 26 events
-
2026-06-19days on market $36,000 Active 775 DOM
-
2026-06-18days on market $36,000 Active 774 DOM
-
2026-06-17days on market $36,000 Active 773 DOM
-
2026-06-16days on market $36,000 Active 772 DOM
-
2026-06-15days on market $36,000 Active 771 DOM
-
2026-06-14days on market $36,000 Active 769 DOM
-
2026-06-13days on market $36,000 Active 768 DOM
-
2026-06-10days on market $36,000 Active 766 DOM
-
2026-06-09days on market $36,000 Active 765 DOM
-
2026-06-08days on market $36,000 Active 764 DOM
-
2026-06-07days on market $36,000 Active 763 DOM
-
2026-06-03days on market $36,000 Active 759 DOM
-
2026-06-02days on market $36,000 Active 758 DOM
-
2026-06-01days on market $36,000 Active 757 DOM
-
2026-05-31days on market $36,000 Active 756 DOM
-
2026-05-30days on market $36,000 Active 755 DOM
-
2026-04-24price $36,000 141-char remark
Show marketing remark (141 chars)
Motivated seller. Great investment property located in town! This 3 bedroom and 2 bath home is ready for you to put your personal touches on.
-
2026-04-01status Active 141-char remark
Show marketing remark (141 chars)
Motivated seller. Great investment property located in town! This 3 bedroom and 2 bath home is ready for you to put your personal touches on.
-
2026-03-25historical 141-char remark
Show marketing remark (141 chars)
Motivated seller. Great investment property located in town! This 3 bedroom and 2 bath home is ready for you to put your personal touches on.
-
2025-12-29price $41,000 141-char remark
Show marketing remark (141 chars)
Motivated seller. Great investment property located in town! This 3 bedroom and 2 bath home is ready for you to put your personal touches on.
-
2025-10-30price $45,000 141-char remark
Show marketing remark (141 chars)
Motivated seller. Great investment property located in town! This 3 bedroom and 2 bath home is ready for you to put your personal touches on.
-
2025-07-14price $49,000 141-char remark
Show marketing remark (141 chars)
Motivated seller. Great investment property located in town! This 3 bedroom and 2 bath home is ready for you to put your personal touches on.
-
2025-05-01status Active 141-char remark
Show marketing remark (141 chars)
Motivated seller. Great investment property located in town! This 3 bedroom and 2 bath home is ready for you to put your personal touches on.
-
2025-04-30historical 141-char remark
Show marketing remark (141 chars)
Motivated seller. Great investment property located in town! This 3 bedroom and 2 bath home is ready for you to put your personal touches on.
-
2024-08-29price $54,000 141-char remark
Show marketing remark (141 chars)
Motivated seller. Great investment property located in town! This 3 bedroom and 2 bath home is ready for you to put your personal touches on.
-
2024-04-27$58,000 Active 141-char remark
Show marketing remark (141 chars)
Motivated seller. Great investment property located in town! This 3 bedroom and 2 bath home is ready for you to put your personal touches on.
ⓘ Source: listings_history table (triggers on properties + properties_extension) + one-shot
backfill from property_details.listing_events for pre-trigger history.
Tax reassessment forecast LA · Resets to sale price
- Current annual tax
- $238 · $20/mo
- Projected year-2 tax
- $238 · $20/mo
- Expected delta
- $0/yr ($0/mo · 0.0%)
ⓘ Screening estimate from a state-policy table — verify with the county assessor before closing.
Climate risk First Street
- Flood 1/10 Low FEMA zone X (unshaded) · 0% chance over 30 yrs
- Wildfire 2/10 Low
- Heat 8/10 Severe 7 d/yr ≥110°F today · 20 d/yr by 30 yrs out
- Wind 8/10 Severe 99% chance of damaging wind over 30 yrs
- Air quality 2/10 Low 1 unhealthy d/yr today · 1 by 30 yrs out
Nearby sold comps map
Loading sold comps map…
Walkable amenities ~0.75 mi
Loading nearby amenities…
Taxation est. · year 1
- Rental income
- $13,184
- − Mortgage interest
- −$2,017
- − Property taxes
- −$238
- − Insurance
- −$180
- − Repairs & maintenance
- −$1,055
- − Management
- −$1,055
- − Depreciation
- −$1,047
- Taxable income
- $7,593
- Est. tax owed @ 24.0%
- −$1,822
- After-tax cash flow
- $5,910/yr
For passive investors: Depreciation is non-cash, so a rental often shows a tax loss while cash-flowing — sheltering income. Rental losses are passive: they offset passive income freely, and up to $25,000/yr can offset ordinary (W-2) income if you actively participate and your MAGI is under $100k (phasing out to $0 by $150k); unused losses carry forward. On sale, claimed depreciation is recaptured at up to 25%, and gains may owe capital-gains tax (a 1031 exchange can defer both). Figures are a year-1 estimate at your 24.0% rate — not tax advice; consult a CPA.
Schools (NCES district)
- District
- Beauregard Parish
- NCES district ID
- 2200180
- Math proficiency
- 30% ▼ -40.00%
- Reading proficiency
- 41% ▼ -35.00%
- Median HH income
- $46,033
- Composite
- 30.34/100
- National rank
- #6265
- State rank
- #32 of 98 in LA
Livability — DeRidder
- Score
- 72/100
- State rank
- #43
- US rank
- #6227
Category grades
Schools grade is shown separately in the Schools card above.
Census & demographics
- Census place
- DeRidder, LA
- Population (ZIP)
- 25,038
Population outlook (Beauregard County) Hauer SSP2
- Today (2025)
- 37,760 people
- By 2030
- 38,140 · +1.0%
- By 2040
- 38,518 · +2.0%
- By 2050
- 38,164 · +1.1%
- By 2075
- 36,437 · -3.5%
- By 2100
- 32,493 · -13.9%
Race, ethnicity, and origin ACS 2023
- Neighborhood character
- Predominantly White (72%)
- Race & ethnicity
- White 72% Black 14% Two or more races 9% Hispanic / Latino 5% Asian 1%
- Hispanic origin (detail)
- Mexican 3% Puerto Rican 1%
- Common ancestry
- Lithuanian 6% Slovak 1% Italian 1%
- Foreign-born
- 2% · Canada
- Languages at home
- 96% English-only · Spanish 2% French/Haitian/Cajun 1%
Political lean MEDSL · Beauregard
- 2024 margin
- Solid R (+71.3) · D 13.8% · R 85.1% · Other 1.1%
- 2008→2024 swing
- -16.9pp toward R · 2008: -54.3pp · 2024: -71.3pp
- All cycles
- 2024: R+71.3 2020: R+67.5 2016: R+65.3 2012: R+58.2 2008: R+54.3
Not yet ingested
- Civics
- —
Market trends
- HPI YoY
- ▼ -57.61%
- Current HPI
- 130.4445
- Rent YoY
- —
- Metro
- —
- State GDP YoY
- ▲ 3.29%
- F500 in state
- 10
Industry mix (Fortune 500 HQ in LA)
| Industry | F500 HQs | Revenue |
|---|---|---|
| Telecommunications | 2 | $23B |
|
||
| Utilities | 1 | $12B |
|
||
| Wholesale / Distribution | 1 | $5B |
|
||
| Advertising | 1 | $2B |
|
||
Price history
-37.9% since first listed10 events — show timeline
- 2026-04-24 Price Changed $36,000 GFPAR
- 2026-04-01 Relisted — GFPAR
- 2026-03-25 Delisted — GFPAR
- 2025-12-29 Price Changed $41,000 GFPAR
- 2025-10-30 Price Changed $45,000 GFPAR
- 2025-07-14 Price Changed $49,000 GFPAR
- 2025-05-01 Relisted — GFPAR
- 2025-04-30 Delisted — GFPAR
- 2024-08-29 Price Changed $54,000 GFPAR
- 2024-04-27 Listed $58,000 GFPAR
Property tax history
+0.2%/yrLatest (2025): $238 · +0.7% YoY. Source: county tax records.
Cash-flow waterfall
monthlySold comps — $/sqft
last 12 mo · ≤1 miLoading sold comps…